Publisher’s version / Version de l'éditeur:
Journal of Testing and Evaluation, 14, 3, pp. 163-167, 1986-05
READ THESE TERMS AND CONDITIONS CAREFULLY BEFORE USING THIS WEBSITE. https://nrc-publications.canada.ca/eng/copyright
Vous avez des questions? Nous pouvons vous aider. Pour communiquer directement avec un auteur, consultez la première page de la revue dans laquelle son article a été publié afin de trouver ses coordonnées. Si vous n’arrivez pas à les repérer, communiquez avec nous à [email protected].
Questions? Contact the NRC Publications Archive team at
[email protected]. If you wish to email the authors directly, please see the first page of the publication for their contact information.
NRC Publications Archive
Archives des publications du CNRC
This publication could be one of several versions: author’s original, accepted manuscript or the publisher’s version. / La version de cette publication peut être l’une des suivantes : la version prépublication de l’auteur, la version acceptée du manuscrit ou la version de l’éditeur.
Access and use of this website and the material on it are subject to the Terms and Conditions set forth at
Measurement of granule coverage on bituminous roofing surfaces
Dutt, O.
https://publications-cnrc.canada.ca/fra/droits
L’accès à ce site Web et l’utilisation de son contenu sont assujettis aux conditions présentées dans le site LISEZ CES CONDITIONS ATTENTIVEMENT AVANT D’UTILISER CE SITE WEB.
NRC Publications Record / Notice d'Archives des publications de CNRC:
https://nrc-publications.canada.ca/eng/view/object/?id=2cf97f7b-4d73-41fd-a514-990836c2073c
https://publications-cnrc.canada.ca/fra/voir/objet/?id=2cf97f7b-4d73-41fd-a514-990836c2073c
Ser
THl
N21d
National Research
Conseil national
no,
1380
I$
council canada
de recherches Canada
c.
2
B m
,
Institute for
lnstitut de
- - - - A
Research in
recherche en
Construction
construction
Measurement of Granule Coverage on
Bituminous Roofing Surfaces
by
0.
Dutt
Reprinted from
ASTM
Journal of Testing and Evaluation
Vol. 14, No.
3,
May 1986
p. 163-167
(IRC Paper No. 1380)
Price $2.00
NRCC 25957
. . NRC--
c1s-nIILDC.
RES.
L I B R A R Y
Des methodes ont St6 mises au point pour mesurer la surface de
bitume exposde d'un toit recouvert de granules.
Ces methodes
comprennent un examen microscopique en coupe, la technique de
l'analyse d'image et des mesures photodtriques.
On
a soumis
3
des essais trois 6chantillons spgcialement prgpargs pour
verifier dans quelle mesure les granules couvrent la surface.
On
a analysg plus
B fond un des Qchantillons apres avoir retire
progressivement des granules de sa surface. L'etude a montr6
que l'exposition du bitume peut Stre reliee aux pertes de
granules.
Authorized Reprint from
Journal of Testing and Evaluation, May
1986
Copyright
American Society for Testing and Materials
19 16 Race Street, Philadelphia, PA 191 03
1986
Measurement of Granule Coverage on Bituminous
Roofing Surfaces
REFERENCE: Dutt, 0 . . "Measurement of Granule Coverage on Bitu- minous Roofing Surfaces," Journal of Testing and Evaluation. JTEVA, Vol. 14, No. 3, May 1986, pp. 163-167.
ABSTRACT: Methods were developed to measure the exposed area of bitumen on a granule-covered roofing surface. They included traverse microscopical examination, image analysis technique, and photometric measurements. Three specially prepared samples were tested for gran- ule coverage. One of the samples was further tested for the exposed area of bitumen after progressively removing granules from its surface. The study showed that the exposure of bitumen could be related to the loss of granules.
KEY WORDS: bitumen exposure, bituminous surface, granular pro- tection, granule loss, image analyzer, linear traverse, photometers, roofing
dard steel-wire brush under specified conditions should not exceed the specified limit according to the UL Standard for Safety: Class C Asphalt Organic-Felt Sheet Roofing and Shingles (UL
55B).
The main emphasis of this test is the assessment of adhesion of granules rather than the amount of coverage provided or the consequences resulting from the loss of granules, although there may be some relationship between the two. In order to make a more realistic as- sessment of the role of granules, the evaluation should take into account the exposed area of bitumen as well. The objectives of the present study were 1) to develop methods for measuring the ex- posed area on a granule-covered surface, and 2) to investigate the relationship between the mass of granules lost to the amount of bituminous surface area exposed on the membrane.Experimental Methods
and
ResultsIn bituminous roofing materials, the exposure of bituminous surfaces to natural agents, such as air, moisture, heat, and ultravi- olet (UV) radiation, causes degradation of bitumen. Ultraviolet ra- diation is the main factor in photo-oxidation that breaks down the molecular structure of the bitumen to produce water soluble sub- stances; these, in turn, are leached out, leading to increased brit- tleness, cracking, and further exposure of lower layers of fresh bi- tumen [I]. The protection of the surface is therefore important to ensure durability of bituminous roofing materials.
On built-up roofing, gravel provides protection from ultraviolet rays. Tile and concrete are often used when a traffic surface is re- quired [2]. Shingles, roll roofing, and some modified bituminous membranes have factory-applied mineral granules. Others have metal foil or surfaces treated with a UV retardant. Some liquid- applied bituminous membranes are protected with sprayed acrylic or aluminum emulsions, granules, or gravel. Inverted or protected membrane roofing systems provide protection of the roofing sur- face as well as other beneficial thermal and insulating characteris- tics [ 3 . 4 ] .
The granules used on roofing membranes are crushed stone, slate, ceramic, or blast furnace slag. They are graded to provide adequate coverage when spread and rolled over bitumen-coated
:
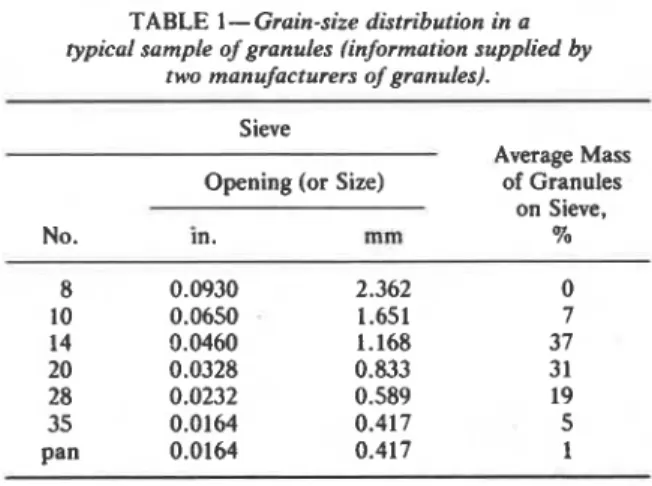
surfaces. A typical grain size distribution of roofing granules is given in Table 1. Complete coverage of the bitumindus surface is only theoretically possible because of the shape of the granules [5]. The present test for granule embedment requires that the mass of granules lost from the roofing surface when rubbed with a stan-Sample Preparation
Three samples of bituminous roofing materials (Sl, S2, and S3), specially prepared by a manufacturer, were stated to have 100,92, and 78% granule coverage, which amounts to 0, 8, and 22% area of exposed bitumen, respectively. This claim was based on an as- sumption that 1.8 kg/m2 of granules applied on Sample S1 would completely cover the surface (sizing of granules as given in Table 1). Samples S2 and S3 were obtained by brushing off 8% and 22%. respectively, of mass of granules from S1.
Specimens from the above samples were subjected to various tests for estimating the area of exposed bitumen. In some tests
TABLE 1
-
Grain-size distribution in a typical sample of granules (information supplied bytwo manufacturers ojgranules). Sieve
Average Mass Opening (or Size) of Granules
on Sieve, No. in. mrn 70 8 0.0930 2.362 0 10 0.0650 1.651 7 14 0.0460 1.168 37 20 0.0328 0.833 3 1 28 0.0232 0.589 19 'Research Scientist, Division of Building Research, National Research 35 0.0164 0.417 5 Council of Canada, Ottawa, Ontario, Canada K I A OR6. Member of Pan 0.0164 0.417 1 ASTM.
O 1986 by the American Society for Testing and Materials
164
JOURNAL OF TESTING AND EVALUATIONwhere the specimens could not be used because of the thickness, surface roughness, or poor depth of field of observation, photo- copies or photo-mechanical-transfer (PMT) prints of the speci- mens were used.
In the photometric methods, which are based on luminance of granule covered surfaces, it was necessary to apply a correction to the readings obtained from photographic images because they in- terpreted the darkness of veins and chips as bitumen and included some effect of the greyness of granules. This correction was accom- plished by using a reference surface prepared with the granules re- moved from the samples and glued on a Bristol board. The read- ings for this surface, and for a bituminous surface with granules removed, were considered as working standards for computing results of other specimens which included exposed areas of bitu- men. Photocopies of the samples and the reference surface used for tests are shown in Fig. 1.
Linear Traverse Method of Void Measurements
This method is based on ASTM Recommended Practice for Mi- croscopical Determination of Air-Void Content and Parameters of the Air-Void Systems in Hardened Concrete (ASTM C 457). In that method a ground section of a concrete specimen is examined microscopically along a series of regularly spaced lines of traverse to obtain the following results: I) total number of voids intersected, 2) total distance (t') traversed across voids, and 3) total length of lines (L) traversed across the representative specimen being o b - served. The recommended minimum length of traverse for this test is specified according to the size of aggregate. The percent of air- void content is computed as V = (100 X P )
+
L. The use of this technique for measuring the uncovered areas of asphalt needed care because, unlike concrete, asphalt does not lend itself to prepa- ration of a smooth section, the voids are random in shape and depth, and the granules are variable in size, form, and embed- ment. The measurements were performed by different operators on various granular surfaces to ensure that the standard deviation was within specified limits. The minimum length of traverse for theR E F E R E N C E S U R F A C E
tests was adopted as 900 mm, which was derived by graphically extending the tabulated values given in ASTM C 457 to a maxi- mum granule size of 2.3 mm (Fig. 2). Figure 3 shows the equip- ment used for the measurements.
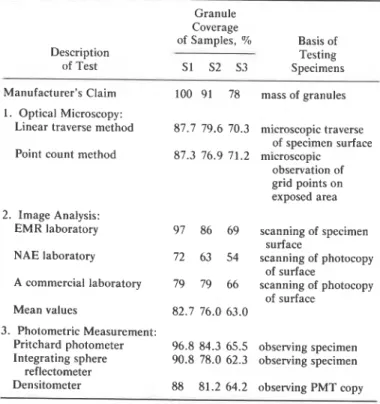
The results of linear traverse tests for granule coverage on Sam- ples SI, S2, and S3 indicated 87.7, 79.6, and 70.3% coverage, re- spectively (Table 2). Although quantitatively different, the trend in results is similar to the manufacturer's estimate.
Point Count Method
This method, based on statistical considerations, is also part of the recommended practice for measuring the void ratio in concrete (ASTM C 457). The specimen is examined under a light micro- scope for the frequency of voids that coincides with a number of points in a regular system of grid intersections. The number of co- inciding points divided by the total number of grid points exam- ined yields the air-void content in the concrete specimen. This sta- tistical approach was adopted for measuring exposure of asphalt after investigating its dependability by comparing results of re- peated tests. The minimum number of grid points for the test was adopted as 400, derived graphically (Fig. 2), as with the linear tra- verse method. The equipment used for the experiment consists of a travelling microscope which moves over a granular surface of the specimen being tested and stops at points at a set spacing to iden- tify whether the grid intersection point falls within bituminous or granular areas. F R O M T A B L E 3 A S T M C 4 5 7
,iO
/ # #-
/ /)-
LENGTH OF TRAVERSE FOR
-
mm MAX. GRANULE S I Z E-
NUMBER OF POINTS FOR 2.3 mm MAX. GRANULE S I Z E
I
N O M I N A L S I Z E O F A G G R E G A T E , m m FIG. 1-Photocopies of three samples and a granule-covered reference FIG. 2- Optimal length of traverse and numbers in point count method
D ~ T T ON GRANULE COVERAGE ON BITUMINOUS ROOFING SURFACES
165
group, thus placing certain limitations on its use for granular sur- faces. These may be summarized as follows:
1. It was necessary that the granules be of light shade (i.e., have high reflectance) to provide contrast with dark asphalt.
2. Shadows of overlapping granules, which get included as dark areas, required image modification and focussing adjustment for an uneven surface in order to eliminate the effect of shadows. The same applied to the dark streaks and spots on stones as well as to the dark interior of granules broken during manufacture, han- dling, or application.
FIG. 3-Linear traverse apparatus: travelling platform, microscope, and counters for linear measurements and point count.
TABLE 2-Granule coverage of bituminous surfaces of special samples. Granule
Coverage
of Samples, % Basis of
Description Testing
of Test S1 S2 S3 Specimens Manufacturer's Claim 100 91 78 mass of granules I . Optical Microscopy:
Linear traverse method 87.7 79.6 70.3 microscopic traverse of specimen surface Point count method 87.3 76.9 71.2 microscopic
observation of grid points on exposed area 2. Image Analysis:
EMR laboratory 97 86 69 scanning of specimen surface
NAE laboratory 72 63 54 scanning of photocopy of surface
A commercial laboratory 79 79 66 scanning of photocopy of surface
Mean values 82.7 76.0 63.0 3 . Photometric Measurement:
Pritchard photometer 96.8 84.3 65.5 observing specimen Integrating sphere 90.8 78.0 62.3 observing specimen
reflectometer
Densitometer 88 81.2 64.2 observing PMT copy
The granule coverage on Samples S1, S2, and S3, using the point count method, was found to be 87.3, 76.9, and 71.2%, re- spectively (Table 2). These results are very close to those obtained by the linear traverse method.
Image Analysis
Image analysis is the interpretation and recognition of a pattern using an image analysis computer system. A high resolution scan- ner (like a TV camera) acquires an electronic image of the visual images. The computer system converts and stores the color infor- mation of picture elements as numerical data, and then processes them to give the desired output of areas, perimeters, and other nu- merical values.
The use of this method was considered for the computation of exposed bituminous areas on granular roofing membranes. Three
3. Some analyzers could only take a photograph or photocopy of the granular surface, because they were designed with a narrow slot for receiving the specimens. This, again, required light-shaded stones to produce a contrasting color on the print.
The image analyzer results (Table 2) show a large variation from one set of values to the other, which may be attributed to the afore- mentioned limitations. Although the results are different from those obtained by other methods, they differentiate between the greatest and the least coverage. Low values of coverage for Sample S3 were apparently caused by the granules being smeared with bi- tuminous dust during preparation by the manufacturer for the present study; this increased the overall darkness of the sample surface and consequently reduced the value of coverage.
Spectra Pritchard Photoelectric Luminance Photometer
The photometric measurement of brightness of a surface (lumi- nance) using reflected light from a sample is taken and compared with that obtained for the reference surfaces (bituminous surface and fully covered with granules). The luminance of the surface un- der examination gives a measure of the percentage of black area.
The Spectra Pritchard photoelectric luminance photometer used in this experiment has a telescopic viewing system with a 7-in. F3-5 objective lens and 3 mm aperture (Fig. 4 a ) . A hemispherical light- ing unit provides uniform illumination
of
the sample surface which, in this case, covers a circular area 17 mm in diameter. The apparatus images the object in the cathode of the photoemissive tube. A separate unit combines the power supply with the controls and readout meter. The equipment is set up in an optical room having walls draped with black felt.different image analyzers were used to assess the applicability of
166
JOURNAL OF TESTING AND EVALUATIONReadings are taken a t many locations on the specimen and the reference surfaces. Since the variation of luminance is assumed to be linear, the values for granular specimens are interpolated be- tween those for the reference surfaces. The readings were supple- mented with those obtained from testing with the Hagner Univer- sal photometer. The results are given in Table 2. Although the trend is the same as in the optical methods, the results for Sample S3 are low, for the same reason that the image analysis results were low. The higher values for Sample S1 may be attributed to the tiny deep hole areas surrounded by closely packed granules becoming blurred due to diffraction.
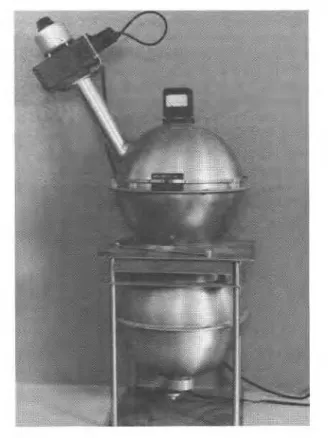
Taylor-Baumgartner Integrating-Sphere Reflectometer
The Taylor-Baumgartner integrating-sphere reflectometer ap- paratus consists of two integrating spheres and barrier-layer (pho- tovoltaic) photocells (Fig. 4 b ) . It serves the dual purpose of a re- flectometer and transmissometer. Transmittance is measured by placing a flat specimen in the opening between the spheres, with the bottom sphere containing the light source and the upper one "le photocells. For reflectance measurements, the instrument em- 1 di ect lighting from the collimating tube placed a t an angle in oper sphere. The beam of light strikes the specimen surface,
,. , .he total reflected light is measured by the photocells. Reflectances of a bituminous surface exposed by removing all granules and of a surface fully covered with granules were mea- sured to establish end points for reference. The reflectance values of the three test samples were used to compute the percentage black areas of asphalt by interpolating between the reference points. The results are given in Table 2.
Compared with the results obtained from the linear traverse test-
ing, Sample S3 shows a low value of coverage. As in the previous case, this discrepancy is attributed to the fact that the surface of Sample S3 was apparently smeared with bituminous streaks dur- ing its manufacture, thus lowering its reflectance. The overall results indicate that the method is quite amenable to adoption in the industry because of its simplicity.
Densitometer
A densitometer is basically a photometer for measuring the opti- cal density of materials. The instrument used in the experiment is a digital densitometer incorporating a micro-computer for measur- ing the density of a monochromatic reflection copy of the image under examination (Fig. 4 c ) . A small circular aperture of 3 mm diameter isolates a single picture element or pixel. The light re- flected from this element is measured with a photodetector, digi- tized, and displayed. Readout values of density of the representa- tive white and black surfaces are adjusted as zero and one hundred, respectively. Readings for the mottled surfaces such as shown in Fig. 1 yield the percentage of black areas.
In this experiment, from statistical considerations, over 200 lo- cations on a grid covering the test area on the PMT copies of each of the three granule-surfaced membrane samples were observed. The mean value of the readings for each membrane was adjusted by subtracting the value for the reference sample, thus eliminating the effect of the dark color of the shadows, veins, and chips and of the greyish color of granules. The results are given in Table 2. They show the same trend as in the other photometric methods.
Exposed Bituminous Surface
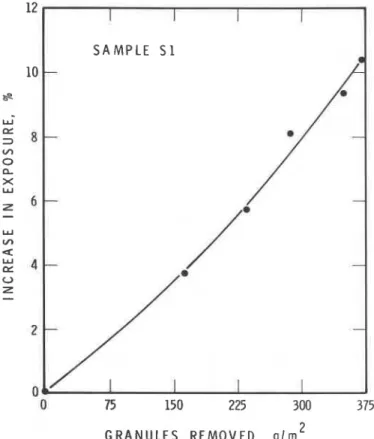
The present standard test for granule embedment in a bitumi- nous surface requires that rubbing of the surface according to specified conditions should not remove more than a certain amount of granules. It does not relate the loss of granules to the consequent exposure of the bitumen. In order to correlate the loss to the exposure of bitumen, one of the methods developed in the study was used t o measure the exposed areas. Two specimens of Sample S t were subjected to a n increasing number of rubbing strokes on the granule embedding test machine (ASTM C 457). Initially, and after each set of rubbing strokes, the exposure of bi- tumen was determined using the linear traverse method. The ex- perimental mean values of the loss of granules and the increase in exposure of bitumen are plotted in Fig. 5 .
It can be deduced from the ascending curve that initially the larger granules, which partly overlap the smaller ones, are rubbed
DUTT ON GR
l2
1
S A M P L ES 1
- --
-
ANULE COVERAGE ON BITUMINOUS ROOFING SURFACES
167
scopic methods of linear traverse and grid point count give the most consistent results. However, they are labor intensive, the lat- ter being comparatively easier and faster. The image analyzer is very fast, but the results are affected by the shadows. Its accuracy depends on the illumination and the operator's judgement of im- ages while modifying them to eliminate shadows. Photometric methods are simple and efficient in use and have potential for on- line recording of granule coverage in a roofing plant. Preparation of reference surfaces or working standards is required for each type of granular surface.
The loss of mass of granules in the standard granule embedment test can be correlated as approximately proportional to the exposed area of bituminous roofing surface. This standard test, however, does not provide value of granule coverage on the original sample. For a fairly accurate assessment of the protection provided by granules, the embedment test and a test measuring the exposed area should be used in conjunction with each other.
Acknowledgments
The author acknowledges with thanks the assistance of G. A. O'Doherty in conducting the laboratory tests and M. J. Quellette for the use of photometers. This paper is a contribution from the Division of Building Research, National Research Council of Can- ada.
FIG. 5-Increase in exposure of bitumen due to loss of granules.
References
off, exposing relatively less area of bitumen. Subsequent removal of the underlying smaller granules exposes a comparatively larger area for the same loss of mass. This may be clarified with a simple example. If a sphere of radius R and mass M covers a unit surface area, eight spheres each of radius VzR, having the same total mass, would cover twice as much area. However, it may be reasonable to assume from the small curvature shown in Fig. 5 that the relation- ship of the loss of granules and the exposed area of bituminous surface is close to linear.
Conclusions
Of all the methods developed for the measurements of area of exposed bitumen on a granule-covered surface, the optical micro-
[ ! ] Cheetham, D. W . and Banfill, P. F. G., "The Uses of Polyvinyl- chloride and Bitumens in Building with Special Reference to Their Possible Interactions," Construction Papers, Vol. 2, No. 2, The Char- tered Institute of Building, U.K., 1983, pp. 91-103.
[2] Tibbetts, D. C. and Baker, M. C., "Mineral Aggregate Roof Surfac- ing," Canadian Building Digest No. 65, Division of Building Research, National Research Council of Canada, Ottawa, 1965.
[ 3 ] Laaly, H. 0. and Dutt, O., "Single Ply Roofing Membranes," Cana- dian Building Digest No. 235, Division of Building Research, National Research Council of Canada, Ottawa, 1985.
[ 4 ] Baker, M. C., "New Roofing Materials," Building Practice Note No. 50, Division of Building Research, National Research Council of Can- ada, Ottawa, 1984.
[ 5 ] Dutt, O., "Mineral Granules: Optimal Grading for Maximum Cover- age," Durability of Building Materials, Elsevier Science Publishers B. V., Amsterdam, The Netherlands, (in press).