HAL Id: hal-01426629
https://hal.inria.fr/hal-01426629
Preprint submitted on 6 Feb 2017
HAL is a multi-disciplinary open access
archive for the deposit and dissemination of sci-entific research documents, whether they are pub-lished or not. The documents may come from teaching and research institutions in France or abroad, or from public or private research centers.
L’archive ouverte pluridisciplinaire HAL, est destinée au dépôt et à la diffusion de documents scientifiques de niveau recherche, publiés ou non, émanant des établissements d’enseignement et de recherche français ou étrangers, des laboratoires publics ou privés.
Model prediction and validation of an order mechanism
controlling the spatio-temporal phenotype of early
hepatocellular carcinoma
François Bertaux, Stefan Hoehme, William Weens, Bettina Grasl-Kraupp, Jan
G. Hengstler, Dirk Drasdo
To cite this version:
François Bertaux, Stefan Hoehme, William Weens, Bettina Grasl-Kraupp, Jan G. Hengstler, et al.. Model prediction and validation of an order mechanism controlling the spatio-temporal phenotype of early hepatocellular carcinoma. 2016. �hal-01426629�
Model prediction and validation of an
order mechanism controlling the
spatio-temporal
phenotype
of
early
hepatocellular carcinoma
Francois Bertaux
1,2,*
,+, Stefan Hoehme
3,*
,+, William Weens
1, Bettina
Grasl-Kraupp
4, Jan G. Hengstler
5, Dirk Drasdo
1,3*
*shared first authorship, +alphabetic ordering, corresponding author: dirk.drasdo@inria.fr
1: INRIA Paris, 2 Rue Simone IFF, 75012 Paris and Sorbonne Universités UPMC Univ. Paris 6, Laboratoire Jacques-Louis Lions, Paris, France
2: Imperial Colleage London, Faculty of Natural Sciences, Department of Mathematics, South Kensington Campus, London SW7 2AZ, UK
3: Interdisciplinary Center for Bioinformatics, University of Leipzig, Leipzig, Germany 4: Department of Medicine I, Division: Institute of Cancer Research, Comprehensive Cancer Center Vienna, Medical University of Vienna, Vienna, Austria
5: Leibniz Research Centre for Working Environment and Human Factors (IfADo), Dortmund, Germany
Abstract
The aggressiveness of a tumor may be reflected by its micro-architecture. To gain a deeper understanding of the mechanisms controlling spatial organization of tumors at early stages after tumor initiation, we used an agent-based spatio-temporal model previously established to simulate features of liver regeneration. Here, this model was further developed to simulate scenarios in early tumor development, when individual initiated hepatocytes gain increased proliferation capacity. The model simulations were performed in realistic liver microarchitectures obtained from 3D reconstruction of confocal laser scanning micrographs. Interestingly, the here established model predicted that initially initiated hepatocytes arrange in elongated patterns. Only when the tumor progresses to cell numbers of approximately 4,000, it adopts spherical structures. This model prediction was validated by the analysis of initiated cells in a rat liver tumor initiation study using single doses of 250 mg/kg of the genotoxic carcinogen N-nitrosomorpholine (NNM). Indeed, small clusters of GST-P positive cells induced by
NNM were elongated, almost columnar, while larger GDT-P positive foci of approximately the size of liver lobuli, adopted spherical shapes. Simulation of numerous possible mechanisms demonstrated that only hepatocyte-sinusoidal-alignment (HSA), a previously discovered order mechanism involved in coordination of liver tissue architecture, could explain the experimentally observed initial deviation from spherical shape. The present study demonstrates that the architecture of small hepatocellular tumor cell clusters early after initiation is still controlled by physiological control mechanisms. However, this coordinating influence is lost when the tumor grows to approximately 4,000 cells, leading to further growth in spherical shape. Our findings stress the potential importance of organ micro-architecture in understanding tumor phenotypes.
Introduction
Phenotype and aggressiveness of a tumor may be influenced by its micro-architecture (Andersson et. al. 2005, Hutchinson et. al. 2016). For this reason, evaluation of histological analysis of the architecture of tumors is part of the standard clinical procedure serving as one aspect of staging and estimation of prognosis (Warth et. al., J. Clinical Oncology, 2012). Depending on the degree of de-differentiation, malign tumors may still reflect features of the original tissue architecture.
To gain a deeper understanding of the mechanisms controlling spatial organization of tumors at early stages after initiation we used a previously established model of liver tissue regeneration (Hoehme et al., 2010).
In that reference, the regeneration of a liver lobule after toxic damage by CCl4 has been
studied.
The liver lobule is the smallest repetitive functional and anatomical unit of liver. It exhibits an about polygonal shape with a central vein in its center and 3-6 portal triads at its margin. A triad is composed of a vein, carrying blood from the intestine, the hepatic artery, leading blood from the aorta, and the biliary duct. Blood flows along rows of hepatocytes until it drains into the central vein. The complex spatial liver lobule architecture ensures an excellent exchange of molecules between the incoming blood and the hepatocytes, the parenchyma cells of the liver. CCl4, a used as a model drug for
paracetamol (acetaminophen) overdose) destroys the hepatocytes close to the central vein of each liver lobule as only those cells express CYP2E1, an enzyme necessary to metabolize the drug. Even after more than 40% tissue damage the liver mass and architecture in experiments using the mouse model were observed to completely regenerate. In order to understand the underlying mechanisms, a pipeline consisting of experiments, image analysis and computational modeling had been established (Hoehme et. al., 2010). In a first step the liver lobule architecture was reconstructed by image processing of confocal laser scanning micrographs (Hoehme et. al., 2010; Drasdo et. al., 2014) (Fig. 1). A set of liver lobules (in mouse) had been analyzed by architectural parameters to quantitatively characterize and objectify the liver lobule architecture (Hoehme et. al., 2010; Drasdo et. al., 2014). Then, a statistically representative lobule had been generated from this data to study the impact of a number of potential biological mechanisms on the liver regeneration process (Fig. 1). In a further step a computational spatio-temporal model had been establish to simulate the regeneration process within a virtual experiment on the computer. The model predicted an order
principle by which hepatocytes close a pericentral necrotic lesion by orienting their daughter cells after cell division along the closest micro- vessels (sinusoids), a mechanism named hepatocyte-sinusoid-alignment (HSA). This mechanism could be validated by image analyses of regenerating mouse livers. The model was later extended integrating tissue regeneration and metabolism (Schliess et. al., Hepatology 2014, Drasdo et. al., J. Hepatology 2014, Ghallab et. al., J. Hepat. 2016).
Figure 1: As initial spatial architecture of our model statistically representative liver lobules obtained from reconstructed confocal laser scanning micrographs in Hoehme et. al. (2010) were used which had been constructed from the following pipeline: (a) a stack of confocal laser scanning micrographs were transformed by image processing into a full 3D volume data set (b). Lobule architecture parameters are defined to quantify the image information (c). Either from this information by sampling from the parameters a statistically representative lobule (e) is formed, or simulations are directly performed in the 3D volume data set (d). In this paper (e) was used as liver lobule architecture prior to tumor cell initiation. (f) shows a magnification of the confocal laser scanning micrograph indicating that hepatocytes resemble moderately deformed spheres. This justifies the choice of a center-based agent-based model for simulation.
In the study of this paper the spatio-temporal model (Hoehme et al., 2010) was further developed to simulate early tumor development. Within that model each hepatocyte and the lobular capillaries, called sinusoids, had been represented as model units. Using an agent-based approach, each model cell was parameterized by biophysical and bio-kinetic properties, and able to move, grow, divide, and interact with other cells and sinusoids by forces within a so-called ‘’center-based model”, in which forces between cells were mimicked as forces between cell centers. The movement of each cell was calculated from all forces exerted on that cell including its own micro-motility using an equation of motion. Agent-based models in which an individual agent represents each cell have been extensively used to mimic the emergence of spatial tumor phenotypes in tumor development and evolution as they are perfectly suited to represent differences of cells at cellular resolution (e.g. Andersson et. al., 2006, Tang et. al., 2011, Macklin et. al., 2012) as these permit to include intercellular heterogeneity in cell properties and space.
The here established model simulates a scenario, when initially one individual hepatocyte gains increased proliferation rates as a consequence of initiation by genotoxic carcinogens.
Intuitively, it may be assumed that a tumor originating from a single initiated hepatocyte will grow with an approximately spherical shape. Surprisingly, the here established model predicted that this is not the case but initially tumor growth in liver tissue should occur in longish, extremely elongated, but clearly not in spherical cell arrangements. Only when the tumor reaches a cell number of approximately 4,000 cells, elongated cell arrangements progress to spherical structures. This model prediction stimulated us to revisit the tissue slides of previous liver tumor initiation studies in rats (Grasl-Kraupp et al., 2000). Importantly, the genotoxic carcinogen N-nitrosomorpholine (NNM) induced elongated, almost columnar arrangements, when the number of initiated cells was small, while larger foci adopted spherical shapes.
Simulation of numerous possible mechanisms demonstrated that only hepatocyte-sinusoidal-alignment (HSA) i.e., the mechanism involved in coordination of tissue organization (Drasdo et al., 2014; Hoehme et al., 2010) can explain the initial deviation from spherical shape, suggesting that tumor cells early after initiation are still controlled by this order principle which in healthy liver tissue helps to coordinate the complex sheet-like tissue organization. The present study demonstrates, how tumor cells at very early stages are still obey physiological control mechanisms of tissue architecture but escape this regulation already at sizes of approximately 4,000 cells, which still represents a very small tumor.
The findings presented here stress the potentially important role of micro-architecture in early tumor development.
Materials and Methods
Model
The model we use here extends the regeneration simulation model from ref. (Hoehme et. al., 2010) to include growing monoclonal tumors.
The assumptions (A-number) of the simulation model are:
(A-1) Hepatocyte cell shape and physical forces. Hepatocytes in 3D culture adopt an
almost perfect spherical shape, and in confocal micrographs adopt shapes reminiscent of deformed spheres. Therefore, we assumed that hepatocytes can be mimicked as homogeneous, isotropic elastic and adhesive, intrinsically spherical, objects capable of migration, growth, division and death. Based on pipette experiments by Chu et. al. (2005) hepatocyte-hepatocyte and hepatocyte-blood vessel interaction forces are mimicked by the Johnson-Kendall-Roberts (JKR) model (Drasdo and Hoehme, 2005). The JKR model describes the force between homogeneous, isotropic, elastic sticky spheres, and could be shown to apply to cells if compression and pulling of one cell with respect to the other cell is sufficiently fast. It shows a hysteresis behavior depending on
whether two objects approach each other or are pulled apart i.e., cells adhere beyond the distance at which they came into contact when they were approached. The hysteresis leads to a delay in cell-cell and cell-substrate detachment compared to models without hysteresis (Drasdo et. al. J. Stat. Phys. 2007).
Healthy hepatocytes are polar, their cell adhesion molecules are not isotropically distributed. We represent hepatocyte polarity by assuming that the contacts are constrained to a certain region of the hepatocyte. As a consequence the force depends on the overlap of the cell surface region where adhesive molecules are located. In case the contact regions of two cells in contact do not contain adhesive molecules, the adhesion force is zero.
The JKR-force | ( ij)| JKR ij JKR ij F d F where d
ij is the distance between the centers of two
interacting spheres i and j that is calculated from two implicit equations: Right: Sketch of two
interacting cells
where aij is the contact radius. The effective radius is defined by ,
where Ri is the radius of cell i. dij = Ri+Rj-δ is the distance between the centers of model
cell i and cell j, where δij=δi + δj is the sum of the deformations of each cell (upon
compression it is the overlap of the two spheres) along the axis linking the centers of these cells. Eij
~
is the composite Young modulus defined by Eij-1=
(1-ni2)Ei-1+(1-nj2)Ej-1. ni is the Poisson ratio of cell i. We approximate ̂ where is the density of
surface adhesion molecules acting in the contact area and Ws is the energy of a single
bond. The second equation cannot be solved explicitly for FijJKR
(dij) if gˆ>0. It can be
solved first to obtain aij(FijJKR). The value of is then inserted into the first equation to
give δij(aij) , dij = Ri+Rj-δ, dij(aij). FijJKR(dij) can be obtained by plotting FijJKR(dij) vs. dij.
The effect of polarity has been modelled by replacing the membrane density of adhesion molecules
r
m®
r
mA
ijadh(
y
ij) / A
ij,, in which case only adhesion is downscaled. Here, Aijadh(yij)is the area of the overlapping regions that are able to form the adhesive contact within the contact area Aij»paij ³Aijadh
(yij) . This approximation results in a reduced adhesion force if the overlap area of the membrane regions of neighboring cells carrying the adhesion molecules is smaller than the physical contact area.
In general the density of adhesion molecules on the surface of the two interacting cells differs (Ramis-Conde, 2012; Ramis-Conde 2008), so that has to be calculated from the density of cell adhesion molecules on the surface of each individual cell (or, more general, of a cell i and its interaction object X).
If all surface adhesion molecules in the contact region of a cell and its interacting object (e.g. another cell or sinusoid) are saturated, then the density of formed bonds behaves approximately as ( ). Here is the density of surface adhesion molecules
reversible bond formation and bond release dynamics with mobile surface receptors in the contact zone between cell i and object X, then
( )(
) , with
, being the bond formation and bond release rate, respectively. Within this paper, we pursue the first model and assume that the density of adhesion molecules in the cell surface is the same for each cell.
(A-2) Equation of motion for cells. Migration of each hepatocyte has been calculated
using an equation of motion. It permits to calculate the position of an object (here a hepatocyte) with time. It is obtained by denoting all forces acting on the object, for a hepatocyte indexed with index i this is: , where the underline denotes vectors in 3D-space, the symbol F forces, and denotes the mass of cell i, the total force acting on cell i. The total force is composed of the sum of all friction forces cell i experiences with sinusoids, extracellular matrix in the space of Disse, and other hepatocytes, the sum of all JKR forces (compare assumption (A1)), and the active migration force of cell i, . ai=dvi/ dt=lim
Dt®0(Dvi/Dt) denotes the
acceleration of cell i, where is the difference of the cell velocities at times and t. Knowing the velocity and the current position permits to calculate the new position of the object from dr/dt=v.
Inserting the force-terms, the equation of motion for the cell i reads:
(Eqn. 1)
Cell i can either be a hepatocyte or a cancer cell. Parameters for both may be different.
) (t
vi is the velocity of hepatocyte i. In the first sum, j denotes all neighbor cells of cell i,
in the second sum, j denotes all sinusoidal elements interacting with cell i. Within tissues the friction between cells and the extracellular matrix components, and between cells and the sinusoids is large such that the inertia term, the first term in equation (1), can be neglected and be set to zero. ziX
k
denotes the friction tensor (here a 3x3 matrix) describing the friction of cells (hepatocytes or tumor cells or both) i and j (for X=j, CC), or cells i and sinusoids (for X=j, k=CS), or cells and ECM (for X=ECM, k=CECM). The friction tensor may be decomposed into a perpendicular and a parallel component:
V
iXk=
g
^k,iX
(u
iXÄ
u
iX)
+
g
||k,iX
(I
-
u
iXÄ
u
iX)
. Here, uiX=(rX-ri)/|rX-ri| with ri denoting theposition of cell i. ``´´ denotes the dyadic product. FiX denotes the JKR-force between
cells i and j (for X=j) as well as between cell i and substrate (for X=s enumerating sinusoidal elements). I is the unity matrix (here a 3x3 matrix with “1” on the diagonal
miai=Fi=Fi; fr+Fi;JKR+Fi;act Fi Fi; fr Fi;JKR Fi;act Dvi=vi(t+Dt)-vi(t) t+ Dt
and “0” on the off-diagonals). gk,iX
^ , gk,iX|| are the perpendicular and parallel friction
coefficients, respectively. This becomes more apparent when multiplying the friction tensor by the difference in velocity between cell i and object X, ,
V
iX kD vi=g
^k,iX(uiX ÄuiX)Dvij+g
|| k,iX (I-uiXÄuiX)DviX =g
^k,iXuiX(uiXDviX)+g
|| k,iX (IDviX-uiX(uiXDviX)) .The first term on the rhs. specifies the friction perpendicular to the direction of movement difference, the second term on the rhs. the tangential friction.
H active i
F , denotes the active movement force by migration and is denoted in assumption
A-3.
The model assumes V
iECM=g
CECMI i.e., isotropic friction with the extracellular matrix in the
space of Disse.
Generally, the perpendicular and parallel friction coefficients, , will be different for each type of interaction (k=CC, CS, ECM), and depend on the mechanisms of friction. For example, for adhesion controlled cell-cell friction, for example, one might expect
with k=CC. I.e., friction will basically depend on the shared contact area
decorated with adhesive bonds, the density of adhesive bonds formed, and a coefficient that characterizes the strength of friction between two cells, .
If not stated differently, we lumped the density of surface adhesion molecules and friction coefficient together by setting with
and
with
. Moreover, for our reference data set and if not otherwise stated,
we chose with k=CC, CS, CECM.
A-3) Cell migration. Cells migrate actively. The movement has a random component
and a component directed towards the necrotic zone (Fig. 3a).
For healthy liver, we could show in a previous paper (Hoehme et. al., 2010) that in order to obtain an agreement between simulation results and experimental observations, hepatocyte movement must be active and directed by migration into the necrotic lesion. This was mimicked by two alternative mechanisms which both produced an equivalent outcome (a) Fi active,H =cÑ c+ 2Dg2h i(t) , (b) Fi active,H = (1-Q[шpihi]) 2Dg2hi(t) ,
respectively. Mechanism (a) mimics chemotaxis (1st term) in combination with random
isotropic movement (2nd term), (b) favors movement into the direction of small
hepatocyte density.
hi(t) denotes a Gaussian-distributed random variable with average (t) 0
i
and autocorrelation mi(t')nj(t) ij(t't)(m, n = x, y, z denote the coordinate direction; i, j
are the hepatocyte indices). Here, X denotes the expectation value obtained by averaging the random variable X over many of its realizations. As each component of η is Gaussian distributed, each realization is sampled from a Gaussian distribution. D is the cell diffusion constant and assumed to be a scalar, is the chemotaxis coefficient, c(r,t) the morphogene concentration secreted by the cells dying from drug damage.
̂is a quantity by which the cell can sense the position of their neighbors. It is defined similar to a homeostatic pressure:
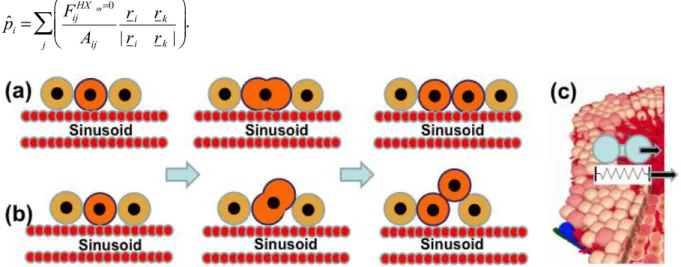
ˆpi= Fij HXVm=0 Aij ri-rk | ri-rk| æ è çç öø÷÷ j
å
.Figure 2: In our study we compared the spatial phenotype of early tumors if dividing tumor cells either (a) respect the order mechanism we could demonstrate for hepatocyte in regeneration of drug-induced peri-central liver lobule damage, namely, that cells during division align along the closest sinusoid, a mechanism we had named ‘HSA’ (Hoehme et. al., 2010), or (b) oriented their division orientation randomly. (c) Consistent with this reference our model contained the mechanism that in case of central necrosis cells migrate actively into the necrotic region. However, we did not consider necrosis in the present study.
In the last equation, j is running over all neighboring hepatocytes j of i, as well as over all sinusoidal elements. The index HXzm=0means that only repulsive contributions to the
interaction force are considered (formally by setting in the equation for the central force).
(A-4) Cell orientation changes. Cell orientation changes can be modeled by an
optimization process based on the energy change occurring if the cell orientation changes (Drasdo et. al. 2007), or an equation for the angular momentum (Drasdo 2005). The energy can be calculated from the forces by integration as explained below. The energy-based method is much easier to evaluate and leads to equivalent results, which is why we used it here. Fundamentally, orientation changes were assumed to be driven by energy minimization for which we used the Metropolis algorithm (Drasdo and Hoehme, 2005). In the Metropolis algorithm a trial step (here: a small rotation) is performed, and subsequently it is evaluated whether this step is accepted, or rejected (in which case the step is taken back). The change of total energy of the whole cell configuration is used to evaluate the step. As the orientation change of a hepatocyte only affects the next and maybe next-next neighbors, only those neighbors need to be considered. To calculate the orientation change, within each time interval Δt for each hepatocyte a rotation trial around three space-fixed axes by angles δβi with i=1, 2, 3, δωi є [0, δωmax), with δωmax <<
π/2 was performed, using the algorithm of Barker and Watts (explained in Drasdo et. al., 2007). The energy can be calculated by integration of the equation Fij= -¶Vij
¶ri where
only the JKR-force contributions were considered. The energy difference is then calculated from DVij(t)=Vij(t+Dt)-Vij(t), and the probability that a step is accepted is
calculated using where FT ≈10-16J is a reference energy (comparable to
the kbT in fluids or gases were kb is the Boltzmann factor, T the temperature).
(A-5) Cell division. During G1, S, and G2-phase (interphase) we assume that a cell
increases its volume by increasing the radius R in small steps ∆R << R until it has doubled its initial ``intrinsic´´ volume to , where was its volume immediately after cell division. Here, the intrinsic volume Vi of a model cell i is
approximated by Vi(Ri)=4πRi3/3. If Vi=VDIV (hence RDIV≈1.26 R) the model cell i deforms
into a dumbbell at constant volume in mitosis (see sketch). Subsequently, it divides into two daughter cells of radius R. The duration T of the cell cycle was stochastic, sampled from a Gaussian distribution with expectation value and variance additionally cropping outside the interval [ ] .
(A-6) Cell orientation during division. The cell division was assumed to occur along
the orientation of the closest sinusoid (micro-vessel), a mechanism we named HSA in a previous communication (Fig. 3b; Hoehme et. al., 2010). In that communication, absence of HSA (Fig. 3c) resulted in a failure in restoring liver lobule microarchitecture. Successful implementations of HSA in that communication were a restoring mechanism favoring orientation of a growing and dividing cell parallel to the closest sinusoid, and cell division in a random direction in combination with attraction of hepatocyte cells by a sufficiently short-range morphogen secreted by the sinusoids. However, HSA is a robust phenomenon. Even in the limit of immediate mitosis after volume doubling, oriented parallel to the closest sinusoid, we obtained the same results on the tissue scale.
(A-7) Cell cycle progression.
Normal hepatocytes: As different from other epithelial tissues as for example intestinal crypts the cell turnover is very slow, we do not consider any division of normal hepatocytes.
Cancer cells: We assume that a tumor emerges from one cancer precursor cell, which proliferates in contrast to the untransformed hepatocytes. The transformed cell differs from the untransformed hepatocytes in properties that will be defined for each simulation in the results section. When the transformed cell proliferates, it generates daughter cells that adopt the same phenotype as the precursor cell, and enter the cell cycle again after division.
As a variant we study the effect of pressure-inhibited cell cycle progression by assuming that a tumor cell i does not enter the cell cycle if the pressure exerted on it overcomes a threshold value . We here define pressure by the simple measure ∑
. An
extension to tensors able to measure shear contributions is straightforward but not needed here (Liedekerke et. al., 2015).
(A-8) Sinusoids (blood micro vessels). The model only considered sinusoids and
hepatocytes, the main constituents in a liver lobule. Other cell types were neglected. Sinusoids were represented as a graph. Along the graph, spheres were stringed with a radius being equal to the radius of the sinusoid. The sinusoidal network of a whole liver lobule within the model consisted of approximately 50.000 spherical objects (agents). Each of the sinusoidal spherical elements was assumed to interact with the hepatocytes by a JKR-force ( Fij=F(dij,yij) ). The forces among sinusoidal elements was
approximated by linear elastic springs, ( )
with k, l being spheres
on the chain connected by a spring, is the sinusoid element intersection area with being the radius of the sinusoid element connecting points k and l (in this study we used a constant sinusoid radius, see table 1). l0 is the spring rest length, the actual
length. The spring and geometrical parameters can be related to the (elastic) Young modulus by setting . The Young modulus is one model parameter. is the unit vector pointing from the center of sinusoidal object k to sinusoidal object l.
Movement of the sinusoids is modelled by an equation of motion for each of the sinusoidal spheroid elements using the same type of equation as in for the hepatocytes except for sinusoid we miss out an active motion (migration) force.
(A-9) Reference parameters: all parameters in the model defined above have either a
direct biophysical or bio-kinetic nterpretation, and in principle can be determined experimentally. Thus, the physiologically meaningful parameter range for each of the parameters could be estimated. As reference parameters (appendix, table 2) for both normal hepatocytes as tumor cells we used the parameter set, for which we had found the best agreement between model simulations and experimental data in regeneration after drug-induced peri-central liver lobule damage in the mouse model (Hoehme et. al., 2010). This set of parameters was found by extensive simulated parameter sensitivity analysis varying each model parameter within its physiologically meaningful range, followed by direct comparison of the model simulation outcome and experimental findings. By this sensitivity analysis that can be embedded in a general model identification strategy (Drasdo et. al., 2014) we were able to rule out model mechanisms that were insufficient in explaining the biological data and identify that model and its parameter ranges for which the experimental findings could be quantitatively explained. This final model required HSA.
(A-10) Parameter variations for cancer cells compared to hepatocytes. In a first
step we studied the effect of an absence of HSA, in subsequent steps we also studied parameter deviations of the cancer cell parameters from those of normal hepatocytes. The case of parameter changes is automatically captured in the equation of motion (Eqn. 1) as the indices i, j take into account that the cells may be of different kind. The parameter variations we considered are introduced in the results section.
Characterization of simulation results
In order to quantify the tumor shape in our simulations we perform an empirical Karhunen-Loève expansion (KLT) at different tumor cell population sizes, conceptually closely related to a principle component analysis. KLT minimizes the total mean square error and thus optimally spans three orthogonal eigenvectors and their associated eigenvalues, the latter giving information about tumor elongation: if all eigenvalues are similar, it indicates that there is no preferential direction of extension. On the contrary, if one eigenvalue results in significantly higher values than the
others, tumor shape is elongated along the corresponding eigenvector. Therefore, the ratio between the two highest eigenvalues provides a direct measure of tumor
elongation. This measure turned out to be very robust in that different realizations of the stochastic growth process using the same parameters do not lead to any notable differences. In our figures below we will display the ratio of the longest (extension along first eigenvector) to shortest (extension along second eigenvector) axis.
Liver tumor initiation and tissue analysis
Histological slides of a previously published study (Grasl-Kraupp et al., 2000) were re-analyzed. In this study male Wistar rats received single doses of 250 mg of N-nitrosomorpholine (NNM)/10 ml solution/kg body weight by gavage. Livers of four animals were analyzed at days 0.5, 1.5, 2.5, 17.5, 20.5, 24.5, 27.5, 31.5 and 107.5 after NNM administration. Sections 2 µm thick were immunostained by anti-GST-P. The original study (Grasl-Kraupp et al., 2000) was designed to study the number of GST-P positive cells in relation to cell replication and cell death events. In the present study the slides were re-analyzed to evaluate whether GST-P positive (initiated) hepatocytes are arranged in spherical or in elongated foci. For this purpose slides were identified, where the slice level was oriented approximately in parallel to the hepatocyte sheets (allowing the identification of hepatocyte columns and sinusoids over at least 10 subsequent hepatocytes) and the shape of foci was photographically documented under a light microscope.
Results
We performed simulations in a single liver lobule starting with one single tumor cell embedded in around 4,000 hepatocytes.
We ran simulations until the tumor consisted of up to several thousands of cells. The growth process was stochastic, since it contained several stochastic sources. Those were the micro-motility, the rotation angle, and the cell cycle duration. As a consequence each simulation (realization of the stochastic process) generated slightly different results. To exclude being misled in our conclusions by the stochastic variability within our simulations we compared different realizations of that stochastic process by studying sufficiently high numbers of simulations and for a number of simulations displayed average and 95% confidence interval calculated based on the sample variance.
HSA mechanism predicts elongated tumor nodule shape
To study the influence of HSA, simulations were performed with and without including this mechanism into the model (Fig. 3). All further model parameters were chosen as in the simulations of liver regeneration after drug-induced damage (Hoehme et. al., 2010). We observed that simulations with HSA generate an elongated phenotype at a very early stage of their development (Fig. 3b). With increasing tumor size, elongation is lost, despite HSA is still present. At about 4000 cells corresponding to a tumor diameter of about 370μm the tumor has adopted an almost spherical shape.
In a next step HSA was eliminated from the model and the cells were allowed to divide with random orientation (Fig. 3a). In this case even at very early stages no elongation could be detected. The result was objectified by the KLT, were the ratio R of longest vs.
shortest axis length of the tumor is clearly larger with than without HSA (Fig. 4). However, KLT reveals, that even without HSA the ratio is larger than one. Two simple explanations for the differences between the longest and shortest axis may either be stochasticity of the growth process, or the presence of blood vessels, which may favor tumor expansion in one direction within the lobule. In particular, blood vessels may constrain tumor expansion perpendicular to the portal triad – central vein axis, as this statistically is the average vessel orientation.
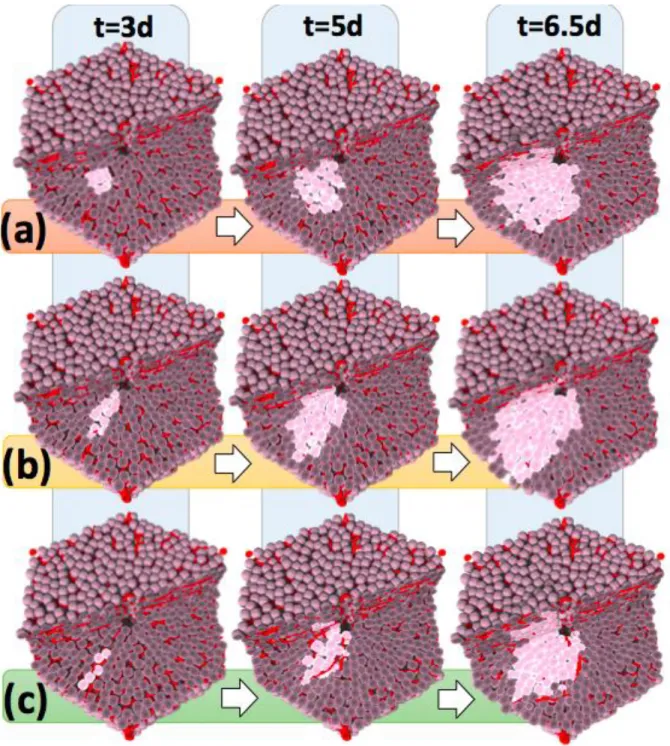
Figure 3: Scenarios of tumor growth in a single liver lobule in (a) absence of HSA, (b) presence of HSA, and (c) presence of HSA with elevated tangential friction impeding hepatocyte movement perpendicular to the formed columns along the sinusoids. The images represent snapshots 3, 5 and 6.5 days after initiation, defined as the time point when a transformed hepatocyte adopts an increased proliferation rate. Notice that HSA (b, c) clearly causes early asymmetry of tumor cell assemblies (leftmost image column at 3 days) while with increasing tumor size this asymmetry is increasingly lost (right panel at 6.5d). A one cell thick column could be found if movement perpendicular to the sinusoids was impeded by elevated shear forces e.g. from tight junctions (compare (c) to Fig. 1(a)).
In order to test these possibilities, we simulated tumor growth in free space. We found that as soon as tumor cells were allowed to proliferate without HSA they behaved
similar to a tumor growing in free suspension. We concluded that possible differences in the axis lengths of the tumor caused by the orientation of the blood vessels were
negligible compared to differences caused by the stochasticity of the growth process (Fig. 4).
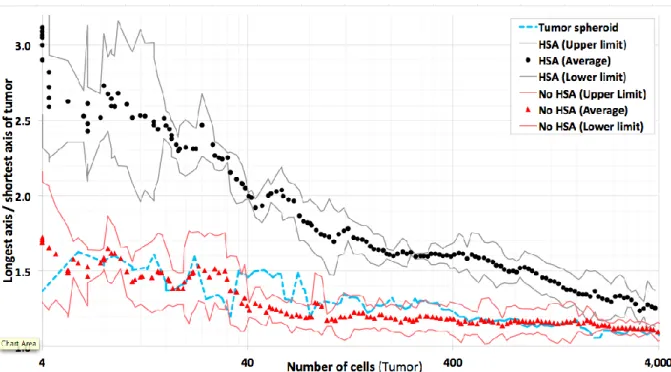
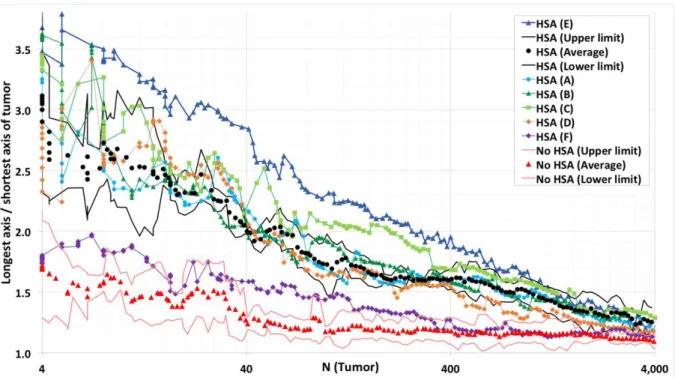
Figure 4: Comparison of the ratio of the longest vs. shortest tumor axis for simulations with HSA (black) and no HSA (red). Points represent averages over several simulations with the same parameters, lines the 95% confidence intervals calculated based on the sample variance. For reference, a tumor grown in free liquid environment is displayed (blue). Tumors in which cells obey HSA show significant elongation compared to tumors in which tumor cells grew and divided into random directions (compare Fig. 3 (b), (c)). Note also, that the degree of elongation for tumors growing in a liver lobule in absence of HSA was not larger than for tumors grown in liquid environment despite the statistically approximately radial orientation of the sinusoids. The simulations demonstrate that the difference in tumor shape caused by HSA decreased with the size of the tumor and is no longer detectable for tumors with a size of approximately a liver lobule or larger. 4000 cells correspond to a tumor diameter of about 370μm.
Can any alternative mechanism explain early tumor elongation?
In a next step we studied if alternative mechanisms to HSA could be responsible for the elongated arrangement of early transformed tumor cells that we observed in presence of HSA. We focused on parameter variations (denoted as NH-number), which we might have expected to potentially impact on the spatial tumor phenotype. The parameters we modified are enumerated below:
(NHsa-i) A decreased as an increased cell-cell adhesion could modify the tumor spatial phenotype. For example, increased cell-cell adhesion of polar hepatocytes could favor formation of lengthy structures. To test this hypothesis, we considered a decreased cell-cell adhesion to 20% and zero (0%), as well as an increased adhesion among tumors cells by a factor of 5.
(NHsa-ii) We have shown that for the reference parameter set the vessels had no impact on the early tumor shape (Fig. 4). However, at higher vessel stiffness this may change.
For this reason, we performed simulations with increased stiffness of sinusoids by increase of the sinusoid spring constant by 200%, and by complete inhibition of sinusoid movement to mimic the limit of infinitely stiff vessels.
(NHsa-iii) Decreasing cell micro-mobility might promote cells to stay longer in regions of high mechanical stress, which may form as a consequence of cell multiplication. As this could impact on tumor shape we considered a decreased tumor cell mobility, close to zero, by increasing the cell matrix friction to a value much larger than the reference value, (
) . Moreover, we considered the opposite case of increased
micro-motility by decreasing the friction by a factor of three, ( ) . (NHsa-iv) An increased cell-vessel adhesion might favor hepatocytes to stay close to the sinusoid. So we also studied an increased cell-vessel adhesion up to 300%.
(NHsa-v) An elevated friction of cell movement perpendicular to the orientation of the local sinusoid may favor column formation. We implemented this mechanism by choosing (
) . If
a
ijis the minimal angle between the axis connecting thecenters of cell i and j, and the direction of movement of cell i the additional friction generates a contribution to the friction force ( ). Hence a maximal increase
of friction is obtained for
a
ij=p
/ 2 while fora
ij =0 the additional friction is zero.Surprisingly, none of the above mechanisms generated an elongation of early tumor shape (Fig. 5; not all mechanisms are displayed).
Figure 5: Neither variation of cell-cell adhesion, other mechanism than HSA was able to generate a significant elongation. In absence of HSA, (A) denotes the reference parameters set but a decreased cell-cell adhesion in cancer cells (to 20%), (B) an increased adhesion among tumors cells (by a factor of 5), (C) increased stiffness of sinusoids by increase of the sinusoid spring constant by 200%, (D) complete inhibition of sinusoid movement to mimic the limit of infinitely stiff vessels, (E) an elevated friction of cell movement perpendicular to the orientation of the local sinusoid. 4000 cells correspond to a tumor diameter of about 370μm. (Black points represent averages over several simulations with the same parameters, black lines the 95% confidence intervals calculated based on the sample variance.)
(NHsa-vi) Finally we considered a variation of (NHsa-ii) with sinusoidal spring constant of 200%, in which in addition the cell cycle progression is inhibited if the pressure overcomes a certain threshold (A-7) (Fig. 6). We found that for small thresholds values of P=1kPa the pressure inside the tissue quickly reached the threshold hence either tumor growth was inhibited completely or tumors grew only very slowly (Fig. 6). No elongation was observed. For thresholds cells proliferated unlimited as for our reference parameter settings and cases NHsa-i to NHsa-v. However, in a small window of elongated tumor shapes emerge (we found a maximum elongation for P=1.5kPa). In this window the tumor cell proliferation was pressure-inhibited perpendicular to the sinusoids as growing against the mechanical resistance of the sinusoids elevated the pressure on the proliferating tumor cells. However, the pressure threshold was still big enough to permit proliferation between neighboring sinusoids which approximately extended radially in direction of the central vein – portal vein axis. As a consequence, the tumor expands preferentially into the central vein – portal vein axis as well. However, the elongation for was significantly smaller as in presence of HSA.
As in presence of HSA, beyond tumor population sizes of about 4000 cells, the curves for different mechanisms and parameters converge to a spherical tumor.
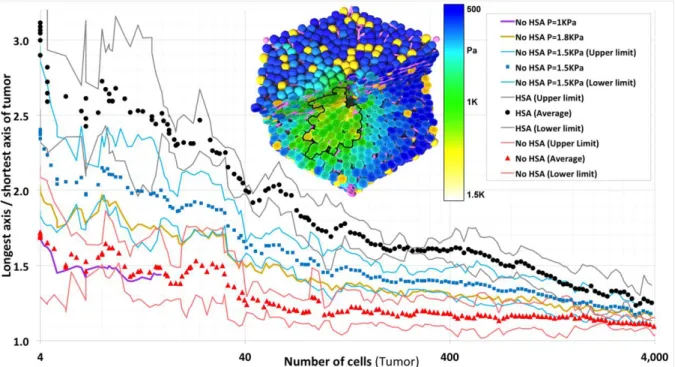
Figure 6: Tumor shape in case of press-inhibited tumor cell cycle progression above a threshold pressure P (assumption A7). For too small threshold values, the tumor did not grow or grew only very slowly (P=1kPa, violet curve). For P=1kPa the time needed for the tumor to reach a population size of about 20 cells was the same than for P>1.8kPa to reach a population size of 4000 cells. No elongation was observed. For large thresholds ( , yellow curve) cells proliferated unlimited. In a small window of elongated tumor shapes emerged (light blue, P=1.5kPa ) but the elongation was significantly smaller than for HSA. The inset shows for this condition the pressure, which within the tumor exceeds 1.5kPa (green). 4000 cells correspond to a tumor diameter of about 370μm. (Black, blue and red points represent averages over several simulations with the same parameters, the black, blue and red lines the 95% confidence interval calculated based on the sample variance.)
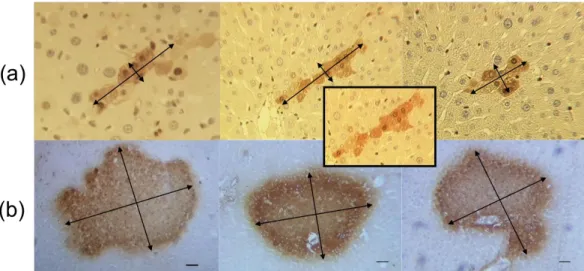
In a next step we looked for experimental material that could validate our findings. For this purpose, immunostained liver slices of a tumor initiation study in rats (Grasl-Kraupp et al., 2000) were re-analyzed. In those experiments, rats received a single dose of the genotoxic carcinogen N-nitrosomorpholine (NNM). Placental glutathione S-transferase (GST-P) was used as a marker of initiated hepatocytes. Representative images of GST-P positive foci with low (Fig. 7a) and high (Fig. 7b) numbers of initiated cells were taken. Initially, the initiated cells tend to indeed form elongated arrangements and align along sinusoids, similarly as normal hepatocytes that also are arranged in sheets (Fig. 7A). At much larger population sizes comparable to those of a liver lobule, nodules of GST-P positive cells adopt a compact, almost spherical shape (Fig. 7a). This occurs at a diameter of 280-420μm with is in excellent agreement with the model prediction, for which a spherical shape has been adopted at about 4000 cells, corresponding to a tumor diameter of about 370μm. Previously, strong evidence has been presented that these foci are of monoclonal origin (Grasl-Kraupp, 2000). Therefore, it seems plausible that the spherical nodules shown in Fig. 7b have evolved from the smaller, elongated GST-P positive cell arrangements as presented in Fig. 7a. Principally, it cannot be excluded that some nodules emerged from fusion of different monoclonal foci in which case they would not be monoclonal, but as the initial spatial density of elongated GST-positive cell clusters is relatively low, such cases should be rare.
We conclude that the experiments validate our model predictions of early columnar tumor nodules that at large tumor sizes adopt a spherical shape. However, in the experimental data, even one-cell-thick columns were observed (Fig. 7b) that we could not observe in any of the realizations with the reference parameter set and HSA.
Figure 7: Validation of the model prediction. Typical arrangements of GST-P positive, initiated cells in rat livers are shown after exposure to a single dose of the genotoxic carcinogen N-nitrosomorpholine (NNM) at very early (A) and later stages (B). Initiated cells express high levelsof GST-P and appear in dark brown. Small cell populations of GST-P positive cells form elongated arrangements, turning to spherical tumor shape when the size of the GST-P positive foci increases. The inset in (a) shows a column of almost 10 GST-P positive cells mostly arranged in a row with the exception at least 3 cells which escaped from the pure columnar structure (slides from Grasl-Kraupp, 2000). The scale bars denote twice the nucleus-nucleus distance corresponding to . The diameter of the tumors in panel b is about This is 50% - 75% of the average diameter of a liver lobule.
Can any mechanism amplify the elongation by HSA?
Within numerous simulations using HSA alone, we never observed the formation of first five cells in one row as in the experiments (Fig.7a). For this reason we studied whether a
further mechanism or a parameter change for tumor cells could lead to an amplification of the column-forming capacity of HSA.
We considered as additional mechanisms or parameter variations some of those we had already studied with regard to their column-forming-capacity in absence of HSA (cf. Fig. 5):
(HSA-i) a decreased cell-cell adhesion in cancer cells of 20% and no adhesion at all (0%), (HSA-ii) an increased adhesion among tumors cells by a factor of 5,
(HSA-iii) an increased stiffness of sinusoids by increase of the sinusoid spring constant to 200%,
(HSA-iv) complete inhibition of sinusoid movement to mimic the limit of infinitely stiff vessels.
(HSA-v) increased tangential cell-cell friction leading to increased inhibition of
movement perpendicular to the orientation of the closed sinusoids for cells that align along the sinusoids. As for our previous study of tumor shapes in absence of HSA, we implemented this mechanism by choosing (
) .
Most parameter variations (stiff vessels, elevated sinusoid extensibility, elevated cell-vessel adhesion) did not promote tumor elongation (Fig. 7).
However, impeding movement of hepatocyte transversal to the orientation of the sinusoid amplified tumor elongation (Fig 8, dark blue curve; Fig. 3c). This can be understood as follows: The tumor cells located at the two tips (ends) of the growing column at the interface to normal hepatocytes have to push those hepatocytes away to gain space for further growth and division. As a consequence, the tumor cell column experiences an increasing mechanical pressure. If the column would not be constrained in its movement transversal to the force on its tips, it would undergo buckling in a collective movement of cells as soon as the growth-induced pressure overcomes a certain threshold (Drasdo, 2000). As movement perpendicular the tumor cell column is constrained by sinusoids and normal (non-transformed) hepatocytes, the column can release pressure only by individual cells moving out of the column causing the column to get thicker (the same mechanism can explain piling up of cells in monolayers of cells that lost contact inhibition of growth, Galle et. al., 2005). However, if an elevated perpendicular friction coefficient (
) which may be attributed to shear
forces due to tight junctions increases the friction force an individual cell has to overcome to leave the column which in turn permits formation of longer columns. In this case, we observed even initial column formation of a length of five cells (Fig. 3c).
Figure 8: Impeding of tumor cell movement perpendicular to the cell-cell contacts can amply elongation (dark blue curve at top, (E)), all other mechanisms (see Fig. 6) have no significant impact on HSA – induced elongation. Here, HSA is present. (A) denotes a decreased cell-cell adhesion in cancer cells (down to 20%), (B) an increased adhesion among tumors cells (by a factor of 5), (C) Stiffness of sinusoids by increase of the sinusoid spring constant by 200%, (D) Complete inhibition of sinusoid movement to mimic the limit of infinitely stiff vessels. (E) Increased perpendicular friction, (F) the effect of factors secreted by the cancer cells that destruct the closest vessel elements with a delay of 1h. 4000 cells correspond to a tumor diameter of about 370μm. (Black points represent averages over several simulations with the same parameters, the black lines the 95% confidence interval calculated based on the sample variance.)
How can the elongation by HSA be tested?
If HSA is responsible for early column formation, it should disappear if HCC cells also have the ability to destroy blood vessels they are in contact to. In order to model this we tested destruction of vessels at different times after first contact with tumor cells. When the delay time between contact and destruction was chosen smaller than 30mins, random fluctuations of cell positions were sufficient to destroy vessels. If the delay time overcame 12h, the vessel destruction has been found to have only little impact on the arrangement of the tumor cells in very early stages. For about 1h delay between first contact and destruction we found that the effect of HSA was eliminated Fig. 8 (violet curve). The same result is obtained if a drug were administered that destroys blood vessels.
Blood vessel fraction in tumor nodule
Finally we studied in how far a growing tumor pushes blood vessels out the tumor towards its purpose. For this purpose we calculated the volume fraction of blood vessels inside the tumor (Fig. 9).
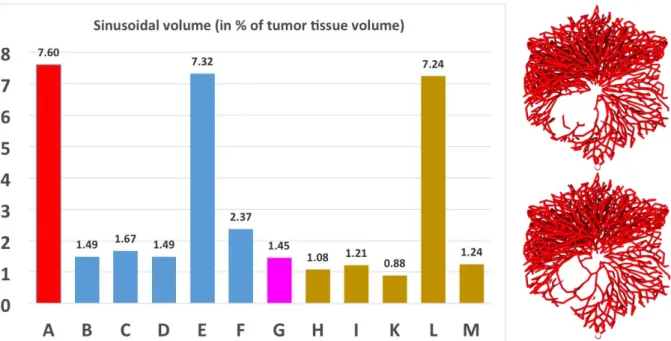
Figure 9: Blood vessel volume fraction inside the tumor. Here, (A) denotes the reference (without a tumor) of Hoehme et. al. (2010), (B-G) HSA with (B) adhesion among tumor cells 20% of that between hepatocytes, (C) adhesion among tumor cells 5-times as large as between hepatocytes, (D) stiff vessels by elevation of the sinusoid element spring constant to 200%, (E) infinitely stiff vessels mimicked by complete inhibition of sinusoid movement, (F) elevated friction of cells perpendicular to orientation of closest sinusoid, (G) vessel destruction. (H-M) denote absence of HSA, whereby in (H), adhesion among tumor cells is 20% of that between hepatocytes, (I) adhesion among tumor cells 5-times as large as between hepatocytes, (K) stiff vessels by elevation of the sinusoid element spring constant to 200%, (L) infinitely stiff vessels mimicked by complete inhibition of sinusoid movement, (M) elevated friction of cells perpendicular to orientation of closest sinusoid. Pairs of columns that differ only by presence vs. absence of HSA are (B) vs. (H), (C) vs. (I), (D) vs. (K), (E) vs. (L) and (F) vs. (M). In each case the tumor vasculature in presence of HSA is slightly above that in absence of HSA. This result was equally found for the reference data set of Fig. 4, where in presence of HSA some vessels remained inside the tumor (right panel, lower picture) while in absence of HSA all vessels were pushed out of the tumor (right panel, upper picture).
We find that in presence of HSA the volume fraction of vessel elements is slightly higher than in absence of HSA (B vs. H, C vs. I, D vs. K, E vs. L, F vs. M). If sinusoid movement is completely inhibited (E, L), the vessel volume fraction is as in the reference without the tumor (A). Vessel destruction reduces the vessel volume fraction slightly as only closest sinusoidal elements are digested with a time delay. Elevated friction perpendicular to the sinusoid orientation increases the vessel fraction (G). However, at the studied tumor population size, for all values but complete inhibition of vessel movement a significant decrease of vessel volume fraction is observed, typically, by local deformation of the vessel network.
Discussion
In this study we have shown that Hepatocyte-Sinusoidal-Alignment (HSA), a mechanism previously shown to guarantee restoration of liver microarchitecture during liver regeneration can explain the early hepatocellular carcinoma morpho-phenotype. The model prediction was conformed in a rat tumor initiation study using the genotoxic carcinogen N-nitrosomorpholine (NNM) and placental gluthanione S-transferase as a marker for initiated cells. Further simulations demonstrated that none of the further potential mechanisms can be responsible for the experimentally observed elongated arrangement of initiated cells in early HCC. The result shows that cells early after
initiation are still coordinated by HSA, a mechanism by which hepatocytes align in the orientation of the closest sinusoid.
Our findings base on computer simulations with an agent-based model of a full spatial liver lobule, representing the detailed liver lobule architecture (Hoehme et. al., PNAS, 2010). This model had previously been experimentally validated for liver regeneration after drug-induced peri-central liver damage, where each individual liver lobule develops a central necrosis as a consequence of exposure to hepatotoxic compounds. Hence we could use the parameters of the regeneration model as starting parameters for our liver cancer development simulations.
Testing possible alternative mechanisms to HSA and parameter settings different from the reference parameter set (the latter causing different accentuations of the mechanisms at play) we observed that neither the strength of cell adhesion, of cell-vessel adhesion, an increased stiffness of cell-vessels against extension, an elevated or reduced micro-motility or elevated shear forces between hepatocytes at their lateral sides could generate similar elongation effects. However, the latter mechanism was able to slightly enhance the effect of HSA, leading to an even higher degree of elongation of initiated cell foci. Inhibition of cell-cycle-progression by mechanical compression was able to explain a moderate elongation of early hepatocellular carcinoma in a small window of mechanical pressures but the elongation found was not large enough to explain the experimentally observed spatial tumor micro-patterns.
The model was further able to explain the gradual loss of elongation of transformed cell foci with increasing tumor size. The loss of tumor elongation with increasing tumor cell population size may have several reasons. Firstly, as a column grows it has to push normal hepatocytes aside in order to generate free space for its
extension. This exerts forces on both, normal hepatocytes and tumor cell columns thereby elevating the compressive stress in the tumor, which increases with increasing size of the column. At a certain degree of compressive stress the forces stabilizing the column formed by HSA are insufficient to guarantee maintenance of the columnar shape. These are in particular polar cell-cell adhesion along the closest sinusoid, shear forces that hinder cell movement perpendicular to the orientation of the closest sinusoid (probably due to tight junctions), and repulsive forces if cells are pushed against sinusoids in their
surrounding. Moreover, the sinusoidal network has many branching points, which perturb the growth of a column, firstly by representing mechanical obstacles, secondly by changing the local sinusoid orientation. They thereby constitute perturbation points that may trigger tumor cells to leave the columnar order. Finally, the sinusoidal network changes largely when the lobule borders are reached as the sinusoids are connected to the portal triads. Hence latest when the tumor reaches the lobule border, the columnar order cannot be maintained as indicated for the right picture of a simulated tumor crossing the lobule border, which has been generated in presence of HSA. This explanation is in-line with the experimental findings of tumors adopting a spherical shape at a diameter of about 50-75% of the liver lobule diameter.
The model simulations were performed in a statistically representative liver lobule obtained by statistical sampling from parameters that were used to quantitatively characterize liver lobule micro-architecture in 3D volume data sets reconstructed from confocal laser scanning micrographs. Normal hepatocytes and tumor cells were
Tumor at > 4000 cells transversing a lobule border in a simulation of 7 liver lobules
represented by individual agents within a biophysical model parameterizing each cell by biophysical and bio-kinetic quantities that are in principle accessible to experiments. This permitted to determine physiologically meaningful parameter ranges within which we varied model parameters.
The parameters found to explain liver regeneration after drug-induced damage served as starting parameters. Within our model each cell was able to move according to an equation of motion summarizing all forces on a cell including its own micro-motility. The agent-based approach we used is also known as ‘’center-based model’’ as force between cells are mimicked as forces between cell centers. Sinusoids were modeled as chains of spherical objects linked by linear springs, which permitted to express movement of sinusoids as a collective movement of the spherical objects. This description permits to formulate an equation of motion for each individual sphere of each vessel. Describing sinusoids as chain of spheres is a natural choice that emerges from a medial axis transform of the blood vessel network where the surfaces of the blood vessels have been experimentally labeled. The medial axis transform locally inscribes the sphere with maximum radius that touches the labeled vessel surface and then connects the centers of the sphere to obtain the vessel graph. Our model represents a direct though abstracted approach to tumor cells, hepatocytes and vessels in a liver lobule. Simulations with the model can therefore be viewed as virtual experiments. The simulations have been carried out on a cluster of Linux-based workstations using the simulation software CellSys (Hoehme and Drasdo, 2010). CellSys is a modular framework implemented in C++ that utilizes SuperLU (Li, 2005) for solving systems of equations, OpenMP for parallelization and OpenGL for visualization. CellSys is a tool for efficient off-lattice simulation of growth and tissue organization processes implementing the agent-based models described in section X. It uses real-time 3D visualization for the observation and assessment of simulation results.
The model prediction of an initially elongated arrangement of initiated cell foci has been validated by re-analysis of liver slices from a tumor initiation study in rats (Grasl-Kraupp et al., 2000). Analysis of GST-P positive cells, which was used as a marker for initiation, demonstrated that relatively small clusters of 20 or less cells were always elongated or almost columnar, while larger foci of the size of lobules showed spherical shapes. A limitation of the here presented experimental validation is that the analysis of images was performed in a two-dimensional manner. In the past we have reported that three dimensional structures can easily be misinterpreted when only two-dimensional tissue slices are evaluated (Vartak et al., 2016; Drasdo et al., 2014A,B). For example, a column of initiated cells may appear as a single cell when the slice level is oriented perpendicular to the structure. To minimize misinterpretations evaluation was performed only for images, where the slice level was approximately parallel to the hepatocyte sheets and at least 4 cells could be seen. Under these conditions all analyzed small foci with cell numbers smaller than about 10 cells showed the reported elongated shape. Therefore, it can be taken as demonstrated that at least a large fraction of early initiated cells arrange in elongated or column-like structures. However, the here performed type of analysis does not exclude that also a small fraction of spherical small foci may exist. Final validation could be obtained by a three-dimensional analysis in future, where all cells of a confocal scan are considered (Hammad et al., 2014; Godoy et al., 2013). Nevertheless, the here presented two-dimensional images (Fig. 7a) give clear
evidence that elongated small foci as predicted by the simulation indeed represent a predominant feature in NMN initiated rat livers.
In this study, we have shown an example how computational tissue simulations are well suited to identify plausible candidate mechanisms but also to exclude implausible mechanisms that therefore do not have to be considered for further experimental.
Acknowledgement
DD greatfully acknowledges support by the projects CancerSys, PASSPORT, NOTOX, BMBF-Virtual Liver Network, BMBF-LiSym and ANR-IFLOW, FB support by EU-CancerSys, SH by EU-CancerSys and BMBF-VLN, WW by project EU-CancerSys and EU NOTOX, JGH by EU CancerSys, BMBF-VLN, BMBF LiSym.
Appendix: Parameter tables.
Table 1: Liver lobule parameters from image analysis.
Parameter Source Value ± Standard
deviation Lobule
Confocal scanning depth Confocal data 95 ± 57 µm
Lobule height in the model - 250 ± 0 µm
Lobule area (2D slice) Bright field microscopy 0.21 ± 0.05 mm²
Lobule radius in model
(2D slice) 2
3 3
A
R
A… lobule area, assuming a
regular hexagon
284.3 ± 56.9 µm
(12.2 ± 2.4 hepatocytes)
Lobule volume in the
model -
3 3 3
52.5 10 12.5 10 mm
Area of necrotic lesion
before regeneration Image analysis 0.073 ± 0.011 mm²
Radius of necrotic lesion
before regeneration nec
nec A R (assuming a circular necrotic lesion)
149 ± 22 µm
(6.4 ± 1.0 hepatocytes) Sinusoids
Diameter of sinusoids Volume analysis 4.75 ± 2.25 µm
Orthogonal minimal vessel
distance Volume analysis 16.45 ± 4.22 µm
Non-branched segment
length Volume analysis 43.1 ± 18.9 µm
Hepatocyte volume Volume analysis 5 6
1.2653 10 3.915 10 mm³
Hepatocyte size Volume analysis 23.3 ± 3.1 µm1
Hepatocyte density Image analysis 1889 ± 341 cells/mm²
Next neighbor distance Volume analysis 21.6 ± 13.1 µm2
Diameter of hepa. nucleus Image analysis 9.3 ± 4.4 µm
Central vein
Length in Volume Volume analysis 107 ± 69 µm
Radius Volume analysis 41.2 ± 32.1 µm
Inclination to viewing
plane Volume analysis 6.6° ± 4.1°
Table 2: Model simulation parameters: reference parameter set obtained by a sensitivity analysis and comparison to experimental data on liver regeneration after central
necrosis in each individual lobule. The parameters for cancer cells have partially be varied (see A-10e and figure legends)
Parameter / Symbol Unit Value
(Range in sensitivity
analysis)
Source
Cell diameter lCell µm 23.3 B
Sinusoid vessel diameter lSinu µm 4.75 B
Intrinsic cell cycle time
h 24 [Vintermyr and Doskeland, 1987] Reference energy FT J 1610
[Beysens et. al., 2000.] [Schienbein et. al., 1994.] Hepatocyte Young-Modulus ECell Pa 450(300-1000) [Davidson et. al.,
1995.] [Lekka et. al., 1999.] Sinusoids Young-Modulus ESinu Pa 600
(300-1000) B
Hepatocyte Poisson ratio Cell - 0.4 [Mahaffy et. al., 2000.] [Alcaraz et.
al., 2003]
1 The hepatocyte diameter was obtained using a volume analysis based on 1.5 2
Sinusoids poisson number Sinu - 0.4 B Hepatocyte diffusion constant
C i D for all i 2 1
cm s
2 10
12 ( 13 11 2 10 2 10 ) [Beysens et. al., 2000] Receptor surface density mFor hepatocyte-hepatocyte interaction (Sinusoids are non-adhesive, i.e. m 0 for interactions involving sinusoids)
2
m
10
15 ( 14 16 10 10 ) [Chesla et. al., 1998.] [Pieper et. al. 1998.] Binding energy single bond Ws 25k TB [Beysenset. al., 2000] Friction coefficient , , for all i
j Ns / m3 107 B Morphogen diffusion coefficient DM cm² / s 10-6(10-5-10-7)
[[Casciari et. al., 1988] A: Results from quantitative analysis of confocal laser scanning micrographs. B: value assumed.
Alcaraz, J, Buscemi, L, Grabulosa, M, Trepat, X, Fabry, B, Farre, R and Navajas, D Microrheology of human lung epithelial cells measured by atomic force. Biophys. J., 84: 2071–2079, 2003.
Anderson AR, Weaver AM, Cummings PT, Quaranta V. Tumor morphology and phenotypic evolution driven by selective pressure from the microenvironment. Cell. 2006 Dec 1;127(5):905-15.
Anderson AR, Chaplain, MAJ, Rejniak, KA. Single-Cell-Based Models in Biology and Medicine. Birkhäuser, 2007.
Beysens, D, Forgacs G, and Glazier, JA. Cell sorting is analogous to phase ordering in fluids. Proc. Natl. Acad. Sci. USA, 97 (17): 9467 – 9471, 2000.
Casciari, JJ, Sotirchos, SV and Sutherland, RM. Glucose diffusivity in multicellular tumor spheroids. Cancer Res., 48: 3905 – 3909, 1988.
Chesla, SE, Selvaraj, P, and Zhu, C. Measuring two-dimensional receptor-ligand binding kinetics by micropipette. Biophys. J., 75: 1553–1557, 1998.
Chu Y-S, Dufour S, Paul Thiery J, Perez E and Pincet F. Johnson–Kendall–Roberts theory applied to living cells Phys. Rev. Lett. 94 028102, 2005.
Davidson, LA, Koehl, MAR, Keller, R, and Oster, GF. How do sea urchins invaginate? using bio-mechanics to distinguish between mechanisms of primary invagination.