Nephrol Dial Transplant (1994) 9: 642-649
Original Article
Nephroloqy
Dialysis
Transplantation
Risk factors for low urinary citrate in calcium nephrolithiasis: low
vegetable fibre intake and low urine volume to be added to the list
B. Hess
1, R. Michel
1, R. Takkinen
1, D. Ackermann
2, Ph. Jaeger
1'Policlinic of Medicine and 2Department of Urology, University Hospital, Berne, Switzerland
Abstract. Risk factors for low urinary citrate excretion were assessed in 34 consecutive male recurrent idiopathic calcium stone formers (RCSF) who collected two 24-h urines while on free-choice diet. Overt hypocitraturia (hypo-cit) was denned as UCjt x V<1.70 mmol/day, and 'low' citraturia (low-cit) as UCltxV between 1.70 and 2.11 mmol/day. Twenty-three RCSF had normocitraturia (normo-cit), six low-cit and five hypo-cit. UCit x V positively correlated with urine volume (VOLUME, r = 0.44,
P = 0.009), vegetable fibre intake (fibers, r = 0.46, P = 0.009) and Gl-alkali absorption (alkali, r = 0.47, P = 0.006), and volume, fibres and alkali tended to
be lower among RCSF with low-/hypo-cit. A 3-day NH4C1 loading test (0.95 mEq/kg BW daily in 3 doses) was performed in RCSF as well as in 14 age-matched healthy male controls (C). On a plot of urine pH versus serum bicarbonate, 10 of 11 RCSF with low-/hypo-cit, but only six of 23 with normo-cit (P = 0.0004) fell off the normal range, indicating incomplete RTA. Two or more risk factors simultaneously occurred in only four of 23 RCSF with normo-cit, but in eight of 11 with low-/hypo-cit (P = 0.002). In conclu-sion, incomplete RTA is the most prevalent risk factor for low-/hypo-cit in RCSF, and decreases in vegetable fibres and urine volume emerge as two new risk factors for low urinary CIT.
Key words: calcium nephrolithiasis; citrate; gastrointes-tinal alkali absorption; renal tubular acidosis; urine volume; vegetable fibres
Introduction
Low urinary citrate excretion is an accepted pathogenic factor for calcium renal stone formation [1,2]. Variations of systemic acid-base status have been shown for a long time to influence urinary citrate excretion [3]: for instance, metabolic alkalosis increases urinary citrate [4], whereas
amrnonium-chloride-Correspondence and offprint requests to: B. Hess MD, Policlinic of
Medicine, University Hospital, CH-3010 Berne, Switzerland.
induced acidosis lowers its excretion by 20-50% within a few hours [5]. Owing to the fact that cytosolic acidification activates citrate uptake by the proximal tubular cell [3], intracellular rather than systemic acid-osis has been postulated as the denominator common to most patients with 'idiopathic' hypocitraturia [6].
Indeed, overt metabolic acidosis is usually absent in recurrent calcium renal stone formers with 'idiopathic' hypocitraturia. With the help of the classic ammonium chloride loading test, however, we [6] and others [7] have provided evidence for incomplete renal tubular acidosis (RTA) in a substantial fraction of patients with 'idiopathic' hypocitraturia. Such a reduced capab-ility of renal acid excretion may favour intracellular acidosis and thus cause hypocitraturia in these patients. Dietary factors also modulate the urinary excretion rate of citrate. Excess animal protein intake with the acid load that it conveys lowers urinary citrate [1,8], whereas dietary protein restriction does the opposite [9]. Urinary citrate positively correlates with net gas-trointestinal absorption of alkali, which seems to be reduced in many idiopathic calcium stone formers [1]. Potassium depletion also triggers hypocitraturia [5,10]: it appears to do so via stimulation of the sodium-citrate cotransport system at the brush-border level of the proximal tubular cell, and intracellular acidosis, again, might provide the key signal [11]. Additionally, sodium chloride loading depresses urinary citrate; this effect may, again, be governed by intracellular acidosis, due to sodium-induced volume expansion with sub-sequent rise in urinary bicarbonate excretion [1].
Finally, primary intestinal malabsorption of citrate has been postulated to account for 'idiopathic' hypoci-traturia in some patients with idiopathic calcium nephrolithiasis [1].
Given a population of patients with idiopathic cal-cium nephrolithiasis studied on their free-choice diet [12], the present study aimed to address the following issues: (1) what is the prevalence of 'idiopathic' hypoci-traturia?; (2) among patients who turn out to have low urinary citrate, how often does the disorder have a metabolic origin, and how often a nutritional one?; (3) are there other mechanisms to account for low urinary citrate than those alluded to above?
Low urinary citrate and calcium nephrolithiasis
Subjects and methods
From the patients routinely seen for metabolic work-up at our renal stone clinic, 34 consecutive male recurrent idio-pathic calcium stone formers (RCSF) meeting the following criteria were studied: (1) passage or removal of at least two calcium-containing stones, defined either by stone analysis (X-ray diffraction) or disappearance of opaque material on conventional radiographs or excretory urograms; (2) no established cause of calcium stone formation such as primary hyperparathyroidism, medullary sponge kidney, overt distal renal tubular acidosis, sarcoidosis, excessive vitamin D intake, and hypercalciuria due to hypercalcaemia of malig-nancy or immobilization; (3) absence of obvious causes of hypocitraturia such as malabsorption with steatorrhoea [13], hypokalaemia (serum K<3.5 mmol/1) due to acetazolamide or thiazide treatment, or urinary tract infection [14]; and (4)
Ccrcm>70ml/min/1.73m2.
Ml RCSF were referred after ESWL or endourolegical treatment of their stone disease, and they were asked to keep unchanged the free-choice diet they used to have before stone treatment. They were never studied until at least 2 months had elapsed after urological intervention. Other medications known to interfere with calcium and citrate metabolism were discontinued at least 2 weeks prior to evaluation.
The normal values for 24-h urinary excretion rates cur-rently used in our stone clinic are based on 107 healthy male volunteers living in the area of Berne, Switzerland, while on a free-choice diet. Upper normal levels (95th percentile) are 9.00 mmol/d for calcium, 440 umol/day for oxalate, and 5.00 mmol/day for uric acid; the lower normal level of
Uc,t x V (5th percentile) is 1.70 mmol/day (320 mg/d). In an
early report by Hodgkinson [15], hypocitraturia in men had
been denned as Ua txV<2.12 mmol/day (<400mg/day);
accordingly we subclassified our RCSF into those with overt
hypocitraturia (hypo-cit), i.e. UClt x V < 1.70 mmol/day
(<320 mg/day), and those with 'low citraturia' (low-cit), i.e.
UCllxV between 1.70 and 2.11 mmol/d (320-399 mg/day).
Since the risk of calcium stone formation has been demon-strated to increase exponentially with decreasing 24-h urine volumes below 1200 ml [16], 'low volume' was defined as < 1200 ml/day. All RCSF collected two 24-h urine specimens according to our standard protocol [12]; 24-h urine values are expressed as the means of both collections.
Twenty-four-hour urines were collected in 3-litre plastic bottles containing 10 g of boric acid as preservative agent. Specimens were analysed for creatinine (Crea), calcium (Ca), phosphate (P), sodium (Na), potassium (K), chloride (Cl), magnesium (Mg), uric acid (UA) and urea by autoanalyser techniques. Citrate (Cit) was measured using the citrate lyase method [17]. Oxalate (Ox) was measured after enzymatic oxidation of oxalate by oxalate oxidase [18] as previously described [12]. Urinary sulphate (Sulph) was measured by an HPLC system utilizing an anion column to separate sulphate from other urinary anions, where sulphate is detected by conductivity change as eluent flows through a conductivity cell [19].
Urinary excretion rates of urea, UA and Sulph were taken as markers of animal protein consumption, and UN, x V as a measure of sodium intake. Since fibre-rich foods such as vegetables, grain products, and fruits are sources of alkali [20], alkali consumption was estimated from the daily inges-tion of vegetable fibres, subsequently referred to as 'dietary fibres'. The latter ones were assessed from the patients' diet protocols filled out during collections of 24-h urines, by means of food composition and nutrition tables [20], i.e.
643
two 24-h diet protocols were retrospectively analysed from each patient; direct measurements of food compositions were not performed. Since dietary fibre contributes 15-25 g to the average US diet [21], ingestion of less than 15g/day was defined as low dietary fibre intake, indicating lower alkali consumption. Net gastrointestinal absorption of alkali (expressed in mEq/24 h), subsequently referred to as 'Gl-alkali', was derived from 24-h urine excretions of non-combustible cations and anions according to the formula (Na + K + Ca + Mg)-(Cl+1.8xP) [1,22],
where electrolyte excretions are in mEq/day except for P which is in mmol/day with an average valence of 1.8 [1,22]. Low Gl-alkali was defined as < 15 mEq/day, since the lower normal limit (5th percentile) among our male healthy volun-teers was 15 mEq/day.
An ammonium chloride loading study was performed in all RCSF and additionally in 14 of our 107 healthy male volunteers, aged 44.2 ±2.6 years (range 28-62) and with normokalaemia (fasting serum K concentration between 3.5 and 4.1 mmol/1). It consisted of sampling venous blood and 2-h urine after 12 h without eating and 8 h without drinking (only tap water allowed after the last meal) on day 0
(indicated as 0). From then on, ammonium chloride (NH4C1)
was added to the free-choice diet of each subject for 3 days and given in three divided doses 20 min before each meal (total 0.05 g/kg/day, or 0.95mEq/kg/day). On day 3, sam-pling of fasting venous blood and 2-h urine was repeated
(indicated as 3). For the nomogram of fasting venous
bicar-bonate concentration versus urine pH after acid loading only' (Figure 2), nine additional male healthy volunteers were
included from a previous study with NH4C1 loading [6].
Plasma concentrations of Crea, total Ca, P, Mg, Na, K, Cl, UA, and total protein were measured by autoanalyser techniques. Serum anion gap, an indirect index for
unmeas-ured anions, was defined as [Na+] — [C\~ +HCO3~]; normal
values were 8-16 mmol/1. In whole blood, ionized
cal-cium (Ca2+) was measured by an ion-selective electrode
(Ciba-Corning Diagnostics Corp., Medfield, Massachusetts, USA) and bicarbonate by a Ciba-Corning 278 blood gas system (Ciba-Corning Diagnostics Corp.) immediately after sampling without compression. Serum intact parathyroid hormone (PTH) concentration was measured by a radio-immunoassay kit (Nichols Institute, San Juan Capistrano, California, USA); normal values are 10-65 pg/ml. Serum 25 (OH) vitamin D (normal range 6—40 ng/ml) and serum 1,25
(OH )2 vitamin D3 (calcitriol, normal range 25-79 pg/ml)
were measured by radioimmunoassay (Nichols Institute, San Juan Capistrano, California, USA).
In freshly voided 2-h fasting urines, pH was measured by a Metrohm 654 pH-Meter (Metrohm, Herisau, Switzerland). The fasting urines were analysed for Ca, P, Na, K, Cl, urea, and crea by autoanalyser techniques. Hydroxyproline (OHP) was assayed using a kit (Hypronosticon®, Organon Teknika, Boxtel, The Netherlands), where OHP is coloured by the Ehrlich's reagent and quantified photometrically after bind-ing to an acid cation exchange resin, hydrolysis (16 h) and oxidation. Urinary anion gap (AG), an indirect measure of urinary ammonium concentration [23], was calculated as [Na] + [K] —[Cl]. All 2-h fasting urine values are presented in relation to urine creatinine concentration (mmol/mmol ratio), except renal phosphate threshold (TmP/GFR), which was derived from the nomogram of Walton and Bijvoet [24], and OHP-E (umol/1 GF), which was calculated using the
formula OHPo/Creau x Creas.
All values are presented as means ±SEM. Non-parametric Mann-Whitney U-test for comparisons between and
644
Wilcoxon signed-rank test for comparisons within groups were used. Simple and multiple linear regression analysis was performed for correlation studies.
Results
The 34 male RCSF participating in the study were 42.7 + 1.6 years old (range 23-64, not different from controls). None of them had hypokalaemia (<3.5 mmol/1), their fasting serum K concentrations ranging between 3.5 and 4.5 mmol/1. Twenty-three RCSF (67.6%) were normocitraturic (normo-cit), whereas Ua tx V was below 2.12mmol/day in 32.4% (combined low-/hypo-cit), i.e. low-cit (1.70-2.11 mmol/day) in six (17.6%) and hypo-cit (<1.70mmol/day) in five RCSF (14.8%). Among patients classified as normo-cit, two of 23 had UClt x V<2.12 mmol/day in one of their two urine collections. Four of six RCSF with low-cit had urinary citrate < 2.12 mmol/day in only one urine collection, whereas four of five RCSF classified as hypo-cit had Ua tx V< 1.70 mmol/day in both 24-h urines. Among healthy volunteers, urinary citrate < 2.12 mmol/day occurred in 19 of 107 normal controls (17.8%), i.e. 12 (11.2%) had hypo-cit and 7 (6.5%) low-cit. Twelve RCSF had hypercalciuria (HCSF), and 22 were normo-calciuric (NCSF). Dietary protocols from 31 RCSF (91.2%) were available to us for further analysis; three of them (in 3 RCSF with normo-cit) were inappropri-ately filled out.
Twenty-four-hour urine data
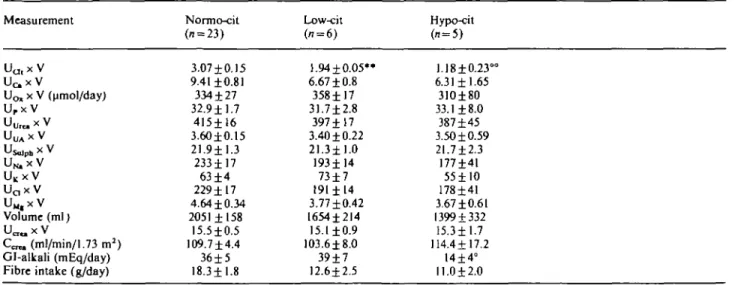
Table 1 summarizes the main parameters derived from 24-h urine collections in RCSF. With the exception of Gl-alkali, which was only 14±4 mEq/day in hypo-cit
B. Hess el al. compared with 36 ± 5 mEq/day in normo- and 39 ±7 mEq/day in low-cit, P<0.05 and < 0.025 respectively, none of the parameters was different between subgroups. When comparing the combined low-/hypo-cit group (UClt x V < 2.12 mmol/day, n = 11) with normo-cit, however, dietary fibre intake was lower in the former ones (11.9 ±1.6 g/day versus 18.3 ±1.8, P=O.O37), and so was U^ x V (6.51 ±0.84 mmol/day versus 9.41 ±0.81, P = 0.029).
Table 2 summarizes important correlations between UCu x V and various other parameters. Positive cor-relations between Uc,t x V and Scre,, CCTea, U ^ x V, UMg x V and Gl-alkali as well urine volume and dietary fibre intake were noted. Among the 107 male controls, citrate excretion was also positively, though less strongly, correlated with urine volume (r = 0.240, P = 0.014). Figure 1 demonstrates that fibre consumption below 10 g/day was always associated with low- or hypo-cit, whereas RCSF whose fibre consumption was >22.5g/d all were normocitraturic. In RCSF whose fibre consumption was between 10 and 22.5 g/day, an Table 2. Simple linear correlations between UQ, X V and other para-meters in all 34 RCSF y axis Ua ix V x axis S-Crea Volume Uc.xV U M , X V UKX V Gl-alkali Fibre intake r value 0.490 0.440 0.440 0.570 0.370 0.280 0.470 0.460 slope -0.04 0.02 0.0001 0.15 0.24 0.01 0.02 0.02 P 0.003 0.010 0.009 0.0004 0.032 0.111, NS 0.006 0.009
S-Crea, fasting serum creatinine before NH4C1 loading. NS, not
significant.
Table 1. Twenty-four-hour urine data (mean±SEM) from 34 RCSF. Measurement UU lx V U c x V Uo, x V (umol/day) Urx V UU r e,xV Usolph * V UN,X V UKxV Uax V U M , X V Volume (ml) Ucr«. X V Ccn, (ml/min/1.73 m2) Gl-alkali (mEq/day) Fibre intake (g/day)
Normo-cit (n = 23) 3.07 ±0.15 9.41 ±0.81 334 ±27 32.9 ±1.7 415±16 3.60±0.15 21.911.3 233± 17 63 ±4 229± 17 4.64 ±0.34 2051 ±158 15.5±0.5 109.7 ±4.4 36±5 18.3±1.8 Low-cit (i = 6) 1.94±0.05*» 6.67 ±0.8 358±17 31.7±2.8 397±17 3.40 ±0.22 21.3±1.0 193114 73±7 191±14 3.77±0.42 1654±214 15.1 ±0.9 103.618.0 39±7 12.6±2.5 Hypo-cit (» = 5) 1.18±0.23 6.31 ±1.65 31O±80 33.1 ±8.0 387±45 3.50 ±0.59 21.712.3 177141 55±10 178141 3.67 ±0.61 1399 + 332 15.311.7 114.4117.2 14±4° 11.012.0
All values except UQ, X V (umol/day), volume (ml), Gl-alkali (mEq/day) and fibre intake (g/day) are mmol/day. For abbreviations, see 'Methods'. Cit, urinary citrate excretion rate; Hypo-cit, < 1.70mmol/day; Low-cit, 1.70-2.11 mmol/day. + /><0.05 versus Normo-cit;
° /><0.025 versus Low-cit; °° /><0.01 versus low-cit; ** /J<0.001 versus normo-cit. In the combined low-/hypo-cit group, fibre intake was
Low urinary citrate and calcium nephrolilhiasis
y = .059x+1.592, r = .460
O6
10 15 20 25 30 35Fiber intake (g / d>
40Fig. 1. 24-h urinary citrate excretion rate (y axis) in relation to daily
intake of vegetable fibres calculated from dietary protocols (x axis). Circles, RCSF with UCit x V<2.12mmol/day (<400 mg/day) (/i = 11); triangles, RCSF with normocitraturia (/i = 20; three RCSF missing due to inappropriately returned dietary protocols).
abnormality of urine acidification (see paragraph on
NH4C1 loading) occurred in six of seven with
low-/hypo-cit, but only in three of 14 with normo-cit (P=0.034, Chi-square). There was only a trend for a positive correlation between urinary excretion rates of citrate and potassium, whereas no correlations were
found between UClt x V and urinary markers of protein
intake (Urea, UA, Sulph) as well as of sodium con-sumption (r = 0.280, P = 0.l05).
In a multiple regression analysis, UCit x V in RCSF
was positively correlated (r = 0.700, P- 0.004) with a
combination of the four factors CcrM (partial F = 2.9),
urine volume (partial F = 0.1), Gl-alkali (partial F = 3.2) and dietary fibre consumption (partial F = 6.5). When correlating urinary citrate with only Gl-alkali and dietary fibres combined, a positive correlation was again noted (r = 0.600, P=0.002); partial F values were 6.5 for Gl-alkali and 6.0 for dietary fibre intake respectively.
Since UCit x V was positively correlated with UQ, X V,
RCSF were divided into hypercalciurics (HCSF,
Ua x V>9.00 mmol/day, n = 12) and normocalciurics
(NCSF, n = 22). Table 3 summarizes values of 24-h
urine excretion rates, CCTem, Gl-alkali and daily fibre
intake in HCSF and NCSF. UC l tx V was higher in
HCSF than in NCSF; low-cit, however, occurred in two of 12 HCSF and nine of 22 NCSF (P=0.289, Chi-square), and hypo-cit was found in one of 12 HCSF
and four of 22 NCSF (/>=0.788, Chi-square). Also
elevated in HCSF versus NCSF were excretion rates
of Ox, P, urea, Sulph, Mg, urinary volume, CCTem and
daily fibre consumption. Since values of CCTra were
higher among HCSF, urinary parameters were also expressed relative to creatinine (mmol/mmol ratios); after this calculation, significant differences between HCSF and NCSF remained for Ca/Crea, P/Crea, and
645
TaWc3. Differences between hypercalciuric (HCSF) and
normocal-ciuric (NCSF) recurrent calcium stone formers Measurement Uo,xV Uc.xV UcxVOimol/d) UpxV Ur ax V UUAxV U^xV U N . X V UKx V Uax V UM.xV Volume (ml) Ur axV Ccr» (ml/min/ 1.73 m2) Gf-alkah (mEq/day) Fibre intake (g/day)
HCSF (12) 3.19 ±0.29 13.00 ±0.50 394±40 38.4 ±2.8 447±21 3.73±0.17 24.1 ±1.6 255 ±27 67±5 249 ±28 5.75 ±0.40 2232 ±178 16.4 ±0.8 120.3 ±7.6 42.4 ±7.0 20.2 ±2.8 NCSF (22) 2.27±0.17 6.00±0.35 303 + 23 29.5 ±1.7 386+14 3.45±0.18 20.5 ±1.0 197±14 62 ±4 196 ± 13 3.63 + 0.22 1696 ±161 14.9±0.5 103.4 + 4.2 28.7 ±3.9 13.9±1.4 P 0.014 0.0001 0.046 0.011 0.028 0.313, NS 0.020 0.052, NS 0.576, NS 0.105, NS 0.0003 0.019 0.171, NS 0.040 O.W9, NS 0.035 All values are means ±SEM; P values are for differences between HCSF and NCSF (Mann-Whitney U test). For abbreviations, see 'Methods' and Table 1.
Mg/Crea, whereas they disappeared for Cit/Crea (P = 0.066), Ox/Crea, Urea/Crea, and Sulph/Crea. A positive correlation was also noted between daily fibre
intake and Ua x V (r = 0.440, P = O.O14).
Fasting blood and urine samples before/after NHACl
loading
Table 4 summarizes the most important fasting blood and 2-h urine acid-base parameters in controls as well as in RCSF with normo-cit, low-cit and hypo-cit before
and after NH4C1. Among stone formers with low-cit
and hypo-cit, serum anion gap was higher than in controls and RCSF with normo-cit, both before and
after NH4C1 loading. During NH4C1 loading there was
a trend for venous bicarbonate concentration to slightly decrease in the four groups, limit of significance TaWe4. Fasting acid-base parameters and urinary cit/crea ratios
(means ±SEM) before and after NH4CI loading in 14 healthy male
controls and 34 RCSF Measurement Controls
(n=14)
Normo-cit Low-cit Hypo-cit (n = 23) (n = 6) (n = 5) A G0( m M ) A G3( m M ) Bic.0(mM) Bic3 (mM) Urine pH0 Urine pH3 AG/Creao AG/Crea3 Cit/Creao Cit/Crea3 10.3±0.7 10.2±10 25.9±0.7 24.8 ±0.5 5.93 ±0.23 4.94 ±0.05 3.34±0.80 0.32 ±0.43 0.18 ±0.02 O.IO±O.O2 12.2 ±0.8 11.8 ±0.8 24.9 ±0.5 23.8 ±0.6 6.07 ±0.16 5.08 + 0.04t 3.53 ±0.41 0.02 ±0.31 0.19 ±0.02 0.10±0.01 13.4±0.7t 17.3±2.3t 26.7 ±0.7 19.7±2.0t 6.26 ±0.18 5.27 ±0.07* 4.66 ±0.95 1.05 ±0.48 0.10±0.01t 0.04 ±0.0 I f 16.8 ± 1 . 4 " 16.7±0.6* 24.8 ±1.4 21.8±1.0 5.78±0.16 5.28±0.10t 3.21 ±0.88 1.26±0.38 0.11 ±0.04 0.04±0.01°
AG, serum anion gap; bic, venous bicarbonate. ° /><0.05; + /><0.025; * P<0.0\; ** /><0.005 versus healthy controls.
Underlined values were significantly different from corresponding values before NH4C1 loading (P<0.05, Wilcoxon signed-rank test).
646
being reached in controls and in RCSF with low-cit or hypo-cit. Urine pH was not significantly different between subgroups on day 0; it uniformly fell upon acid loading, but less markedly in RCSF than in controls. Urine anion gap/creatinine ratios also were similar between subgroups on day 0; after NH4C1 they fell sharply in all subgroups, as did urine Cit/Crea ratios. The latter ones were abnormally low in RCSF with low-cit or hypo-cit, i.e. they had 'fasting hypocitraturia'.
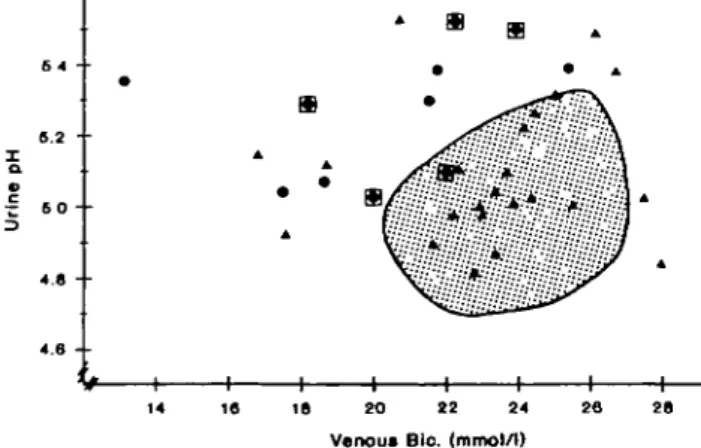
Figure 2 is a scatter plot of fasting venous bicarbon-ate concentrations versus urine pH values after NH4C1 loading; the shaded area is a nomogram obtained in 23 healthy volunteers. Urine pH decreased below 5.32 and venous bicarbonate remained above 20.5 mmol/1 in all the normal subjects. However, 18 of the 34 RCSF that we studied fell out of the nomogram: two normoci-traturics, with urine pH values of 4.84 and 5.03 in the face of blood bicarbonate concentrations of about 28 mM, were considered to be normal. In one RCSF with low-cit, venous bicarbonate after NH4C1 loading was inadvertently not determined; however, since his urine pH decreased from 6.67 to 5.49 after acid loading while his serum chloride concentration rose from 104 to 106 mmol/1, he was considered abnormal, but not depicted in Figure 2. Thus, 16 of 34 RCSF (47.1%) had an abnormality in urine acidification, characterized either as insufficiently acidic urines in the presence of normal venous bicarbonate concentrations, or as sufficiently acidic urines at the expense of sys-temic acidosis (venous bicarbonate concentration < 20.5 mmol/1), or both. Abnormal urine acidification occurred in 10 of 11 RCSF with low-/hypo-cit, but only in six 23 with normo-cit (P = 0.0004, Chi-square); Ucit x V tended to be inversely correlated with fasting urine pH after NH4C1 loading (r=-0.300, P = 0.064). The prevalence of abnormal urinary acidification was similar amongst HCSF (7 of 12) and NCSF (9 of 22,
P = 0.33\ versus HCSF, Chi-square).
Serum phosphate concentration was moderately
ffi
•z s o - •
3
14 IS IS 20 22 24 2S 28 Venous Bio. (mmol/1)
Fig. 2. Fasting urine pH (y axis) in relation to venous bicarbonate
(.x axis) after NH4C1 (0.1 mEq/kg BW/day for 3 days) in 23 healthy
men (shaded area) and 33 stone formers. Triangles, normo-cit; circles, low-cit; framed circles, hypo-cit; one RCSF with low-cit and urine pH of 5.49 not shown because of missing value of venous bicarbonate concentration.
B. Hess et al. lower (0.84 + 0.03 versus 0.98±0.04 mmol/1, P<0.05) and serum intact PTH concentration higher (33.0±3.2 versus 25.0±2.1 pg/ml, P<0.05) in RCSF with hypo-cit versus controls. Only before NH4C1 loading were TmP/GFR values lower in RCSF with normo-cit (0.76±0.03, /)=0.006) and in those with low-cit (0.79 ±0.03 mmol/1 GF, F = 0.028) than in controls (0.95 ±0.04 mmol/1 GF). All other blood and urine parameters of calcium phosphate and bone metabolism were similar in controls and the three subgroups of RCSF, and they were not differently affected by acid loading in controls and in the various subgroups of RCSF (data not shown).
Table 5 compares parameters of calcium phosphate metabolism between healthy controls and RCSF classi-fied either as HCSF or NCSF, before and after acid loading. Compared with controls, TmP/GFR was lower both in HCSF and NCSF, and HCSF had lower serum P and higher urine Ca/Crea both before and after acid loading. In comparison with NCSF, serum calcitriol and urine Ca/Crea were higher in HCSF. Serum parameters and urine Ca/crea were unaffected by acid loading, whereas TmP/GFR fell slightly in NCSF and OHP-E rose in HCSF.
Frequencies of risk factors for low citraturia
When comparing normocitraturic RCSF with the com-bined group of those with low-/hypo-cit, i.e. all RCSF with UCltx V<2.12 mmol/day (<400 mg/day), abnor-mal urine acidification was significantly more frequent among the latter ones (10 of 11 versus six of 23 in normo-cit, P = 0.0004, Chi-square). Low urine volume was found in 27.3% of RCSF with low-/hyporcit, compared with 8.7% in those with normo-cit (NS, Chi-square); 18.2% of RCSF with low-/hypo-cit and 17.4%
Table 5. Parameters of calcium phosphate and bone metabolism in
fasting blood and urine samples of male controls, HCSF and NCSF before and after NH4C1 loading
Measurement Ca2 + o(mM) Ca2 + 3(mM) S-Po (mM) S-P3 (mM) I-PTH0(pg/ l-PTH3ml) l,25-D30(pg/ 1,25-D33ml) Ca/Creao Ca/Crea3 TmP/GFRo (mmol/ TmP/GFR3 1 GF) OHP-Eo (jimol/ OHP-E3 1 GF) Controls (n=14) 1.27±0.01 1.26±0.01 0.98 ±0.04 0.95 ±0.05 25.0 ±2.1 28.7±3.l 50.5 ±5.1 53.8±4.9 0.25 ±0.02 0.34 ±0.05 0.95 ±0.04 0.84 ±0.05 1.10±0.l3 1.44±0.30 HCSF (n=12) l.27±0.01 1.26 ±0.02 0.82±0.04t 0.77±0.04t 27.2 ±3.3 26.5 ±3.0 65.3 ±4.5 67.2 ±3.8° 0.46 ±0.06** 0.53 ±0.04* 0.73 ±0.05** 0.69 ±0.04° 1.66 ±0.29 2.28 ±0.50 NCSF (n = 22) 1.26±0.01 1.27±0.01 0.88 ±0.03 0.86 ±0.03 27.8 ±2.0 30.5±2.5 49.4 ±3.3 50.4 ±3.5 0.31 ±0.03 0.37±O.O4 O.79±O.O3t 0.73 ±0.02 1.67 ±0.13* 1.59 ±0.27 P NS NS NS NS NS NS 0.018 0.007 0.021 0.004 NS NS NS NS
I-PTH, intact PTH; I.25-D3, calcitriol; TmP/GFR, renal phosphate threshold; OHP, hydroxyproline. Indicated P values are for compar-isons between HCSF and NCSF. ° /><0.05; + />< 0.025; * /><0.01;
** /'<0.005 versus healthy controls. Underlined values were signi-ficantly different from corresponding values before NH4CI loading
Low urinary citrate and calcium nephrolithiasis
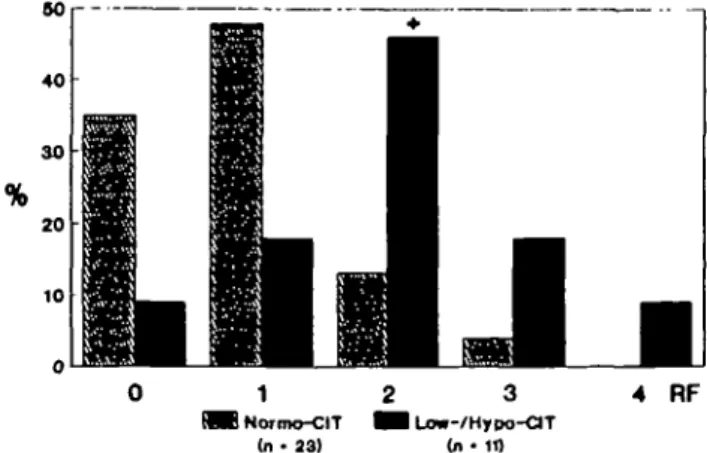
of those with normo-cit had Gl-alkali below 15 mEq/day; low fibre intake was present in 63.4% of RCSF with low-/hypo-cit and in 50.0% of those with normo-cit (NS, Chi-square). As shown in Figure 3, two or more risk factors for decreased citraturia occurred simultaneously in only 17.4% of RCSF with normo-cit (4 of 23), whereas it did so in 72.7% of RCSF with low-/hypo-cit (8 of 11, P=0.002 versus normo-cit, Chi-square).
Discussion
Among the 34 recurrent calcium stone formers studied herein under free-choice diet, overt hypocitraturia (< 1.70 mmol/day) occurred in 15% and 'low citraturia' (1.70-2.11 mmol/day) in another 18%. In the past 'idiopathic' hypocitraturia has been reported in 19-63% of patients with nephrolithiasis, either as an isolated disorder or in association with other urinary risk factors of stone formation [25]. Thus the preval-ence obtained in the present study lies within the expected range inasmuch as patients with obvious causes of hypocitraturia, such as chronic diarrhoea, overt renal tubular acidosis, hypokalaemia, renal insufficiency and urinary tract infection [2] all had been carefully excluded from this study.
Four main risk factors, occurring separately or in combination, may be associated with low urinary cit-rate excretion and deserve further consideration: an abnormality in renal handling of acid, decreased net Gl-alkali absorption, low dietary fibre consumption, and low urinary volume.
Previously, we had provided evidence for increased frequency of incomplete RTA among calcium stone formers with hypocitraturia [6]. The study, however, had been carried out under 'heavy' acid loading. In the present approach we wanted to evaluate acid-base metabolism under more 'physiological' conditions of acid loading than originally described [26]; therefore we applied only 0.05 g (0.95 mEq) NH4C1 per kg BW daily in three divided doses given for 3 consecutive
80 40 30 20 10 4 RF MB Normo-CIT (n- 23)
Fig. 3. Frequencies of occurrence of 0, 1, 2, 3, or 4 simultaneous risk factors (RF) for low citraturia (<2.12 mmol/day) in RCSF. +,
<0.05 versus normo-cit (Chi-square).
647 days. Nevertheless our healthy controls lowered their urine pH below 5.32, about the same level as that originally described by Wrong and Davies [26], despite 3 days of lighter acid loading. Forty-one percent of all RCSF either were unable to do so, or they only did it at the cost of metabolic acidosis. Both patterns reflect diminished and/or retarded renal excretion of acid. That the latter predisposes to hypocitraturia (in that case via intracellular acidosis) is supported by the fact that the defect in urinary acidification was significantly more frequent among RCSF with low citraturia or overt hypocitraturia (10 of 11) than among those with normocitraturia (4 of 23, P=0.0004, Chi-square).
Our study confirms the rinding by Pak [1] that urinary citrate excretion correlates with net G-I alkali absorption, when assessed indirectly from non-combustible urinary cations and anions [22]. In this study r Gl-alkali absorption was particularly low in RCSF with overt hypocitraturia (14+4 mEq/day). Since alkali intake, as estimated from dietary fibre consumption, was comparable to that observed in RCSF with low- and normo-cit, alkali absorption itself may have been reduced in RCSF with hypo-cit. Alternatively, hypocitraturia might have resulted—at least in some RCSF—from reduced intestinal absorp-tion of citrate itself, as described by Cowley et al. [27].
Animal protein excess is often regarded as a risk factor for hypocitraturia [1,9], by virtue of the organic acid load that this type of diet conveys. In this study, however, we did not find any significant correlations between \Jai x V and the urinary markers of protein
intake, e.g. urea, uric acid, and sulphate. Reasons for that are unclear. However, it has to be noted that the studies usually referred to in the context of protein-induced hypocitraturia (quoted in [1] and [9]) actually describe increases in citraturia within the normal range of daily urinary citrate excretion after dietary restric-tion of protein.
We also confirm our previous finding of higher Uc i txV in HCSF, compared with NCSF [28]. This seems to be partially related to higher C^ values in HCSF. There is, however, another potential explana-tion for the finding: urinary excreexplana-tion rate of citrate was positively correlated with urinary excretion rates of calcium, as previously demonstrated by others [7,29], as well as with that of magnesium. Citrate forms soluble complexes with both ions, and such complexes cannot be absorbed along the nephron [13]: thus the higher the filtered load of calcium or magnes-ium, the higher the urinary output of citrate.
Two original observations are provided by the pre-sent study. First, dietary intake of vegetable fibres is reduced in RCSF with low-/hypo-cit, and a positive correlation exists between urinary citrate excretion and fibre intake. The prevalence of calcium nephrolithiasis is known to be inversely related to dietary fibre intake [30], and stone formers have been reported to ingest less fibres than the normal population [31]. Until now, however, the mechanism governing this association had remained unknown, an intestinal hyperabsorption of calcium consecutive to insufficient binding of the
648
ion due to missing fibres with subsequent hypercalciu-ria being the most widely postulated mechanism [30]. If such was the case, HCSF ought to have lower fibre intake than NCSF. The opposite, however, was observed in this study: fibre consumption was higher in HCSF, and urinary calcium and fibre consumption were positively, not negatively correlated. Therefore, the intestinal hyperabsorption of calcium that we must postulate in HCSF was not the consequence of missing fibres, but most probably of increased calcitriol levels, as generally accepted (reviewed in [32]) and observed also in the present study. Since dietary fibres emerge as a source of alkali [20], our finding rather suggests that increased fibre ingestion protects against calcium renal stone disease by raising urinary citrate excretion. The other contribution of this study is the demon-stration that a positive correlation exists between urin-ary citrate and urinurin-ary volume. The mechanism behind this association remains speculative but might involve the impact of the proximal luminal flow rate on bicarbonate reabsorption. Indeed, net bicarbonate reabsorption positively correlates with luminal flow rate along the proximal tubule [33-35], due to flow-dependent stimulation of proton secretion by proximal tubular cells [35]. Thus at higher flow rates, cytosolic pH might rise, which in turn is expected to lower citrate uptake by those cells and increase urinary citrate excretion [3].
In conclusion the present study allows to rank the most relevant causes for 'idiopathic' hypocitraturia: incomplete RTA, reduced net Gl-alkali absorption, low vegetable fibre intake and low urinary volume. Whereas incomplete RTA, the most prevalent risk factor among RCSF with low citrate excretion, and reduced Gl-alkali absorption had already been widely discussed in the past, low vegetable fibre intake and low urinary volume had gone unnoticed so far. Moreover in an individual stone former idiopathic hypocitraturia appears to be of multifactorial origin. Given the fact that most of these causes are readily accessible to dietary advices and medical treatment, they should be carefully looked for in recurrent idio-pathic calcium stone formers.
Acknowledgements. This study was supported in part by the Swiss
National Science Foundation (Grant No. 32-33543.92).
The authors thank L. Villiger MD, for his help in recruiting patients for this study, and greatly acknowledge the assistance of K. Lippuner MD, and the technicians from the Calcium Phosphate Laboratory of the Policlinic of Medicine.
References
1. Pak CYC. Citrate and renal calculi: new insights and future directions. Am J Kidney Dis 1991; 17: 420-425
2. Hosking DH, Wilson JWL, Liedtke RR, Smith LH, Wilson DM. Urinary citrate excretion in normal persons and patients with idiopathic calcium urolithiasis. J Lab Clin Med 1985;
106: 682-689
3. Simpson DP. Citrate excretion: a window on renal metabolism.
Am J Physiol 1983; 244 (Renal Fluid Electrolyte Physio! 13):
F223-F234
4. Ostberg O. Studien Qber die Zitronensaurenausscheidung der
B. Hess et al. Menschenniere in normalen und pathologischen Zustanden.
Scand Arch Physiol 1931; 62: 81-222
5. Clarke E, Evans BM, Maclntyre I, Milne MD. Acidosis in experimental electrolyte depletion. Clin Sci 1955; 14: 421-440 6. Jaeger Ph, Portmann L, Jacquet AF, Burckhardt P. Study of
the mechanisms of hypocitraturia in idiopathic stone formers. In: Martelli A, Buli P, Marchesini B, eds. Inhibitors of
Crystallization in Renal Lilhiasis and their Clinical Application.
Acta Medica, Bologna 1988: 183-186
7. Nicar MJ, Skurla C, Sakhaee K, Pak C Y C Low urinary citrate excretion in nephrolithiasis. Urology 1983; 21: 8-14
8. Kok DJ, Iestra JA, Doorenbos CJ, Papapoulos SE. The effects of dietary excesses in animal protein and in sodium on the composition and the crystallization kinetics of calcium oxalate monohydrate in urines of healthy men. J Clin Endocrinol Metab
1990; 71: 861-867
9. Goldfarb S. Dietary factors in the pathogenesis and prophylaxis of calcium nephrolithiasis. Kidney Jnt 1988; 34: 544-555 10. Fourman P, Robinson JR. Diminished urinary excretion of
citrate during deficiencies of potassium in man. Lancet 1953; 2: 656-657
11. Levi M, McDonald LA, Preisig PA, Alpem RJ. Chronic K. depletion stimulates rat renal brush-border membrane Na-citrate cotransporter. Am J Physiol 1991; 261 (Renal Fluid
Electrolyte Physiol 30): F767-F773
12. Hess B, Casez J-P, Takkinen R, Ackermann D, Jaeger Ph. Relative hypoparathyroidism and calcitriol up-regulation in hypercalciunc calcium renal stone formers—impact of nutrition.
Am J Nephrol 1993; 13: 18-26
13. Rudman D, Dedonis JL, Fountain MT et al. Hypocitraturia in patients with gastrointestinal malabsorption. N Engl J Med 1980; 303: 657-661
14. Conway MA, Maitland ATK, Rennie JB. The urinary citrate excretion in patients with renal calculi. Br J Urol 1949; 21: 30-38 15. Hodgkinson A. Citric acid excretion in normal adults and in
patients with renal calculus. Clin Sci 1962; 23: 203-212 16. Robertson WG, Peacock M, Heybum PJ, Hanes FA.
Epidemiological risk factors m calcium stone disease. Scand
J Urol Nephrol 1980; [Suppl 53]: 15-30
17. Toftegaard Nielsen T. A method for enzymatic determination of citrate in serum and urine. Scand J Clin Lab Invest 1976; 36: 513-519
18. Chiriboga J. Some properties of an oxalic oxidase purified from barley seedlings. Biochem Biophys Res Commun 1963; 11: 277-282
19. Bucholz AE, Verplough CI, Smith JL. A method for the simultaneous measurement of chloride, nitrate, and sulfate in aqueous samples by nonsuppressed ion chromatography.
J Chrom Science 1982; 20: 449-501
20. Souci SW, Fachmann W, Kraut H. Food Composition and
Nutrition Tables 1986/87 (ed. 3). Wissenschaftliche
Verlagsgesellschaft mbH, Stuttgart: 1986
21. Rudman D. Nutrition. In: Braunwald E. et al., eds. Harrison's
Principles of Internal Medicine (ed. 11), chap 4. Me Graw-Hill
Book Company, New York, NY,: 1987: 389
22. Oh MS. A new method for estimating G—I absorption of alkali.
Kidney Int 1989; 36: 915-917
23. Battle DC, Hizon M, Cohen E, Guttermann C, Gupta R. The use of the urinary anion gap in the diagnosis of hyperchloremic metabolic acidosis. N EnglJ Med 1988; 318: 594-599
24. Walton RJ, Bijvoet OLM. Nomogram for derivation of renal threshold phosphate concentration. Lancet 1975; 2: 309-310 25. Pak CYC. Citrate and renal calculi. Miner Electrolyte Metab
1987; 13: 257-266
26. Wrong O, Davies HEF. The excretion of acid in renal disease.
QJ Med 1959; 28: 259-313
27. Cowley DM, McWhinney BC, Brown JM. Chemical factors important to calcium nephrolithiasis: evidence for impaired hydroxycarboxylic acid absorption causing hyperoxaluria. Clin
Chem 1987; 33: 243-247
28. Jaeger Ph, Portmann L, Jacquet AF, Burckhardt P. Indications au dosage du citrate urinaire dans le bilan d'une lithiase renale idiopathique. Schweiz Med Wochenschr 1986; 116: 371-373
Low urinary citrate and calcium nephrolithiasis
29. Welsham SG, McGeown MG. Urinary citrate excretion in stoneformers and normal controls. Br J Urol 1976; 48: 7-11 30. Robertson WG. Diet and calcium stones. Miner Electrolyte
Metab 1987; 13: 228-234
31. Griffith HM, O'Shea B, Kevany JP, McCormick JS. A control study of dietary factors in renal stone formation. Br J Urol 1981; 53: 416-420
32. Hess B, Jaeger Ph. The tale of parathyroid function in idiopathic hypercalciuria. Scanning Microsc 1993; 7: 403-408
649 33. Alpem RJ, Cogan MG, Rector FC Jr. Flow dependence of proximal tubular bicarbonate absorption. Am J Physiol 1983; 245 {Renal Fluid Electrolyte Physiol 14): F478-484
34. Pitts RF, Lotspeich WD. Bicarbonate and the renal regulation of acid-base balance. Am J Physiol 1982; 236 {Renal Fluid
Electrolyte Physiol 5): F163-F174
35. Cogan MG, Maddox DA, Lucci MS, Rector FC Jr. Control of proximal bicarbonate reabsorption in normal and acidotic rats.
J Clin Invest 1979; 64: 1168-1180
Received for publication 8.7.93 Accepted in revised form 9.11.93