The transcription factor Spt4-Spt5 complex regulates the expression
of ATG8 and ATG41
Xin Wen, Damián Gatica, Zhangyuan Yin, Zehan Hu, Jörn Dengjel and Daniel J. Klionsky
Table S1. Strains used in this study.
Name Genotype Ref
BY4741 MATa his3∆1 leu2∆0 met15∆0 ura3∆0 [1]
BY4742 MATα his3∆1 leu2∆0 lys2∆0 ura3∆0 [1]
DGY047 WLY176 SPT5-MYC::TRP1 This study
DGY048 WLY176 SPT5-MYC S1009A S1015A S1025A S1032A S1043A
S1052A S1058A::TRP1 This study
DGY049 WLY176 SPT5-MYC S1009E S1015E S1025E S1032E S1043E
S1052E S1058E::TRP1 This study
DGY050 WLY176 GFP-ATG8(405)::LEU2 SPT5-MYC::TRP1 This study DGY051 WLY176 GFP-ATG8(405)::LEU2 SPT5-MYC S1009A S1015A
S1025A S1032A S1043A S1052A S1058A::TRP1 This study DGY052 WLY176 GFP-ATG8(405)::LEU2 SPT5-MYC S1009E S1015E
S1025E S1032E S1043E S1052E S1058E::TRP1 This study
JMY97 WLY176, ume6∆::HIS3 [2]
JMY347 SEY6210, ZEO1p-pho13∆ pho8∆60, CUP1p-GFP-ATG8(405)::LEU2
This study SEY6210 MATα leu2-3,112 ura3-52 his3-Δ200 trp1-Δ901 suc2-Δ9
lys2-801; GAL
[1] TVY1 MATα leu2–3,112 ura3–52 his3-∆200 trp1-∆901 lys2–801
suc2-∆9 GAL pep4∆
∷
LEU2[3]
WLY176 SEY6210 pho13∆ pho8∆60 [4]
WXY100 TVY1 spt4∆::HIS3 This study
WXY101 TVY1 bur2∆::URA3 This study
WXY102 WLY176 SPT5-PA::TRP1 This study
WXY103 WLY176 spt4∆::KAN SPT5-PA::TRP1 This study WXY104 WLY176 bur2∆::URA3 SPT5-PA::TRP1 This study
WXY105 WLY176 spt4∆::HIS3 This study
WXY106 WLY176 SPT4-PA::TRP1 This study
WXY107 WLY176 SPT5-GFP::KAN This study
WXY108 WLY176 ATG5-PA::TRP1 This study
WXY109 WLY176 spt4∆::KAN ATG5-PA::TRP1 This study
WXY110 WLY176 ATG20-PA::TRP1 This study
WXY111 WLY176 spt4∆::URA3 ATG20-PA::TRP1 This study
WXY112 WLY176 CUP1p-GFP-ATG8(405)::LEU2 This study
WXY113 WLY176 spt4∆::URA3 CUP1p-GFP-ATG8(405)::LEU2 This study
WXY114 ZYY108 spt4∆::URA3 This study
WXY115 WLY176 bur2∆::KAN This study
WXY116 WLY176 bur2∆::KAN ATG41-PA::TRP1 This study WXY117 WLY176 SPT5-PA::TRP1 SGV1-MYC::KAN This study WXY120 WLY176 rim15∆::URA3 SPT5-PA::TRP1 SGV1-MYC::KAN This study
WXY121 BY4741 vac8∆::HIS3 This study
WXY122 BY4741 spt4∆::URA3 vac8∆::HIS3 This study
WXY124 ZYY108 rim15∆::URA3 This study WXY125 WLY176, pNHK53::URA3 SPT5-AID-MYC::KAN This study
WXY126 SEY6210, atg1∆::HIS3 This study
WXY127 ZYY108 SPT5-MYC::TRP1 This study
WXY128 ZYY108 SPT5-MYC S1009A S1015A S1025A S1032A S1043A S1052A S1058A::TRP1
This study
WXY129 ZYY108 ume6∆::URA3 This study
WXY130 ZYY124 spt4∆::URA3 This study
WXY131 JMY347, spt4∆::URA3 This study
WXY132 ZYY108 SPT5-MYC S1009E S1015E S1025E S1032E S1043E S1052E S1058E::TRP1
This study WXY133 WXY125, CUP1p-GFP-ATG8(405)::LEU2 This study
WXY134 WXY125, ATG41-PA:: TRP1 This study
YZY007 BY4742 arg4∆::URA3 This study
YZY076 BY4742 arg4∆::URA3 rim15∆::KAN This study
ZYY108 WLY176 ATG41-PA::HIS3 [5]
ZYY124 WLY176 GCN4-PA::LEU2 [5]
Supplemental references
[1] Winston F, Dollard C, Ricupero-Hovasse SL. Construction of a set of convenient Saccharomyces cerevisiae strains that are isogenic to S288C. Yeast. 1995;11:53-5.
[2] Bartholomew CR, Suzuki T, Du Z, Backues SK, Jin M, Lynch-Day MA, et al. Ume6 transcription factor is part of a signaling cascade that regulates autophagy. Proc Natl Acad Sci U S A. 2012;109:11206-10.
[3] Gerhardt B, Kordas TJ, Thompson CM, Patel P, Vida T. The vesicle transport protein Vps33p is an ATP-binding protein that localizes to the cytosol in an energy-dependent manner. J Biol Chem. 1998;273:15818-29.
[4] Kanki T, Wang K, Baba M, Bartholomew CR, Lynch-Day MA, Du Z, et al. A genomic screen for yeast mutants defective in selective mitochondria autophagy. Mol Biol Cell. 2009;20:4730-8. [5] Yao Z, Delorme-Axford E, Backues SK, Klionsky DJ. Atg41/Icy2 regulates autophagosome formation. Autophagy. 2015;11:2288-99.
Table S2. Oligonucleotide primers used in this study.
Name Sequence Use
ATG1_F ATCTAAGATGGCCGCACATATG
ATG1 mRNA level check
ATG1_R AGGGTAGTCACCATAGGCATTC
ATG1 mRNA level check
ATG5_F TCGGTCAACGAAGCTCGAAA
ATG5 mRNA level check
ATG5_R GATGAGCGGTATATGTCGCG ATG5 mRNA level check
ATG7_F ATGAGCATTGTCCAGCATGTAG ATG7 mRNA level check ATG7_R GACCTCCTGCTTTATGACTGAC
ATG7 mRNA level check
ATG8_F GAAGGCCATCTTCATTTTTGTC
ATG8 mRNA level check
ATG8_R TTCTCCTGAGTAAGTGACATAC
ATG8 mRNA level check
ATG9_F CGTACTAACAGAGTCTTTCCTTG
ATG9 mRNA level check
ATG9_R CTAAGACACCACCCTTATTGAG
ATG9 mRNA level check
ATG20_F CAGGTAGCGGTGGGAAATCA
ATG20 mRNA level check
ATG20_R TGCGGTATGCGGATCTGTTT ATG20 mRNA level check
ATG41_F CGAGTACTGAAGACGATTGCAT
ATG41 mRNA level check
ATG41 ChIP-qPCR check
ATG41_R TGCGACATTGGCAAAGGCAT
ATG41 mRNA level check
ATG41 ChIP-qPCR check
YAT1_F CTCGGTTTGCGTCGCTCATG
YAT1 mRNA level check
YAT1_R GTAGCCGGACAACAGGTATT
YAT1 mRNA level check
ALG9_F CACGGATAGTGGCTTTGGTGAACAATTAC RT-qPCR check ALG9_R TATGATTATCTGGCAGCAGGAAAGAACTTGGG RT-qPCR check TFC1_F GCTGGCACTCATATCTTATCGTTTCACAATGG ChIP-qPCR check
TFC1_R GAACCTGCTGTCAATACCGCCTGGAG ChIP-qPCR check
ATG1-500_F TCCTTGTTCGTTTCGTGTATCTG
ATG1 ChIP-qPCR check
ATG1-500_R GGTTTAAGAAATCAGAGCCGAGC ATG1 ChIP-qPCR check ATG1+80_F TAAAGATCACACAACCTCTGTGAACC ATG1 ChIP-qPCR check ATG1+80_R GATACTTCCTTTATGGCTACATGCTG ATG1 ChIP-qPCR check
ATG1+330_R ATTGACTGTGAACGAACATCAACAG ATG1 ChIP-qPCR check ATG1+330_F GGTTCTCACTCGGTGGAGGGTATTT ATG1 ChIP-qPCR check ATG41-100_F GCGGCTCTGCGTAAAAAGGT ATG41 ChIP-qPCR check ATG41-100_R TTGGTTGGTTTGGTGTAGCC ATG41 ChIP-qPCR check ATG41+20_F GGCTACACCAAACCAACCAA ATG41 ChIP-qPCR check
ATG41+20_R GGCTCGAAAGCAACGTTTGA ATG41 ChIP-qPCR check ATG41+110_F TCAAACGTTGCTTTCGAGCC ATG41 ChIP-qPCR check ATG41+110_R GTGCATTCTGACTCATCGAC ATG41 ChIP-qPCR check ATG41+200_F TTTTCCGCTATCGTACCCGA ATG41 ChIP-qPCR check ATG41+200_R TCCTTACTAGCAGCAGCAAC ATG41 ChIP-qPCR check ATG8-20_F GGGAACCATTAAAGGTTGAGGAG ATG8 ChIP-qPCR check ATG8-20_R AATCCTCTCCGACTCCGCCTTC ATG8 ChIP-qPCR check ATG8+50_F ACTAGAGACATGAAGTCTACATTTAAGTCT ATG8 ChIP-qPCR check
ATG8+50_R TCAGCAGGAACTAGATATTTACGCTTATCA ATG8 ChIP-qPCR check ATG8+150_F GGAGAGGATTGCTGACAGGTTCAAG ATG8 ChIP-qPCR check ATG8+150_R AAATGAAGATGGCCTTCTCAGGGGG ATG8 ChIP-qPCR check
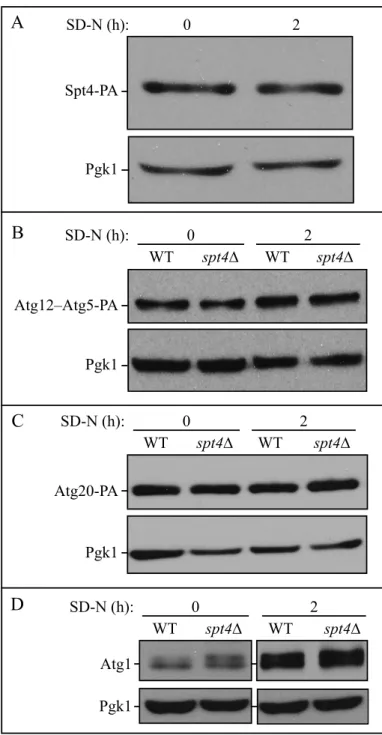
Figure S1. Spt4 protein level does not change after starvation, and protein levels of Atg5, Atg20
and Atg1 remain similar in spt4∆ cells. (A) Samples were collected from a strain expressing PA-tagged Spt4 (WXY106) under both growing and starvation conditions, and protein extracts were analyzed by western blot using antibodies to PA; Pgk1 was used as the loading control. (B-C) The anti-PA antibody was used to detect Atg5 (as the Atg12–Atg5 conjugate) and Atg20 protein levels, by probing for the PA tag in wild-type (WXY108, WXY110) and spt4∆ (WXY109, WXY111) cells in growing (YPD) and starvation (SD-N, t=2 h) conditions. Pgk1 was used as a loading control. (D) Samples from the wild-type (WLY176) and spt4∆ (WXY105) strains were collected in growing (YPD) and starvation (SD-N, t=2 h) conditions. The samples were analyzed by western blot with anti-Atg1 antibodies; Pgk1 was used as a loading control.
Pgk1 B 0 2 WT spt4∆ WT spt4∆ SD-N (h): Atg12–Atg5-PA Pgk1 Atg20-PA Pgk1 C 0 2 WT spt4∆ WT spt4∆ SD-N (h): A SD-N (h): 0 2 Spt4-PA Pgk1 0 2 WT spt4∆ WT spt4∆ SD-N (h): Atg1 D
A 0.2 0.4 0.6 0.8 1.0 N.S. WT Spt5: 0.2 0.4 0.6 0.8 1.0 WT N.S. SD-N (1 h) SD-N (0 h) S7A Relative A TG8 mRNA level Relative A TG8 mRNA level 0.0 0.0 Spt5: S7A Pgk1 0.5 1.0 1.5 2.0 * Pgk1 GFP SD-N (h): 0 2 WT WT GFP-Atg8 SD-N (2 h) Free GFP (%) *** 20 40 60 80 100 120 C E D SD-N (0 h) Spt5: S7E S7E WT Spt5: S7E Relative A TG41 mRNA level 0.0 WT Spt5:0 S7E SD-N (h): 0 2 WT WT Spt5: S7E S7E F Atg41-PA (S.E.) Atg41-PA (L.E.) 30 60 90 120 150 Pho8 ∆60 activity (%) ** * +N –N B 0 WT Spt5: S7A S7E SD-N (4 h)
Figure S2. Autophagy activity and ATG41/Atg41 expression are upregulated in cells expressing
phosphomimetic Spt5[S7E]. (A) The RT-qPCR analysis of the ATG8 mRNA level in WT (DGY047) and Spt5[S7A] (DGY048) cells in growing and starvation conditions. Error bars represent the SEM of at least 3 independent experiments, and WT was set as 1 in both conditions; other values were normalized. N.S., not significant. (B) Autophagy was measured with the quantitative Pho8∆60 assay in WT (DGY047), Spt5[S7A] (DGY048) and Spt5[S7E] (DGY049) cells under growing conditions (+N) and after 4 h of nitrogen starvation (-N). Error bars represent the SEM of at least 3 independent experiments. *, p<0.05; **, p<0.01. (C-D) Autophagy activity was measured with the GFP-Atg8 processing assay in WT (DGY050) and Spt5[S7E] (DGY052) cells. Proteins were analyzed by western blot with anti-YFP antibody and anti-Pgk1 (loading control) antiserum. The quantitative analysis of processed GFP after starvation is shown in (D), and the error bar represents the SEM of 3 independent experiments. The processed GFP ratio after starvation has been set as 1, and other values were normalized. ***, p<0.005. (E) The mRNA level of ATG41 was measured by RT-qPCR in WT (DGY047) and Spt5[S7E] (DGY049) cells in growing conditions. Error bars represent the SEM of at least 3 independent experiments, and WT was set as 1; other values were normalized. *, p<0.05. (F) The Atg41-PA protein level was tested by western blot and analyzed using anti-PA antibody in WT (WXY127) and Spt5[S7E] (WXY132) cells.
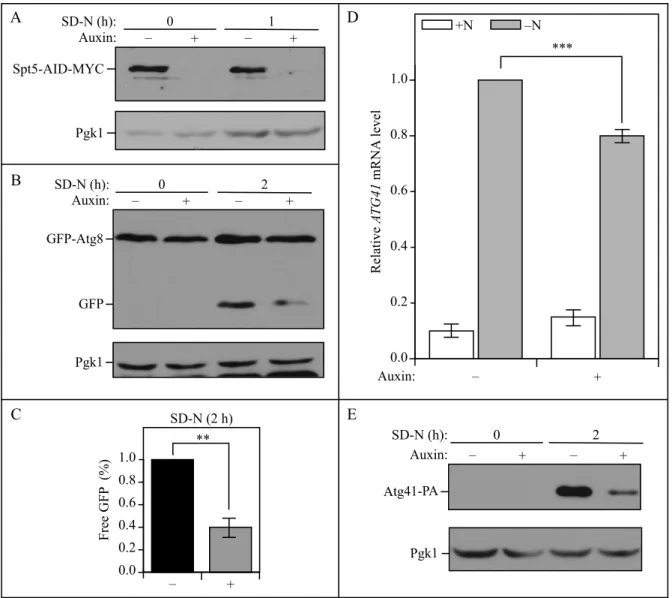
Figure S3. The temporal depletion of Spt5 using an Spt5-inducible degradation strain leads to
decreased autophagy activity. (A) Spt5 levels were measured by western blot in an Spt5 auxin-inducible degron (AID) strain (WXY125) in both nutrient-rich and starvation conditions in the presence of DMSO (vehicle) or 300 µM auxin; the loss of Spt5-AID-MYC was detected with anti-MYC antibody after auxin treatment. (B-C) Autophagy activity was measured by the GFP-Atg8 processing assay. The Spt5-AID-MYC strain (WXY133) was incubated with DMSO or auxin in both growing (YPD, mid-log phase) and starvation (SD-N, t=2 h) conditions. Anti-YFP antibody and anti-Pgk1 (loading control) antiserum were used to detect the corresponding proteins. The quantitative analysis of processed GFP is shown in (C), and the error bar represents the SEM of 3 independent experiments. The processed GFP after 2 h of starvation was set as 1, and other values were normalized. (D) The mRNA level of ATG41 was quantified by RT-qPCR in both growing (+N) and starvation (-N) conditions. The value of the strain treated with DMSO in -N was set as 1, and other values were normalized. The error bars indicate the SEM of at least 3 independent experiments. ***, p<0.005. (E) Anti-PA antibody was used to detect the protein level of Atg41-PA in the Spt5-AID-MYC strain (WXY134) when the strain was incubated with DMSO or auxin in either growing (SD-N, t=0 h) or starvation (SD-N, t=2 h) conditions.
0 – SD-N (h): Auxin: 2 B GFP-Atg8 GFP Pgk1 C E 0 SD-N (h): 2 Atg41-PA Pgk1 0.0 0.2 0.4 0.6 0.8 1.0 Free GFP (%) SD-N (2 h) – ** D 0.0 0.2 0.4 0.6 0.8 1.0 Relative A TG41 mRNA level +N –N *** + – + 0 SD-N (h): Spt5-AID-MYC 1 Pgk1 A – Auxin: + – + – Auxin: + – + + – Auxin: +
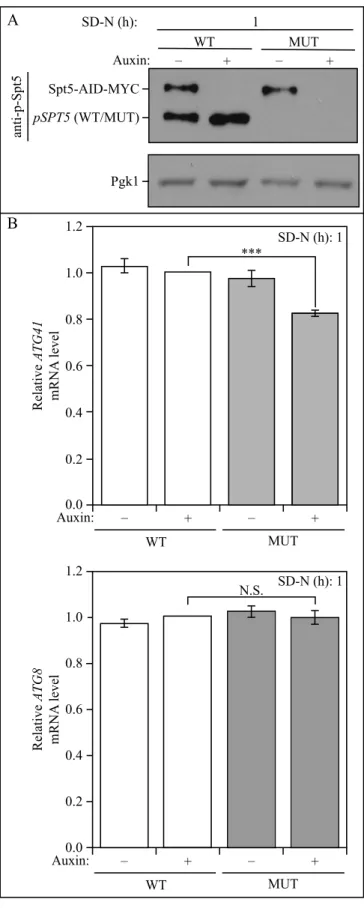
Figure S4. The nonphosphorylable mutant of
Spt5 in the Spt5-inducible degradation strain displays a decreased ATG41 mRNA level. (A) The centromeric HIS3-marked Spt5 WT (WT) and Spt5[S15A] (MUT) plasmids were transformed into the Spt5-inducible degradation strain (WXY125). The anti-p-Spt5 antibody was used to detect anti-p-Spt5 phosphorylation after starvation. (B) The mRNA level of ATG41 and ATG8 were quantified by RT-qPCR in Spt5-AID-MYC strains with WT and MUT plasmids incubated with DMSO and auxin in the nutrient-depleted condition. The value of WT with auxin was set as 1, and other values were normalized. The error bars indicate the SEM of at least 3 independent experiments. N.S., not significant; ***, p<0.005. 0.2 0.4 0.6 0.8 1.0 1.2 Relative ATG41 mRN A level WT MUT SD-N (h): 1 *** A B WT MUT SD-N (h): 1 Spt5-AID-MYC anti-p-Spt5 Pgk1 – Auxin: + – + – Auxin:0.0 + – + 0.2 0.4 0.6 0.8 1.0 1.2 Relative ATG8 mRN A level SD-N (h): 1 N.S. WT MUT – Auxin:0.0 + – + pSPT5 (WT/MUT)
Figure S5. The deletion of ATG1 results in a partial block of Spt5 phosphorylation but has no
effect on ATG41. (A) The phosphorylation of Spt5 was detected with anti-p-Spt5 antibody in western blot samples of WT (SEY6210) and atg1∆ (WXY126) cells collected from growing and starvation (SD-N=2 h) conditions. (B) The RT-qPCR analysis of ATG41 mRNA level in WT and atg1∆ cells after starvation. Error bars represent the SEM of at least 3 independent experiments, and WT was set as 1; the other value was normalized. N.S, not significant.
A
SD-N (h): 0 2 WT WT atg1∆ anti-p-Spt5 Pgk1B
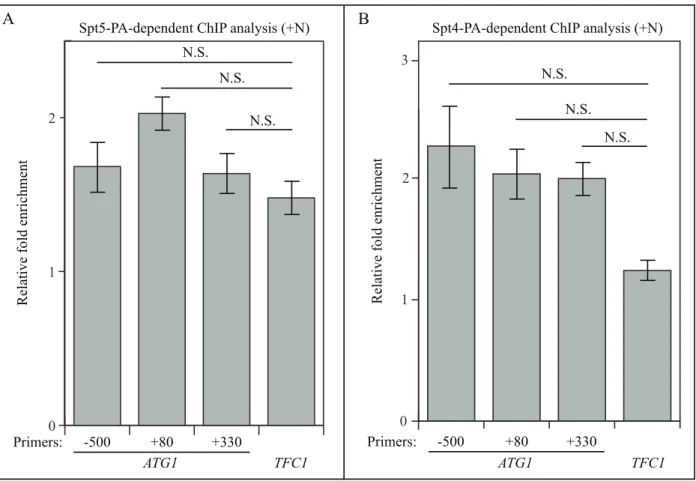
0.0 0.2 0.4 0.6 0.8 1.0 1.2 WT atg1∆ atg1∆ SD-N (1 h) N.S. Relative A TG41 mRNA levelFigure S6. ChIP analysis shows that Spt5 and Spt4 may not bind to ATG1 DNA. (A-B) ChIP
analysis was conducted using the protein A-tagged (A) Spt5 (WXY102) and (B) Spt4 (WXY106) strains on 3 regions of DNA at the ATG1 locus: -500 base pairs (bps), +80 bps, and +330 bps. The ChIP results were normalized to the input DNA, and TFC1 was used as a negative control for both strains. N.S., not significant.
Relative fold enrichment
-500 +80 +330
Primers:
Spt4-PA-dependent ChIP analysis (+N)
ATG1 TFC1 0 1 2 B 3 N.S. N.S. N.S. Spt5-PA-dependent ChIP analysis (+N)
A 0 1 2 -500 +80 +330 Primers: ATG1 TFC1
Relative fold enrichment
N.S. N.S.
Figure S7. The transcription factors Ume6 and Gcn4 are not involved in Spt4-Spt5 complex
regulation on autophagy. (A) The Atg41-PA protein level was detected with anti-PA antibody in WT (ZYY108) and ume6∆ (WXY129) cells in growing (SD-N, t=0 h) and starvation (SD-N, t=2 h) conditions. Anti-Pgk1 antiserum was used to detect the loading control. (B) The Gcn4-PA protein level was analyzed by western blot with the anti-PA antibody in WT (ZYY124) and spt4∆ (WXY130) strains. 0 SD-N (h): 2 WT spt4∆ WT spt4∆ Gcn4-PA Pgk1 B A Atg41-PA Pgk1 0 WT ume6∆ WT ume6∆ SD-N (h): 2
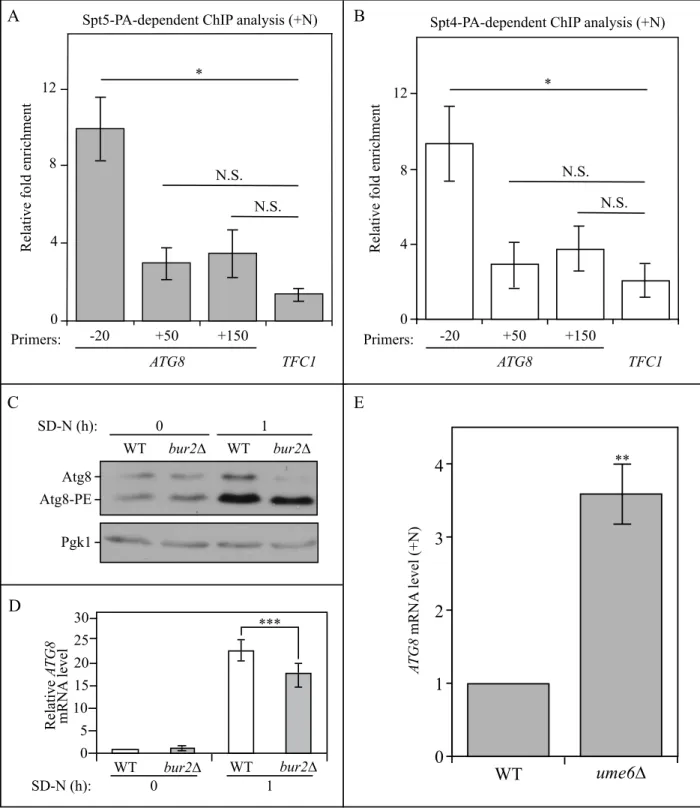
Figure S8. The direct binding of the Spt4-Spt5 complex with ATG8 and the effect of the
Sgv1/Bur1-Bur2 complex on ATG8/Atg8. (A-B) Spt5- and Spt4-dependent ChIP analysis (WXY102, WXY106) on different regions (-20, +50, +150) of ATG8. Results were normalized to the input DNA, and TFC1 was used as a negative control for both strains. The error bars show the SEM of at least 3 independent experiments: *, p<0.05; N.S., not significant. (C) The Atg8 protein level was detected by western blot with anti-Atg8 antiserum in wild-type (TVY1) and bur2∆
Atg8-PE Atg8 0 WT bur2∆ WT bur2∆ SD-N (h): 1 Pgk1 D WT bur2∆ WT bur2∆ SD-N (h): 0 1 0 25 20 15 5 10 30 Relative A TG8 mRNA level *** C 1 2 3 4 A TG8 mRNA level (+N) WT ume6∆ 0 ** E A 0 4 8 12
Spt5-PA-dependent ChIP analysis (+N)
ATG8 -20 Primers: +50 +150 TFC1 * N.S. N.S.
Relative fold enrichment
0 4 8 12 ATG8 -20 Primers: +50 +150 TFC1
Relative fold enrichment
B Spt4-PA-dependent ChIP analysis (+N)
*
N.S. N.S.
(WXY101) samples collected from both growing (YPD) and starvation (SD-N, 1 h) conditions. (D) The wild-type (WLY176) and bur2∆ (WXY115) cells were cultured until mid-log phase in growing conditions (YPD) and then shifted to starvation (SD-N) for 1 h. The mRNA level of ATG8 was measured by RT-qPCR. The error bar represents the SEM of 3 independent experiments, and p values are reported for the comparison between the wild-type and bur2∆ strains during starvation. ***, p<0.005. (E) The ATG8 mRNA level was measured by RT-qPCR in both WT and ume6∆ (JMY97) cells in growing conditions (YPD). Error bars represent the SEM of at least 3 independent experiments, and WT was set as 1. **, p<0.01.