Barbara B ü chel , Johanna Sistonen , Markus Joerger , Yolanda Aebi , Stefan Sch ü rch
and Carlo R. Largiad è r*
Comparative evaluation of the My5-FU ™
immunoassay and LC-MS/MS in monitoring the
5-fluorouracil plasma levels in cancer patients
Abstract
Background: Chemotherapies of solid tumors commonly
include 5-fluorouracil (5-FU). With standard doses of 5-FU,
substantial inter-patient variability has been observed
in exposure levels and treatment response. Recently,
improved outcomes in colorectal cancer patients due to
pharmacokinetically guided 5-FU dosing were reported.
We aimed at establishing a rapid and sensitive method for
monitoring 5-FU plasma levels in cancer patients in our
routine clinical practice.
Methods: Performance of the Saladax My5-FU ™
immuno-assay was evaluated on the Roche Cobas
®Integra 800
ana-lyzer. Subsequently, 5-FU concentrations of 247 clinical
plasma samples obtained with this assay were compared
to the results obtained by liquid chromatography-tandem
mass spectrometry (LC-MS/MS) and other commonly used
clinical analyzers (Olympus AU400, Roche Cobas c6000,
and Thermo Fisher CDx90).
Results: The My-FU assay was successfully validated on
the Cobas Integra 800 analyzer in terms of linearity,
preci-sion, accuracy, recovery, interference, sample carryover,
and dilution integrity. Method comparison between the
Cobas Integra 800 and LC-MS/MS revealed a proportional
bias of 7% towards higher values measured with the
My5-FU assay. However, when the Cobas Integra 800 was
compared to three other clinical analyzers in addition to
LC-MS/MS including 50 samples representing the typical
clinical range of 5-FU plasma concentrations, only a small
proportional bias (
≤ 1.6%) and a constant bias below the
limit of detection was observed.
Conclusions:
The My5-FU assay demonstrated robust
and highly comparable performance on different
anal-yzers. Therefore, the assay is suitable for monitoring 5-FU
plasma levels in routine clinical practice and may
con-tribute to improved efficacy and safety of commonly used
5-FU-based chemotherapies.
Keywords: Cobas Integra 800; 5-fluorouracil; method
comparison; My5-FU; therapeutic drug monitoring.
*Corresponding author: Carlo R. Largiad è r , Institute of Clinical Chemistry, Inselspital, Bern University Hospital, and University of Bern, INO-F, 3010 Bern, Switzerland, Phone: + 41 31 632 95 45, Fax: + 41 31 632 48 62, E-mail: carlo.largiader@insel.ch Barbara B ü chel: Institute of Clinical Chemistry, Inselspital, Bern University Hospital, and University of Bern, Bern, Switzerland; and Graduate School for Cellular and Biomedical Sciences, University of Bern, Bern, Switzerland
Johanna Sistonen and Yolanda Aebi: Institute of Clinical Chemistry, Inselspital, Bern University Hospital, and University of Bern, Bern, Switzerland
Markus Joerger: Department of Medical Oncology and Hematology, Cantonal Hospital of St. Gallen, St. Gallen, Switzerland
Stefan Sch ü rch: Department of Chemistry and Biochemistry, University of Bern, Bern, Switzerland
Introduction
The anticancer drug 5-fluorouracil (5-FU) is commonly
used in combination chemotherapies of solid tumors [ 1 ].
In general, 5-FU is administered by continuous
intrave-nous infusion, bolus injection or as an oral prodrug
for-mulation (e.g., capecitabine). Substantial inter-individual
variability in drug exposure and therapy response has
been observed in the Caucasian population at standard
5-FU doses [ 2 , 3 ]. Approximately 10% – 20% of patients
treated with 5-FU-based regimens develop severe
tox-icities of grade 3 or higher as assessed according to the
National Cancer Institute Common Terminology Criteria
for Adverse Events (NCI CTCAE). It has been observed that
the majority of patients exhibit drug levels outside the
therapeutic range and that more than 50% of patients do
not benefit from standard 5-FU therapies [ 1 ].
In the current clinical practice, dosing of 5-FU is
com-monly based on the patient ’ s body surface area (BSA),
even though it has been shown that BSA is a poor
pre-dictor of systemic drug exposure [ 4 – 6 ]. Several studies
have reported a relationship between drug exposure and
response in terms of both efficacy and toxicity [ 5 , 7 – 9 ]. An
area under the curve (AUC) of 20 – 25 mg
× h/L, that is
cal-culated for 5-FU as plasma concentration (mg/L) at steady
state multiplied by infusion time (h), has been established
as the target exposure range for optimal treatment outcome
in colorectal cancer [ 10 ]. By adjusting the 5-FU dosing
based on pharmacokinetic monitoring in patients
receiv-ing 5-FU monotherapy, significantly improved response
rate and fewer gastrointestinal toxicities were observed
compared to patients treated with conventional dosing
of 5-FU [ 10 ]. These findings were recently replicated in a
cohort of 157 metastatic colorectal cancer patients
receiv-ing either pharmacokinetically guided or conventional
5-FU dosing in FOLFOX (leucovorin, fluorouracil,
oxali-platin) therapy [ 11 ]. Therapeutic drug monitoring (TDM)
of 5-FU during infusion therapy may be an effective tool to
reduce the occurrence of adverse side effects due to drug
concentration levels above the optimal range, as well as
to identify under-dosed patients receiving less effective
treatment. Therefore, 5-FU TDM could improve both safety
and efficacy of the treatment.
Routine testing of drug levels requires an analytical
method, which is accurate, rapid, and easy to use. Over
the last 40 years, a variety of methods for 5-FU analysis
have been developed, with recent reports applying liquid
chromatography-tandem mass spectrometry (LC-MS/MS)
[ 12 – 18 ]. Although, LC-MS/MS methods are very sensitive
and robust, the instrumentation is not yet in standard use
in routine clinical laboratories. In addition, there is no
cer-tified commercial kit assay currently available for
measur-ing 5-FU plasma levels by LC-MS/MS that can be readily
used by routine laboratories. However, a nanoparticle
immunoassay for 5-FU analysis (My5-FU ™ ; Saladax
Bio-medical, Inc., PA, USA) was recently developed and
evalu-ated on the Olympus AU400 analyzer (Beckman Coulter,
Nyon, Switzerland) [ 19 , 20 ]. In this study, we evaluated
the My5-FU assay performance on the Cobas
®Integra 800
analyzer (Roche Diagnostics, Rotkreuz, Switzerland) and
compared results from clinical plasma samples to those
obtained by LC-MS/MS and by three other clinical
analyz-ers. Our aim was to establish a rapid and sensitive method
for monitoring 5-FU plasma levels in cancer patients in
our routine clinical practice.
Materials and methods
Samples
Clinical samples were collected from 32 gastrointestinal cancer pa-tients receiving prolonged (48 h) 5-FU infusion therapy at the Can-tonal Hospital of St. Gallen, Switzerland, according to a study pro-tocol approved by the local Ethics Committee (EKSG 08/088). All
study participants provided written informed consent. A total of 197 samples were taken at several time points during the fi rst two cycles of chemotherapy. Blood samples were collected in heparinized tubes and immediately placed on ice to inhibit dihydropyrimidine dehydro-genase (DPD) enzyme activity to avoid 5-FU degradation [ 21 ]. Plasma was separated within 1 h aft er blood collection and samples were stored at − 20 ° C until analysis. Plasma samples from healthy volun-teers were obtained using the same procedure as described above, and if needed, pooled and spiked to assess diff erent validation rameters. In addition, a set of 50 samples (banked samples from pa-tients on 5-FU-containing regimens) was provided by Saladax Bio-medical for method comparison.
My5-FU assay
The My5-FU immunoassay was developed for rapid determination of 5-FU levels in human plasma [ 19 ]. The assay is based on aggregation of nanoparticles that is inversely proportional to the amount of 5-FU in the sample, and it can be applied to automated clinical chemistry analyzers with photometric detection. The assay reagents, calibra-tors, and quality control (QC) samples for the study were provided by Saladax Biomedical. The calibrator set contained standards at 0, 150, 300, 600, 1200, and 1800 ng/mL of 5-FU, and the three QC samples (low, medium, and high control) contained 5-FU at concentrations of 225 ng/mL, 450 ng/mL, and 900 ng/mL, respectively.
Assay validation on Cobas Integra 800
The performance of the My5-FU assay was evaluated on the Cobas Integra 800 analyzer. The following validation parameters were as-sessed: linearity, within-run precision, within-run accuracy, total precision, between-day precision, between-day accuracy, recovery, interference, sample carryover, and dilution integrity. Prior to each run, a calibration and duplicate QC analyses were performed. QC sam-ples had to be within the specifi cations recommended by the manu-facturer: ± 8% for the low QC sample (range 207 – 243 ng/mL), ± 6% for the medium QC sample (range 423 – 477 ng/mL), and ± 5% for the high QC sample (range 855 – 945 ng/mL).
Linearity was assessed using fi ve replicates of 11 diff erent 5-FU concentrations covering the calibration range. Samples for linear-ity assessment were obtained by diluting plasma spiked at a high concentration of 5-FU (1750 ng/mL) with plasma spiked at a low concentration (100 ng/mL) as described in the Clinical Laboratory Standards Institute (CLSI) Guideline EP6-A [ 22 ]. Linearity was con-sidered acceptable if the imprecision (coeffi cient of variation, CV) at each concentration level was ≤ 15% and the inaccuracy (percent bias, %bias) was within ± 10% for concentrations ≥ 150 ng/mL and within ± 15% for concentrations < 150 ng/mL.
Within-run imprecision (CV) was determined on two separate days by analyzing on each day 20 replicates of the low and the me-dium QC samples and two plasma pools (pooled from fi ve healthy donors), which were spiked with 5-FU at concentrations of 240 and 700 ng/mL. Imprecision of ≤ 10% was considered acceptable follo-wing the manufacturer ’ s recommendation. No specifi cations for within-run inaccuracies were stated by the manufacturer. However, according to internationally accepted guidelines for bioanalytical method validation [ 23 , 24 ], within-run inaccuracies (%bias) should
not exceed 15%. The total imprecision (CV) was determined by ana-lyzing 40 replicates of each QC sample in fi ve days (two replicates/ sample; two samples/run; two runs/day) with a CV specifi cation limit of ≤ 15% stated by the manufacturer. Additionally, a between-day imprecision (CV) over 31 between-days was evaluated by analyzing one replicate of each QC sample per day. If results of the QC replicates were outside the specifi cation range, the samples were re-analyzed and both replicates included in the between-day imprecision calcu-lation. All three QC concentration levels over these 31 days had to be re-analyzed 14 times, thus, the between-day imprecision is reported with a total of 45 replicates per QC sample. Between-day CV of ≤ 15% was considered acceptable following the manufacturer ’ s recommen-dation. Similarly, a between-day inaccuracy (%bias) was evaluated applying a specifi cation limit of ± 15% [ 23 , 24 ].
Percentage recovery was assessed in 5-FU-free lithium-heparin plasma spiked at the following 5-FU concentrations: 250, 500, 1000, 1250, and 1600 ng/mL. Five replicates per sample were analyzed.
The percentage interference for compounds potentially present in plasma, i.e., lipids, bilirubin, protein, and rheumatoid factor, was assessed using the following procedure: Samples for intra-lipid (mean concentration of 1864 mg/dL), protein ( human immunoglobulin G; 12.5 g/dL), and rheumatoid factor (500 units/dL) testing were prepared by adding the respec-tive interferent or an appropriate control (i.e., saline or plasma) to a pooled plasma sample, which was spiked with 1200 ng/mL 5-FU, following the CLSI Guideline EP7-A2 [ 25 ]. Accordingly, fi ve anonymous routine samples with a mean bilirubin concentration of 100 μ mol/L were spiked with 1000 ng/mL 5-FU to assess the relative recovery of 5-FU compared to a control sample in presence of bilirubin. For interference, a specifi cation limit of ± 10% was defi ned by the manufacturer.
Sample carryover was assessed in one run with randomly dis-tributed replicates of two calibrator samples with low (n = 11) or high (n = 10) 5-FU concentration, 150 or 1800 ng/mL, respectively. Finally, the dilution integrity of plasma samples was evaluated up to 10-fold using water, zero calibrator standard, and 0.9% sodium chloride so-lution (B. Braun, Melsungen, Germany).
Method comparison
For method comparison, 247 human plasma samples were analyzed with the My5-FU immunoassay and an LC-MS/MS assay. Of these, a set of 50 samples was provided by Saladax Biomedical, whereas the rest of the samples were from cancer patients treated with 5-FU-based regimens at the Cantonal Hospital of St. Gallen. Samples con-taining 5-FU concentrations above the linear calibration range of the My5-FU assay were diluted up to 10-fold with water before analysis. Most of the LC-MS/MS analyses were performed as described earlier on a QTRAP ® 4000 linear ion trap quadrupole mass spectrometer (AB SCIEX, Darmstadt, Germany) [ 12 ]. A subset of samples was analyzed applying the same method with fi ne adjustments to a newer version of this LC-MS/MS system, i.e., a QTRAP 5500 (AB SCIEX). The specifi c MS/MS parameters can be requested from the authors. The results obtained on Cobas Integra 800 analyzer and LC-MS/MS for the sub-set of 50 samples were also compared to results obtained using the My5-FU assay on three other automated clinical analyzers, namely Olympus AU400, Roche Cobas c6000, and Thermo Fisher CDx90 (data provided by Saladax Biomedical).
For each method comparison (method 1 vs. method 2), results were compared using the Passing-Bablok regression analysis gen-erating a linear equation with calculated values for intercept and slope [ 26 ]. The intercept value represents a measure for potential systematic diff erences between methods. If the 95% confi dence in-terval (CI) of the intercept contains zero, methods show no evidence for a systematic diff erence. However, if the 95% CI does not include zero, a constant bias between the methods is present. Accordingly, if the 95% CI of the slope does not include one, a proportional bias between the methods is detected.
To test the validity of the linear model, the Passing-Bablok analysis includes a cumulative sum (Cusum) linearity test [ 26 ]. The threshold for rejecting the null hypothesis of a linear relationship was set to α = 10%. Correlation analysis was additionally performed for all method comparisons obtaining a squared Pearson correlation coeffi cient
(
2)
.
Pearson R
The degree of agreement between methods was further evalu-ated by using the Bland-Altman analysis, plotting the mean percent diff erence against the average of both methods [ 27 ].
The method comparison analyses were performed with the Analyse-it ® v2.20 soft ware add in for Microsoft ® Excel ™ (Microsoft Corporation, Redmond, WA, USA).
Results
Assay validation on Cobas Integra 800
The assay was found to be linear over the entire
concen-tration range of 5-FU (100 – 1750 ng/mL). Linearity was
described with the following linear regression
equa-tion: y
= 1.09 × x – 25.9. The CV of all concentration levels
was
≤ 3.7%, and the %bias was ≤ 7.4%.
The defined specification criteria were met for
impre-cision and inaccuracy. Within-run impreimpre-cision was tested
by analyzing 20 replicates of the low and the medium
QC sample and two pooled plasma samples spiked with
5-FU on two separate days. For QC samples, the
within-run CV ranged from 0.95% to 3.9% and for pooled plasma
samples from 0.65% to 2.2% ( Table 1 ), being within the
acceptable specification limit (
≤ 10%). The within-run
%bias for QC samples ranged from 4.8% to 7.4% and for
pooled samples from 2.2% to 8.6%, being also within the
specification criteria (
± 15%). Total CV (n = 40) for the low,
the medium, and the high QC concentration levels were
3.5%, 2.7%, and 1.4% (specification limit:
≤ 15%),
respec-tively. Similarly, between-day CVs (n
= 45) of 5.6%, 3.5%,
and 2.1% (specification limit:
≤ 15%) and %biases of 3.7%,
3.8%, and 2.4% (specification limit:
± 15%) were obtained
for the respective QC samples.
The percentage recovery for different 5-FU
concentra-tions ranged from 99% to 105% ( Table 2 ), and was thus
within the acceptable range (96% – 108%) given by the
manufacturer.
Low interference by bilirubin (
−
5%), total protein
(4%), and rheumatoid factor (
−
2%) was observed.
However, intra-lipids showed an interference of 11%.
Sample carryover was evaluated using randomly
dis-tributed replicates (n
= 21) of low and high 5-FU
calibra-tor samples (150 and 1800 ng/mL, respectively). Since a
CV of 2.6% and %bias of 7.4% was observed for the low
concentration sample, the preceding high concentration
sample had no influence on the low sample indicating the
absence of any carryover effects.
Finally, a 10-fold dilution of three clinical plasma
samples with water, zero calibrator standard or 0.9%
sodium chloride solution yielded an imprecision of
≤ 10%.
Method comparison
Of the 247 clinical samples analyzed for the method
com-parison, 107 (43%) contained 5-FU concentrations above
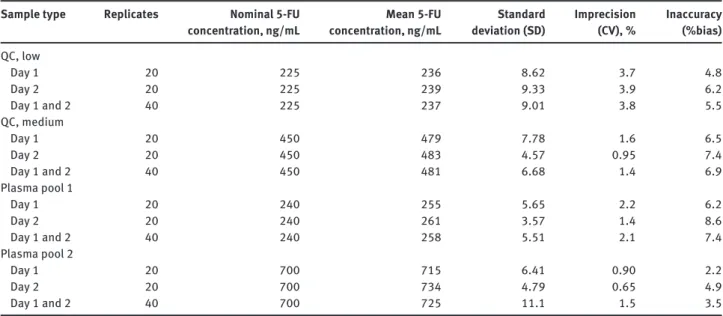
Table 1 Within-run imprecision and inaccuracy of quality control and two plasma pool samples spiked with 5-FU.
Sample type Replicates Nominal 5-FU concentration, ng/mL Mean 5-FU concentration, ng/mL Standard deviation (SD) Imprecision (CV), % Inaccuracy (%bias) QC, low Day 1 20 225 236 8.62 3.7 4.8 Day 2 20 225 239 9.33 3.9 6.2 Day 1 and 2 40 225 237 9.01 3.8 5.5 QC, medium Day 1 20 450 479 7.78 1.6 6.5 Day 2 20 450 483 4.57 0.95 7.4 Day 1 and 2 40 450 481 6.68 1.4 6.9 Plasma pool 1 Day 1 20 240 255 5.65 2.2 6.2 Day 2 20 240 261 3.57 1.4 8.6 Day 1 and 2 40 240 258 5.51 2.1 7.4 Plasma pool 2 Day 1 20 700 715 6.41 0.90 2.2 Day 2 20 700 734 4.79 0.65 4.9 Day 1 and 2 40 700 725 11.1 1.5 3.5
CV, coefficient of variation; QC, quality control.
Table 2 My5-FU assay recovery of 5-FU in lithium-heparin plasma at five different concentrations (n = 5).
Parameters 1 2 3 4 5
Nominal 5-FU concentration, ng/mL 250 500 1000 1250 1600 Mean 5-FU concentration, ng/mL 252 507 992 1309 1597 Standard deviation (SD) 3.0 3.8 6.1 11 18 Recovery, % 101 101 99.2 105 99.8 Imprecision (CV), % 1.2 0.76 0.62 0.83 1.1 Inaccuracy (%bias) 0.80 1.3 − 0.84 4.8 − 0.21 CV, coefficient of variation.
the linear calibration range (
> 1800 ng/mL) of the My5-FU
assay requiring up to 10-fold dilution. The 5-FU
concen-trations determined by LC-MS/MS showed a range from
102 to 18590 ng/mL with a median concentration of 1270
ng/mL. Similarly, the 5-FU concentrations obtained with
the My5-FU assay ranged from 93 to 17881 ng/mL with a
median concentration of 1342 ng/mL.
All method comparison statistics are shown in
Table 3
. The comparison between the My5-FU assay
on the Cobas Integra 800 analyzer and the LC-MS/MS
method yielded a
R
2Pearsonof 0.987. The Passing-Bablok
analysis of this comparison is shown in Figure 1 . A linear
equation of Cobas Integra 800 (ng/mL)
= 1.08 × LC-MS/
MS (ng/mL) – 3.96 (95% CI slope 1.06 – 1.09; 95% CI
inter-cept – 14.5 – 11.4) was obtained ( Table 3 ). The CI of the
slope indicated a proportional bias of 8% higher values
for the Cobas Integra 800 as compared to the LC-MS/
MS method. Accordingly, the Bland-Altman method
revealed a similar proportional bias of 7% between the
two methods ( Figure 2 ).
Method comparison estimates between the other
clinical analyzers and the Cobas Integra 800 are listed in
Table 3 . The performance of the My5-FU assay was
com-parable between the different instruments all showing a
2
Pearson
R
of
≥ 0.993. They all, however, revealed a similar
proportional bias with slightly higher values being
obtained with the Cobas Integra 800 analyzer. In addition,
a constant bias below the limit of detection (
< 52 ng/mL)
was observed between Cobas Integra 800 and all other
clinical analyzers.
Discussion
The My5-FU assay was successfully established on the
Cobas Integra 800 analyzer and results from the
analy-sis of 247 clinical samples showed good correlation with
LC-MS/MS. Compared to the previously published
valida-tion data on Olympus AU400 analyzer [ 20 ], we report very
similar imprecision characteristics: within-run CV of 3.9%
vs. 2%, and a total CV of 3.5% vs. 3.9%. Overall, the assay
validation criteria were met for linearity, precision,
accu-racy, recovery, sample carryover, and dilution integrity.
However, an interference of 11% was observed for
intra-lipids. This could be explained by a freezing effect, since
the interference was gradually increasing while the
sample was re-frozen and thawed between the analyses.
Although the assay has been validated for three
freeze-thaw cycles, it is recommended to keep plasma samples
at 4
° C until analysis, and freeze sample aliquots for longer
storage. Furthermore, the preanalytical handling of the
samples may have a great influence on the quality of the
results. Most importantly, the residual DPD enzyme
acti-vity in the sample needs to be inhibited immediately after
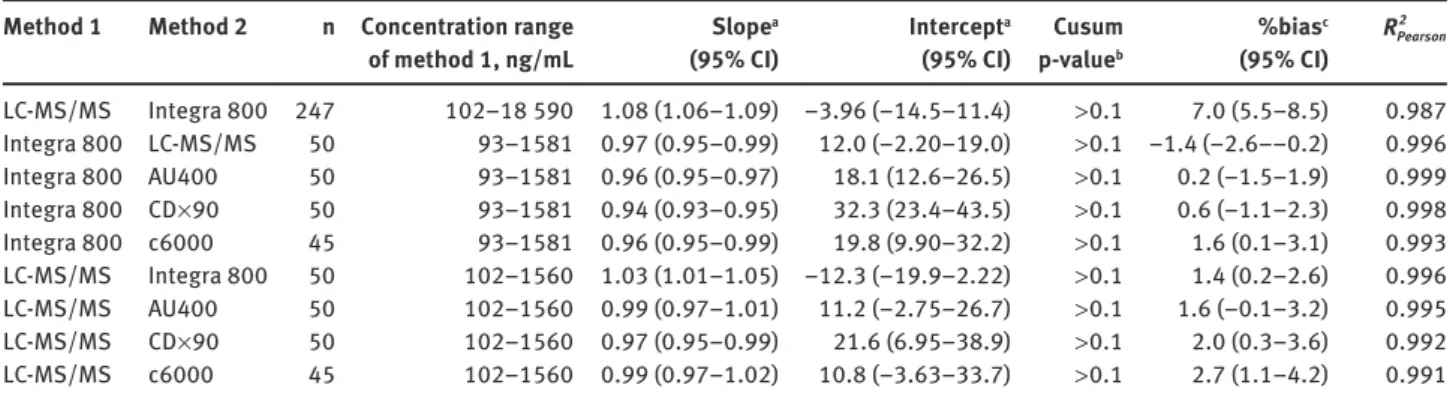
Table 3 Method comparison statistics.
Method 1 Method 2 n Concentration range of method 1, ng/mL Slope a (95% CI) Intercept a (95% CI) Cusum p-value b %bias c (95% CI) 2 Pearson R LC-MS/MS Integra 800 247 102 – 18 590 1.08 (1.06 – 1.09) − 3.96 ( − 14.5 – 11.4) > 0.1 7.0 (5.5 – 8.5) 0.987 Integra 800 LC-MS/MS 50 93 – 1581 0.97 (0.95 – 0.99) 12.0 ( − 2.20 – 19.0) > 0.1 − 1.4 ( − 2.6 – − 0.2) 0.996 Integra 800 AU400 50 93 – 1581 0.96 (0.95 – 0.97) 18.1 (12.6 – 26.5) > 0.1 0.2 ( − 1.5 – 1.9) 0.999 Integra 800 CD × 90 50 93 – 1581 0.94 (0.93 – 0.95) 32.3 (23.4 – 43.5) > 0.1 0.6 ( − 1.1 – 2.3) 0.998 Integra 800 c6000 45 93 – 1581 0.96 (0.95 – 0.99) 19.8 (9.90 – 32.2) > 0.1 1.6 (0.1 – 3.1) 0.993 LC-MS/MS Integra 800 50 102 – 1560 1.03 (1.01 – 1.05) − 12.3 ( − 19.9 – 2.22) > 0.1 1.4 (0.2 – 2.6) 0.996 LC-MS/MS AU400 50 102 – 1560 0.99 (0.97 – 1.01) 11.2 ( − 2.75 – 26.7) > 0.1 1.6 ( − 0.1 – 3.2) 0.995 LC-MS/MS CD × 90 50 102 – 1560 0.97 (0.95 – 0.99) 21.6 (6.95 – 38.9) > 0.1 2.0 (0.3 – 3.6) 0.992 LC-MS/MS c6000 45 102 – 1560 0.99 (0.97 – 1.02) 10.8 ( − 3.63 – 33.7) > 0.1 2.7 (1.1 – 4.2) 0.991
a Passing-Bablok regression parameter; b Cusum linearity test of Passing-Bablok fit; c Percentage of the mean difference according to Bland Altman. CI, confidence interval.
18,000 Cobas integra 800 (ng/mL)=1.08*LC-MS/MS (ng/mL)-3.96
Cobas integra 800,5-FU ng/mL
LC-MS/MS,5-FU ng/mL 16,000 14,000 12,000 10,000 8000 6000 4000 2000 0 18,000 16,000 14,000 12,000 10,000 8000 6000 4000 2000 0
Figure 1 Passing-Bablok analysis of the Cobas Integra 800 compared to LC-MS/MS (n = 247).
The black full line is the regression line and the two dashed lines show the 95% CI of its slope. The grey full line is the identity line (slope = 1).
blood drawing as it will lead to artificially lowered 5-FU
plasma concentrations, and thus, to the risk of missing
patients at high risk of toxicity due to elevated steady-state
5-FU levels. The inhibition of the residual enzyme activity
may be achieved by immediate cooling of the sample on
ice before plasma separation, or by adding a commercially
available stabilizer (provided by Saladax Biomedical) to
the sample.
The Passing-Bablok and Bland-Altman analyses
revealed a proportional bias towards higher values using
the My5-FU assay on the Cobas Integra 800 analyzer
compared to LC-MS/MS. Accordingly, slightly higher
con-centrations of 5-FU compared to the nominal
concentra-tions were generally observed for QC and spiked plasma
samples using the My5-FU assay ( Table 1 ). However, the
precision and the accuracy were within the acceptable
range and a positive bias of 7% would not lead to an
unin-tentional under-dosing of a patient who is on the optimal
AUC target level (22.5 mg
× h/L ± 11.1%). The apparent lack
of such a proportional bias in the comparisons between
the My5-FU assay on other clinical chemistry analyzers
and the LC-MS/MS assay may be largely explained by the
more than 10-fold extended range of concentration values
and the five-fold larger sample size that were included in
the comparison of the Cobas Integra 800 and LC-MS/MS
(93 – 18590 ng/mL vs. 93 – 1581 ng/mL; Table 3 ). Indeed, the
proportional bias in the comparison of the Cobas Integra
800 analyzer and LC-MS/MS is strongly reduced to 1.4%
if the same smaller set of samples is compared ( Table 3 ).
Since the standard infusional regimens, such as
FOLFOX, use an infusion time of 48 h, the optimal
steady-state levels are low (i.e., 417 – 521 ng/mL with the target
AUC of 20 – 25 mg
× h/L). Thus, the data included in the
additional method comparison series based on a subset
of samples (n
= 50) analyzed by using the Cobas Integra
800 and three other clinical chemistry analyzers in
addi-tion to LC-MS/MS, were within a clinical range of plasma
concentrations. Our results suggest that the performance
of the My5-FU assay on the different analyzers is highly
comparable ( Table 3 ). Compared to the LC-MS/MS assay,
only a small proportional bias and a constant bias below
the limit of detection (
< 52 ng/mL) were observed.
In conclusion, we have demonstrated that the
evalu-ated method is reliable for routine monitoring of 5-FU
plasma levels in cancer patients. We confirmed the assay
robustness on different analyzers commonly used in
clinical laboratories. Steady-state plasma concentration
levels of 5-FU are rapidly provided for physicians and the
patient ’ s treatment can be adjusted if necessary. This is
possible because standard 5-FU therapy regimen cycles
are biweekly, and delayed toxicity symptoms may occur
up to several days or weeks after the first cycle of therapy.
Monitoring 5-FU plasma levels may provide an effective
approach to improve efficacy and safety of commonly
used 5-FU-based therapies in cancer patients.
Acknowledgments: The My5-FU assay reagents,
calibra-tors, pooled plasma samples for validation, 50 clinical
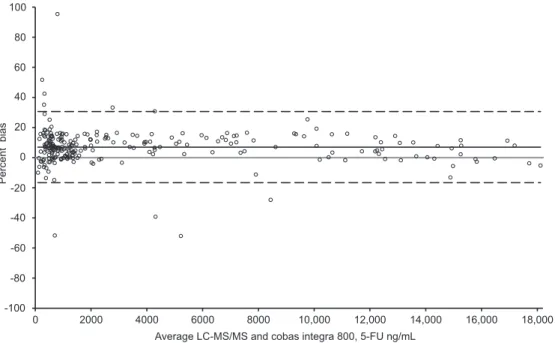
Average LC-MS/MS and cobas integra 800, 5-FU ng/mL
18,000 16,000 14,000 12,000 10,000 8000 6000 4000 2000 0 100 80 60 40 20 0 -20 -40 -60 -80 -100 Percent bias
Figure 2 Bland-Altman plot of the Cobas Integra 800 compared to LC-MS/MS.
The grey full line represents the identity line (i.e., full agreement between both methods), whereas the black full line indicates the bias between the methods. The two dashed lines show the 95% CI.
plasma samples, and data for a subset of samples (AU400,
CDx90, Cobas c6000) for method comparison were kindly
provided by Saladax Biomedical. We thank J. Dias and
U. Sonnenschein for their support in the My5-FU assay
evaluation and P. Rhyn and C. B ü hr for their expertise and
help with the LC-MS/MS analyses.
Conflict of interest statement
Authors
’
conflict of interest disclosure:
The authors
stated that there are no conflicts of interest regarding
the publication of this article. Research support played
no role in the analysis and interpretation of data, in the
writing of the report or in the decision to submit the report
for publication.
Research funding: Financial support for this study was
provided by a research grant from the Swiss National
Science Foundation (31003A_138285) to Carlo R. Largiad è r.
Employment or leadership: None declared.
Honorarium: None declared.
Received September 21, 2012; accepted January 21, 2013; previously published online February 14, 2013
References
1. Meyerhardt JA, Mayer RJ. Systemic therapy for colorectal cancer. N Engl J Med 2005;352:476 – 87.
2. Hendrayana T, Kurth V, Krolop L, Kenny P, Hilger RA,
Schmidt-Wolf IG, et al. Variability in fluorouracil exposure during continuous intravenous infusion. Int J Clin Pharmacol Ther 2012;50:82 – 4.
3. Ciccolini J, Mercier C, Evrard A, Dahan L, Boyer JC, Duffaud F, et al. A rapid and inexpensive method for anticipating severe toxicity to fluorouracil and fluorouracil-based chemotherapy. Ther Drug Monit 2006;28:678 – 85.
4. Felici A, Verweij J, Sparreboom A. Dosing strategies for anticancer drugs: the good, the bad and body-surface area. Eur J Cancer 2002;38:1677 – 84.
5. Saif MW, Choma A, Salamone SJ, Chu E. Pharmacokinetically guided dose adjustment of 5-fluorouracil: a rational approach to improving therapeutic outcomes. J Natl Cancer Inst 2009;101:1543 – 52.
6. Gamelin E, Boisdron-Celle M. Dose monitoring of 5-fluorouracil in patients with colorectal or head and neck cancer – status of the art. Crit Rev Oncol Hematol 1999;30:71 – 9.
7. Milano G, Etienne MC, Renee N, Thyss A, Schneider M, Ramaioli A, et al. Relationship between fluorouracil systemic exposure and tumor response and patient survival. J Clin Oncol 1994;12:1291 – 5.
8. Jodrell DI, Stewart M, Aird R, Knowles G, Bowman A, Wall L, et al. 5-fluorouracil steady state pharmacokinetics and outcome in patients receiving protracted venous infusion for advanced colorectal cancer. Br J Cancer 2001;84:600 – 3.
9. Di Paolo A, Lencioni M, Amatori F, Di Donato S, Bocci G, Orlandini C, et al. 5-fluorouracil pharmacokinetics predicts disease-free survival in patients administered adjuvant chemotherapy for colorectal cancer. Clin Cancer Res 2008;14:2749 – 55.
10. Gamelin E, Delva R, Jacob J, Merrouche Y, Raoul JL, Pezet D, et al. Individual fluorouracil dose adjustment based on pharma-cokinetic follow-up compared with conventional dosage: results of a multicenter randomized trial of patients with metastatic colorectal cancer. J Clin Oncol 2008;26:2099 – 105. 11. Capitain O, Asevoaia A, Boisdron-Celle M, Poirier AL, Morel
A, Gamelin E. Individual fluorouracil dose adjustment in FOLFOX based on pharmacokinetic follow-up compared with
conventional body-area-surface dosing: a phase II, proof-of-concept study. Clin Colorectal Cancer 2012;11:263 – 7. 12. B ü chel B, Rhyn P, Sch ü rch S, B ü hr C, Amstutz U, Largiader
CR. LC-MS/MS method for simultaneous analysis of uracil, 5,6-dihydrouracil, 5-fluorouracil and 5-fluoro-5,6-dihydrouracil in human plasma for therapeutic drug monitoring and toxicity prediction in cancer patients. Biomed Chromatogr 2013; 27:7 – 16.
13. Vainchtein LD, Rosing H, Schellens JH, Beijnen JH. A new, validated HPLC-MS/MS method for the simultaneous determination of the anti-cancer agent capecitabine and its metabolites: 5 ′ -deoxy-5-fluorocytidine, 5 ′ -deoxy-5-fluorouridine, 5-fluorouracil and 5-fluorodihydrouracil, in human plasma. Biomed Chromatogr 2010;24:374 – 86.
14. Peer CJ, McManus TJ, Hurwitz HI, Petros WP. Development and utilization of a combined LC-UV and LC-MS/MS method for the simultaneous analysis of tegafur and 5-fluorouracil in human plasma to support a phase I clinical study of oral UFT/ leucovorin. J Chromatogr B Analyt Technol Biomed Life Sci 2012;898:32 – 7.
15. Licea-Perez H, Wang S, Bowen C. Development of a sensitive and selective LC-MS/MS method for the determination of alpha-fluoro-beta-alanine, 5-fluorouracil and capecitabine in human plasma. J Chromatogr B Analyt Technol Biomed Life Sci 2009;877:1040 – 6.
16. Chen J, Zhou M. Determination of eniluracil and 5-fluorouracil in human plasma by LC-MS/MS. Bioanalysis 2010;2:2011 – 7. 17. Remaud G, Boisdron-Celle M, Morel A, Gamelin A. Sensitive
MS/MS-liquid chromatography assay for simultaneous determination of tegafur, 5-fluorouracil and 5-fluorodihyd-rouracil in plasma. J Chromatogr B Analyt Technol Biomed Life Sci 2005;824:153 – 60.
18. Kosovec JE, Egorin MJ, Gjurich S, Beumer JH. Quantitation of 5-fluorouracil (5-FU) in human plasma by liquid chroma-tography/electrospray ionization tandem mass spectrometry. Rapid Commun Mass Spectrom 2008;22:224 – 30.
19. Salamone SJ, Li Y, Courtney J, Harney R, Lundell G, Stocker D. 5-Fluorouracil determination in plasma by rapid nanoparticle immunoassay; highlights from 5-Fluorouracil Drug Management Pharmacokinetics and Pharmacogenomics Workshop. Clin Colorectal Cancer 2007;6:419 – 20.
20. Beumer JH, Boisdron-Celle M, Clarke W, Courtney JB, Egorin MJ, Gamelin E, et al. Multicenter evaluation of a novel nanoparticle immunoassay for 5-fluorouracil on the Olympus AU400 analyzer. Ther Drug Monit 2009;31:688 – 94.
21. Murphy RF, Balis FM, Poplack DG. Stability of 5-fluorouracil in whole blood and plasma. Clin Chem 1987;33:
2299 – 300.
22. National Committee for Clinical Laboratory Standards (NCCLS). Evaluation of the linearity of quantitative measurement procedures: a statistical approach; approved guideline. Wayne, PA, USA; 2003. NCCLS document EP6-A [ISBN 1-56238-498-8]. 23. European Medicines Agency (EMEA). Guideline on bioanaly tical
method validation. 2011. EMEA document: EMEA/CHMP/ EWP/192217/2009.
24. US Food and Drug Administration (FDA). Guidance for industry: bioanalytical method validation. Rockville, MD, USA; 2001. 25. Clinical and Laboratory Standards Institute (CLSI). Interference
testing in clinical chemistry; approved guideline, 2nd ed. Wayne, PA, USA; 2005. CLSI document EP7-A2 [ISBN 1-56238-584-4].
26. Passing H, Bablok W. A new biometrical procedure for testing the equality of measurements from two different analytical methods. Application of linear regression procedures for method comparison studies in clinical chemistry, Part I. J Clin Chem Clin Biochem 1983;21:709 – 20.
27. Bland JM, Altman DG. Statistical methods for assessing agreement between two methods of clinical measurement. Lancet 1986;1:307 – 10.