High resolution deletion analysis of constitutional DNA from neurofibromatosis type 2 (NF2) patients using microarray-CGH
12
0
0
Texte intégral
(2) 272. Human Molecular Genetics, 2001, Vol. 10, No. 3. genomic hybridization (CGH) on an array covering at least 90% of this region of 22q around the NF2 locus. Deletions, which remove one copy of the entire gene or are predicted to truncate the schwannomin protein, were detected in 8 severe, 10 moderate and 6 mild patients. This result does not support the correlation between the type of mutation affecting the NF2 gene and the disease phenotype. This work also demonstrates the general usefulness of the array-CGH methodology for rapid and comprehensive detection of small (down to 40 kb) heterozygous and/ or homozygous deletions occurring in constitutional or tumor-derived DNA. INTRODUCTION Neurofibromatosis type 2 (NF2) is an autosomal dominant disorder predisposing to neoplastic lesions with a hallmark of schwannoma arising at the vestibular branch of both eighth cranial nerves. NF2 affects ∼1 in 40 000 individuals and the penetrance is nearly 100% by the age of 60 years. NF2 patients may also develop schwannomas at other locations and other tumors such as meningiomas, ependymomas and astrocytomas (1–7). NF2 shows a phenotypic variability which ranges from mild (Gardner) to severe (Wishart) forms. The severe form has an early onset of vestibular schwannomas and patients usually present other tumors. The mild form usually has a late onset with bilateral vestibular schwannomas as the only feature. There are also intermediately affected cases, which do not easily fall into either category. The NF2 tumor suppressor gene was characterized from 22q12 (8,9). This gene has been extensively studied for presence of inactivating mutations in NF2 patients, with reported mutation frequencies ranging from 36 to 84% (7,10–14). Some mutation reports point to a correlation between the genotype and phenotype (7,13). Patients with truncating mutations usually, although not always, have a severe form of NF2. The more infrequent missense mutations occur in both mild and severe forms with no apparent correlation between the clinical form and the type of mutation (12). Furthermore, a majority of deletions affecting the whole NF2 gene so far reported occurred in patients with mild phenotype (14–16). Many of these NF2 patients with deletions are from NF2 kindreds with other similarly affected family members, which make somatic chimerism an unlikely explanation for the mild phenotype. Other studies also report NF2 pedigrees with a wide phenotypic spectrum within families. Mutation analyses of constitutionally transmitted mutations in these families have shown both protein truncating and missense mutations (11,17,18). Although the NF2 gene was cloned in 1993 and extensively studied, the telomeric border of the NF2 gene region, as defined by linkage analysis in NF2 families, is still very large. The delineation of the centromeric border of the NF2 region was the detection of a crossing-over between the NF2 gene and marker D22S212 in a family with severe phenotype (19). D22S212 is located at a distance of 540 kb from the NF2 gene. Despite a large set of NF2 kindreds included in the linkage analysis (19), D22S28 is the telomeric flanking marker and the. distance between the merlin/schwannomin gene and D22S28 is ∼6 Mb, which is a remarkably large region. The starting point for the current study was a description of an NF2 patient with early onset of the disease and an ∼6–7 Mb deletion in 22q12.1–q13 (denoted here as case JP) (20). When compared with deletions in other previously reported mild patients, the deletion in case JP extends at least 5 Mb towards the telomere of 22q (14–16). The purpose of this study was to examine the 6 Mb interval on 22q telomeric to the NF2 gene in a large series of NF2 patients in order to determine the frequency and extent of deletions. These were mapped using a microarray form of comparative genomic hybridization (CGH) (21–23). Genomic DNA from a ‘test’ and a ‘normal reference’ cell population were labeled with different fluorochromes and co-hybridized to an array of genomic clones that provided almost complete coverage of the vicinity of the NF2 locus. The resulting ratio of the fluorescence intensities on each array element is proportional to the copy number of the corresponding DNA sequences in the test and reference genomes. This approach can potentially detect copy number changes with a resolution finer than the length of the clone on the array, bringing a new dimension to CGH in terms of sensitivity of analysis (24). In total, 116 NF2 patients were analyzed and deletions were detected in 24 cases. Deletions in mild NF2 cases affected only the NF2 gene, whereas in severely/moderately affected patients they were often larger. RESULTS Preparation of the microarray As mentioned above, we had previously identified an earlyonset NF2 patient containing an ∼7 Mb deletion of chromosome 22 (20). The rationale of the current study was to use array-CGH with an array that provided a continuous coverage of this region for the analysis of a large series of NF2 patients. We used the March 1999 release of the chromosome 22 database (AceDB) from the Sanger Centre (Hinxton Hall, UK) for selection of genomic clones. This 7 Mb region was at that time not completely covered with a contiguous set of genomic clones. We originally selected 113 clones from the 7.4 Mb interval. However, nine clones were later excluded from the study as they did not yield a sufficient amount of DNA or could not be spotted in a reproducible manner on the hybridization slides by the printing robot. The overall coverage of the 7.4 Mb chromosome 22 interval, derived from 104 clones (clone nos 2–105) on the array, can be estimated to be 90% compared with the available GenBank sequence information. Regions that lack chromosome 22 sequences on the array are located between the following clones: 2 and 3, 3 and 4, 21 and 22, 27 and 28, 31 and 32, 55 and 56, 94 and 95 as well as 96 and 97. However, further analysis of details (in GenBank accession files) of the clones neighboring the above-mentioned gaps shows that only the unique sequence segments from each genomic clone are submitted to the database. The true left and right ends of the genomic clones are therefore often deeply extending into the neighboring ones. Thus, the presumed 90% coverage of the array within the 7.4 Mb region is an underestimate. To enhance the resolution of the area around and within the NF2 gene, six additional cosmids (nos 13–18) were selected from a cosmid contig covering the NF2 gene (25). These.
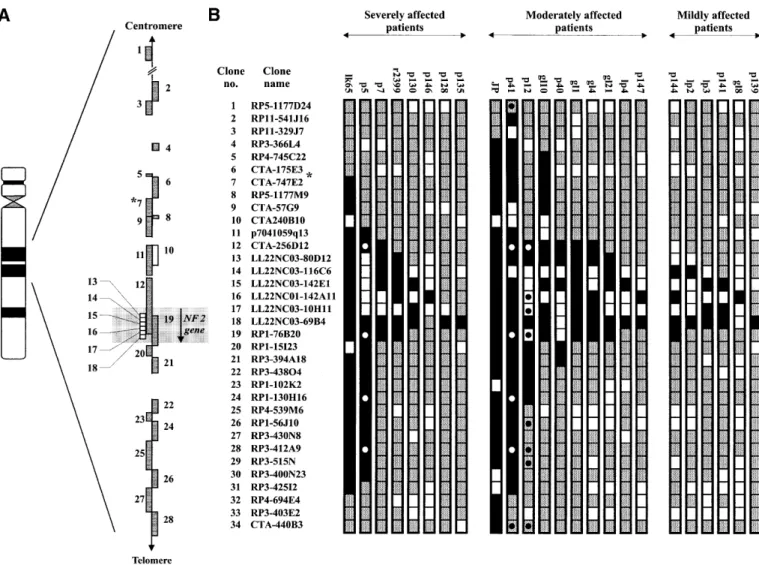
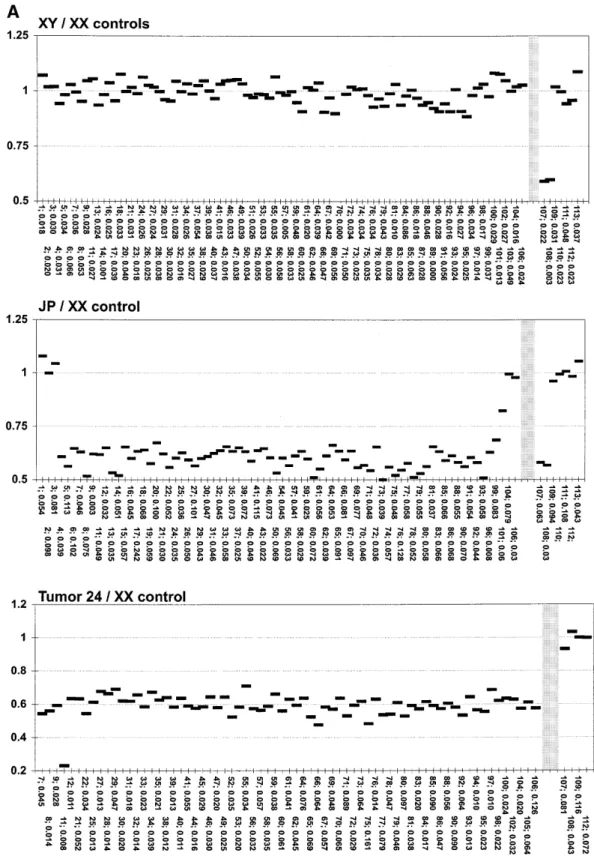
(3) Human Molecular Genetics, 2001, Vol. 10, No. 3. 273. Figure 1. Summary of the deletions detected by microarray-CGH. The region shown in (A) corresponds to one-third of the entire array. Gray boxes illustrate clones from the chromosome 22 minimal tiling path as previously reported (30). White boxes indicate additional clones included in the array in order to enhance its resolution within the NF2 gene region. Gaps in the contig represent sequences that are not present on the array. These gaps are shown to scale, except for the gap between clone nos 1 and 2. Clone no. 1 is located ∼10 Mb towards the centromere of clone no. 2. An asterisk (*) indicates the clone containing D22S212/KI-831, which determines the centromeric border of the NF2 region, previously established by linkage analysis of NF2 families using markers from chromosome 22 (19). A total of 24 NF2 patients with deletions, grouped according to their clinical phenotype, are shown in (B). Results from 34 genomic clones are displayed. The entire array contained 106 chromosome 22-derived clones. Gray boxes indicate clones classified as displaying retention of both copies of chromosome 22 and black boxes denote deletions. White boxes illustrate target clones which were non-conclusive in one or several independent hybridization experiments, i.e. were excluded from analysis due to printing failures, hybridization background or weak fluorescent signal from one or both fluorescent dyes (CY3 and FITC; see Materials and Methods). All 24 patients with deletions were analyzed in at least two independent hybridization experiments and the combined results are shown. Circles indicate clones that were used as probes for FISH analysis of three selected patients, in order to verify the results obtained from microarray-CGH (data not shown).. clones were identified by hybridization with probes for the 5′ and 3′ ends of the NF2 gene, as shown in Figure 1A. Validation of the array The ability to detect copy number changes using our microarray was tested in three experiments (Fig. 2). We hybridized (i) normal human male DNA against normal human female DNA to detect the variation in copy number of the X chromosome between male and female; (ii) an NF2 patient (case JP), known to contain an ∼7 Mb deletion within the area covered by the array (20); and (iii) meningioma tumor DNA from a female patient (tumor 24) with a known combination of homozygous and heterozygous deletions within the studied region (26). The normalized average ratio for the target clones on chromosome 22 was 0.99 ± 0.04 when normal female DNA. was hybridized against normal male DNA. The ratio for the two X chromosome controls was 0.59 ± 0.004 (Fig. 2, XY/XX controls), clearly distinguishing the X chromosome copy number difference between male and female. Heterozygous deletion detection was tested using the previously published case JP, which has a large interstitial deletion. The deletion in this patient spans from the marker D22S212 to the MB locus (20). This case was hybridized against normal human female DNA, and deletion between RP3-366L4/AL023494 (clone no. 4) and RP4-569D19/AL022334 (clone no. 101) was detected. The normalized average ratio for the deleted clones was 0.59 ± 0.05 and the size of the detected deletion corresponds well with our previous description of this case (Figs 1 and 2, JP/XX control) (20). Homozygous deletion detection was tested by analysis of tumor 24, a meningioma known to contain a heterozygous and.
(4) 274. Human Molecular Genetics, 2001, Vol. 10, No. 3. Figure 2. Six normalized microarray-CGH profiles of the entire array. These are normal XX/normal XY control experiment; case JP (male)/XX control; tumor 24 (from female patient)/XX control; case lk65 (male)/XX control; case p5 (male)/XX control; and case gl4 (female)/XX control. Individual clones are represented by ID numbers, corresponding to the numbering described in Materials and Methods. Nos 1–106 represent chromosome 22 clones. Nos 107–108, 109–112 and 113 represent control clones from chromosomes X, 3 and 5, respectively. Chromosome 22 clones are ordered in centromere (left) to telomere (right) direction. Each measurement is an average ratio between fluorescent signals and these are derived from three to five measurements of independent spots representing a clone on the array, in a single hybridization experiment. The standard deviation is shown below the ID number for each genomic clone..
(5) Human Molecular Genetics, 2001, Vol. 10, No. 3. 275. Figure 2. Continued a homozygous deletion. The large terminal deletion of one arm of chromosome 22 has the breakpoint between markers VIIIF2 and D22S212, which are located outside and on the centromeric side of the region covered by the array. The second interstitial deletion removes ∼100 kb around the marker D22S342 and the NEFH gene (26). The average normalized value of the. ratio for the heterozygously deleted clones was 0.60 ± 0.05. The normalized ratio for p7041059q13/AC002059 (clone no. 11) was 0.26 (Fig. 2, tumor 24/XX control). Clone no. 11 is known to contain marker D22S342 and the NEFH gene. The non-zero value for the ratio in the homozygously deleted region may be due to a normal tissue component in the tumor,.
(6) 276. Human Molecular Genetics, 2001, Vol. 10, No. 3. inefficient blocking of repetitive sequences with human Cot-1 DNA, autofluorescence of the target clones or that clone no. 11 is larger than the deletion. Localization of the borders of NF2 region on the sequence of chromosome 22 The centromeric border of the NF2 gene region was previously determined in linkage analysis by detection of a crossing-over between the NF2 gene and marker D22S212 in a family with severe phenotype (19). However, marker D22S212 has not yet been sequenced, which complicates its exact localization on the sequence of chromosome 22. Single-run sequences, generated after end-sequencing of both sides of the insert from marker D22S212, were used in blastn search against the non-redundant section of the GenBank database. Both end-sequences matched [488 identities in 512 letters (95%) and 317 identities in 321 letters (98%)] the sequence from clone CTA-747E2 (GenBank accession no. AL021393), between positions 20021 and 23045 (data not shown). This determines the location of marker D22S212 around position 22000 in sequence of clone CTA747E2 (Fig. 1 clone no. 7). Thus, the centromeric border of the NF2 region is 540 kb away from the 5′ end of the NF2 gene. Marker D22S28 was previously identified as the telomeric border of the NF2 region (19). Blastn analysis of the available sequence for this marker places it in clone RP1-272J12 (clone no. 95, GenBank accession no. Z82194). Thus, the size of the NF2 gene region, as defined by the linkage analysis in NF2 families, is ∼6.0 Mb. Analysis of deletions in NF2 patients A total of 116 NF2 patients were analyzed. Severe cases were included in the study disregarding the NF2 gene mutation status. Mild and moderate cases were included in the study only if they were known to be negative for point mutations in the NF2 gene. According to the above-mentioned clinical classification of NF2, 83 of the patients were severely affected, 16 were moderately affected and 17 had clearly mild manifestations. Two patients showed clinical features other than what is normally associated with NF2 (Table 1). Patient 41 has had a complex phenotype since early childhood with cerebral paresis, peripheral facial paresis, pes cavus, cerebral movement disorder, facial dysmorphism and slight mental retardation. At the age of 18, she showed the first symptoms of NF2 with bilateral hearing loss and at 28 she was diagnosed with bilateral vestibular schwannomas. This patient was classified as moderately affected in this study, with regard to the age of diagnosis. Another patient classified as moderately affected (p12) is also slightly mentally retarded and was diagnosed with NF2 at the age of 34. He displays cranial and spinal schwannomas, in addition to bilateral vestibular schwannomas. Array-CGH detected deletions in 8 severe, 10 moderate and 6 mild cases (Fig. 1B), which makes an overall 20.7% frequency of patients with deletions. The deletions in the severely affected group varied in size from 2.5 Mb to 40 kb (Fig. 1B). However, seven patients were reported previously, but the extent of the deletion outside the NF2 gene was not determined (Table 1). Thus, the overall deletion frequency for cases not previously analyzed is 15.6% (17 of 109). The largest detected deletion in this subgroup, lk65, has a deletion spanning CTA-747E2 (clone no. 7) to RP3-425I2 (clone no. 31). The. normalized average ratio for these clones was 0.59 ± 0.07, whereas the ratio for clones outside the deletion showed an average of 1.0 ± 0.06. The deleted area on the telomeric side of the NF2 gene, represented by clone nos 20–31, is ∼1.6 Mb. The deletion of p5 comprises the clones from p7041059q13 (clone no. 11) to RP3-400N23 (clone no. 30), with an average normalized ratio of 0.59 ± 0.06. The size of this deletion is ∼2.0 Mb, of which 1.4 Mb lies telomeric of the NF2 locus (clone nos 20–30). Cases p7–p135 in the severe group of patients had deletions ranging from ∼500 kb down to 40 kb, always encompassing the NF2 gene. The size of deletions could be determined in 9 of 10 patients with moderate phenotype. These ranged from 6.6 Mb for the previously reported case JP (20) to 120 kb for p147. The centromere border of the deletion detected in p41 lies between control clone from the t(11;22) constitutional translocation breakpoint region on 22q11 (RP5-1175D24, clone no. 1) and RP11-546J16 (clone no. 2). As this region is ∼10 Mb, the breakpoint and exact size of this deletion is still unknown (Figs 1 and 2). This is the largest new case with deletion detected in the material studied here. The deletion on the telomeric side of the NF2 locus extends to the clone RP3-425I2 (clone no. 31), spanning ∼1.6 Mb. The average normalized ratio for the deleted clones was 0.59 ± 0.04. Two other cases in the moderate subgroup showed deletions stretching outside the NF2 locus. Case p12 deletes ∼530 kb telomeric of the NF2 gene, whereas gl10 displays a loss of ∼560 kb centromeric to the NF2 locus (Fig. 1B). The deletion of case p40 spanned ∼640 kb, of which 147 kb stretched telomeric of the NF2 locus. The other deletions in this subgroup ranged from 500 to 120 kb, always encompassing the NF2 gene. Six deletions were found in patients with a clearly mild NF2 phenotype and none of these deletions extended outside the NF2 locus. Patient 139 is the only unaffected case in this study. He is an obligate NF2 carrier, having an affected brother as well as a 19-year-old son with unilateral vestibular schwannoma. This patient underwent cranial magnetic resonance imaging (MRI) in 1998, which showed no evidence of tumors within the skull. To our knowledge, this is the oldest (aged 54) reported obligate carrier without symptoms of NF2. Patient 139 shows deletion of the cosmid LL22NC03-69B4 (clone no. 18) (Fig. 3). This cosmid was previously mapped to the telomeric half of the NF2 gene (25). CGH hybridizations of all 24 cases displaying deletions were performed at least twice on different arrays. We also performed reverse labeling tests. Here, DNA from p5 and p12 were labeled with fluorescein– dCTP and normal XX control was labeled with CY3–dCTP. The same genomic clones displayed deletions (data not shown). A total of 67 of the severe cases, 8 of the moderate and 10 of the mild patients did not show any detectable deletions (data not shown). Fluorescence in situ hybridization (FISH) analysis In order to confirm the results obtained from the microarrayCGH, three patients (p5, p12 and p41) were analyzed by FISH using multiple probes (Fig. 1B). For case p5, we used probes from the clones CTA-256D12 (no. 12), RP1-76B20 (no. 19), RP1-130H16 (no. 24), RP3-412A9 (no. 28) and LL22NC03117B5 (no. 49). All clones but LL22NC03-117B5 (no. 49) were deleted, in agreement with the results obtained by micro-.
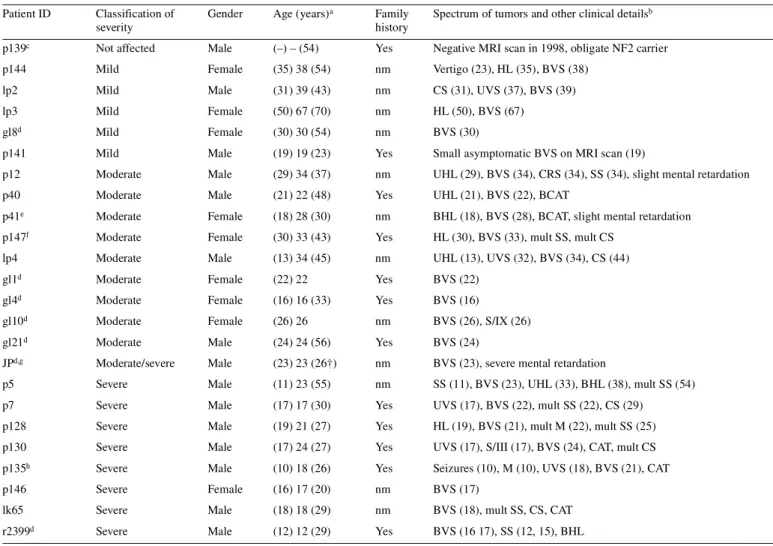
(7) Human Molecular Genetics, 2001, Vol. 10, No. 3. 277. Table 1. Clinical details of NF2 patients which display deletions on chromosome 22 Patient ID. Classification of severity. Gender. Age (years) a. Family history. Spectrum of tumors and other clinical detailsb. p139c. Not affected. Male. (–) – (54). Yes. Negative MRI scan in 1998, obligate NF2 carrier. p144. Mild. Female. (35) 38 (54). nm. Vertigo (23), HL (35), BVS (38). lp2. Mild. Male. (31) 39 (43). nm. CS (31), UVS (37), BVS (39). lp3. Mild. Female. (50) 67 (70). nm. HL (50), BVS (67). gl8d. Mild. Female. (30) 30 (54). nm. BVS (30). p141. Mild. Male. (19) 19 (23). Yes. Small asymptomatic BVS on MRI scan (19). p12. Moderate. Male. (29) 34 (37). nm. UHL (29), BVS (34), CRS (34), SS (34), slight mental retardation. p40. Moderate. Male. (21) 22 (48). Yes. UHL (21), BVS (22), BCAT. p41e. Moderate. Female. (18) 28 (30). nm. BHL (18), BVS (28), BCAT, slight mental retardation. p147f. Moderate. Female. (30) 33 (43). Yes. HL (30), BVS (33), mult SS, mult CS. lp4. Moderate. Male. (13) 34 (45). nm. UHL (13), UVS (32), BVS (34), CS (44). gl1d. Moderate. Female. (22) 22. Yes. BVS (22). gl4d. Moderate. Female. (16) 16 (33). Yes. BVS (16). gl10d. Moderate. Female. (26) 26. nm. BVS (26), S/IX (26). gl21d. Moderate. Male. (24) 24 (56). Yes. BVS (24). JPd,g. Moderate/severe. Male. (23) 23 (26†). nm. BVS (23), severe mental retardation. p5. Severe. Male. (11) 23 (55). nm. SS (11), BVS (23), UHL (33), BHL (38), mult SS (54). p7. Severe. Male. (17) 17 (30). Yes. UVS (17), BVS (22), mult SS (22), CS (29). p128. Severe. Male. (19) 21 (27). Yes. HL (19), BVS (21), mult M (22), mult SS (25). p130. Severe. Male. (17) 24 (27). Yes. UVS (17), S/III (17), BVS (24), CAT, mult CS. p135h. Severe. Male. (10) 18 (26). Yes. Seizures (10), M (10), UVS (18), BVS (21), CAT. p146. Severe. Female. (16) 17 (20). nm. BVS (17). lk65. Severe. Male. (18) 18 (29). nm. BVS (18), mult SS, CS, CAT. r2399d. Severe. Male. (12) 12 (29). Yes. BVS (16 17), SS (12, 15), BHL. BCAT, bilateral cataract; BHL, bilateral hearing loss; BVS, bilateral vestibular schwannoma; CAT, cataract; CRS, cranial schwannoma; CS, cutaneous schwannoma; HL, hearing loss; M, meningioma; mult, multiple; nm, new mutation; S/III, schwannoma of the third cranial nerve; S/IX, schwannoma of the ninth cranial nerve; SS, spinal schwannoma; UHL, unilateral hearing loss; UVS, unilateral vestibular schwannoma. aNumbers not in parentheses denote age at the ‘confirmed’ NF2 diagnosis. Numbers in parentheses on the right- and left-hand sides show age at the first symptoms of NF2 and current age of the patient (if known), respectively. bNumbers in parentheses indicate the age in years at diagnosis and/or surgical intervention. cThe younger brother of p139, now aged 52, has been diagnosed with right and left vestibular schwannoma at the age of 34 and 47 years, respectively. The son of p139, now aged 27, has been diagnosed with UVS at the age of 19. dThese cases were reported previously, but the extent of the deletion outside the NF2 gene was not determined (9,14,20). Classification of disease gravity was performed as described in Materials and Methods. eCase p41 had a complex phenotype since early childhood; slight mental retardation, cerebral paresis, peripheral facial paresis, pes cavus, cerebral movement disorder and facial dysmorphism. fCase 147, although moderately affected, comes from a family with very mild symptoms. All other affected family members have BVS only, with onset well after 30 years of age. gCase JP died 3 years after the surgery of left vestibular schwannoma. hCase p135 is an exception for his family. Other affected family members are mildly affected with usual onset of symptoms after 25 years.. array-CGH. For patient 12 we used a total of 17 probes, of which six were not included on the array. The analyzed clones were: CTA-256D12 (no. 12), LL22NC01-142A11 (no. 16), LL22NC03-10H11 (no. 17), RP1-76B20 (no. 19), RP1130H16 (no. 24), RP1-56J10 (no. 26), RP3-412A9 (no. 28), RP3-515N (no. 29), CTA-440B3 (no. 34), LL22NC03-117B5 (no. 49), CTA-766E1 (no. 55), LL22CN03-13H10, LL22CN01-110C7, LL22CN03-82A6, LL22CN03-126D5,. LL22NC03-37F10 and CTA-489D1. One copy was detected for clone nos 12, 16, 17 and 19. The other clones were retained in double copies as expected. The above-mentioned clones, without a number in parentheses following the clone name, were not present on the array. Patient 41 was analyzed with RP5-1177D24 (no. 1), CTA-256D12 (no. 12), RP1-76B20 (no. 19), RP1-130H16 (no. 24), RP3-412A9 (no. 28) and LL22NC03-117B5 (no. 49). Deletions were detected for the.
(8) 278. Human Molecular Genetics, 2001, Vol. 10, No. 3. Figure 3. Normalized microarray-CGH profile of a part of the array, obtained after hybridization of DNA from patient 139 (male) and normal XX control. Individual genomic clones are represented by ID numbers, corresponding to the numbering described in Materials and Methods. Nos 107–108 and 110–112 represent control clones from chromosomes X and 3, respectively. Chromosome 22 clones are ordered in centromere (left) to telomere (right) direction. Each measurement is an average ratio between fluorescence signals and these are derived from three to five measurements of independent spots representing a clone on the array, in a single hybridization experiment. The standard deviation is shown below the ID number for each genomic clone. The cosmid LL22NC03-69B4 (clone no. 18) was classified as deleted. Patient 139 is not affected but is an obligate NF2 carrier (see Table 1).. clones CTA-256D12 (no. 12), RP1-76B20 (no. 19), RP1130H16 (no. 24) and RP3-412A9 (no. 28), also in agreement with the array-CGH results. DISCUSSION This is the first report describing a high resolution microarrayCGH analysis in NF2 patients. The study was initiated by the finding of a large constitutional deletion removing ∼7 Mb on chromosome 22 in an early-onset NF2 patient (20). We constructed a genomic array covering at least 90% of the 7.4 Mb region of interest (clone nos 2–105). The interval studied fully incorporates the NF2 gene region delimited by the previous linkage studies in affected families. We analyzed 116 NF2 patients with different clinical phenotypes. Our results indicate a high frequency of large chromosome 22 deletions occurring in the pathogenesis of NF2. Findings of deletions encompassing the NF2 gene in patients with a wide range of clinical symptoms do not support the correlation between the type of mutation affecting the NF2 gene and the disease phenotype. It should also be noted that deletions in severely and moderately affected patients varied in size, whereas cases with mild NF2 displayed only deletions affecting the NF2 locus. Somatic mosaicism for NF2 gene mutations has been shown to occur in NF2 and it has been suggested as a possible cause of mild phenotype in a fraction of patients (27–29). Mosaicism should therefore always be considered as a possible explanation to the mild phenotype. Six of the patients with NF2 gene deletions studied here displayed mild phenotypes. However, two of them were familial cases (p139 and p141), making somatic mosaicism a very unlikely. explanation for the observed mild phenotype. Furthermore, the array-CGH results provide no support of somatic mosaicism, at least in DNA derived from blood leukocytes, in the remaining five mild, de novo mutation patients with deletions. The fluorescence intensity ratios show no clear deviation from the values expected for deleted clones on the array (p144, lp2, lp3, lp4, gl8; Table 1, Fig. 3 and data not shown). Microarray-CGH offers a considerable advantage compared with other existing methods used for analysis of gene copy variations. As shown here, it is a comprehensive, sensitive and fast method. Each hybridization experiment on our array can be compared with >100 independent FISH hybridizations. A single experiment allows for detection and sizing of a deletion, with a detection limit of ∼40 kb. It is also possible to increase the size of the region targeted on the array by addition of new genomic clones. The sensitivity of deletion detection can also be increased by supplementing the array with a larger number of overlapping, smaller-size genomic clones, e.g. cosmids. This study and a recent mutation analysis of the NF2 gene (14) indicated that deletions in the NF2 gene are one of the major pathogenic mechanisms behind this disease. Current diagnostic procedures for detection of intragenic deletions are, however, cumbersome. A high-resolution NF2 gene-specific microarray, containing a large number of overlapping cosmids, which are well mapped on the genomic sequence of the NF2 gene, offers a possibility for significant improvements of diagnostic procedures for NF2. Finally, our analysis of the meningioma case (tumor 24), which contains an ∼100 kb homozygous deletion, demonstrates the general usefulness of microarray-CGH methodology for detection of homozygous deletions in tumors. Many regions in the human genome, including chromosome 22, are known to contain as yet uncharacterized tumor suppressor loci. Detailed mapping of these loci is often difficult using existing methods. The microarray-CGH seems well suited for this purpose, especially for chromosomes that are physically and transcriptionally well characterized, such as human chromosome 22 (30). MATERIALS AND METHODS Collection and clinical classification of NF2 patients Patient DNA from 116 NF2 cases was collected in collaboration with physicians from Bulgaria, Canada, Finland, France, Germany, Italy, Japan, Norway, Sweden, Switzerland, the UK and the USA. So-called ‘confirmed NF2 diagnosis’ criteria were used according to the 1988 NIH consensus conference (31). The patients were categorized into mild, moderate and severe forms of NF2 as previously suggested by Evans et al. (2–4,7). These criteria are as follows. (i) Mild NF2 is characterized by relatively late onset, usually at >25 years, of bilateral schwannomas, with only minimal skin manifestations and usually no other central nervous system tumors. The progression of the tumors in mild NF2 patients is slow. (ii) Severe NF2 is characterized by early onset, usually at <25 years, and other tumors in addition to bilateral vestibular schwannomas. Peripheral features are more pronounced in severe cases. The disease course is often rapid, causing death or severe handicap (7). Patients that did not unequivocally match either the mild or the severe form were classified as moderate (Table 1). The use of DNA material derived from human subjects has been.
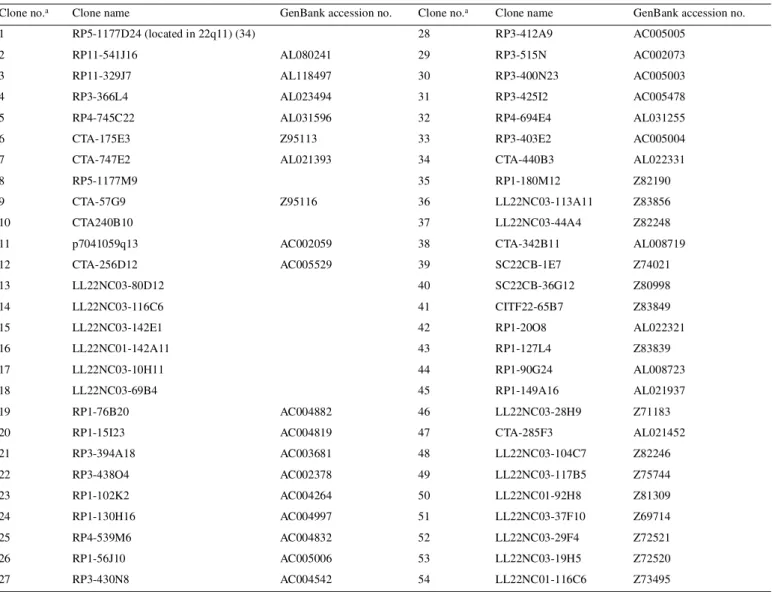
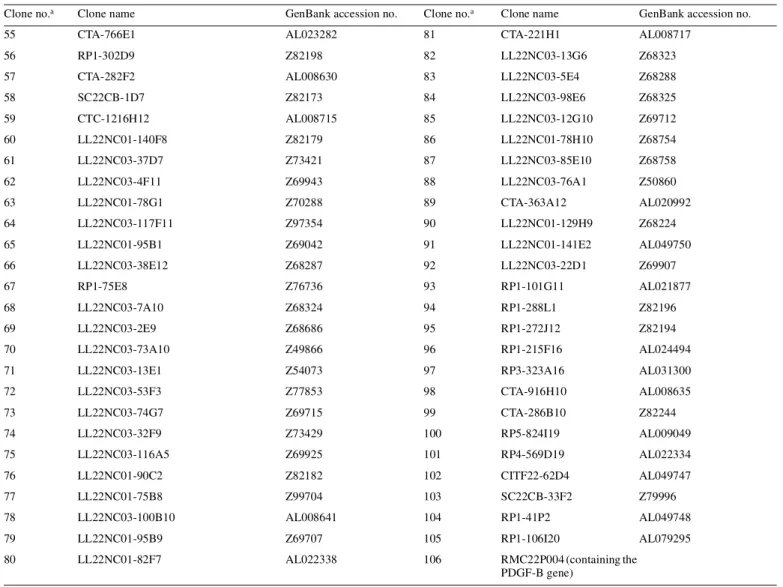
(9) Human Molecular Genetics, 2001, Vol. 10, No. 3. 279. Table 2. Chromosome 22 clones on the array, in centromere→telomere order Clone no.a. Clone name. GenBank accession no.. Clone no.a. 1. RP5-1177D24 (located in 22q11) (34). 2. RP11-541J16. 28. RP3-412A9. AC005005. AL080241. 29. RP3-515N. AC002073. 3. RP11-329J7. AL118497. 30. RP3-400N23. AC005003. 4. RP3-366L4. AL023494. 31. RP3-425I2. AC005478. 5. RP4-745C22. AL031596. 32. RP4-694E4. AL031255. 6. CTA-175E3. Z95113. 33. RP3-403E2. AC005004. 7. CTA-747E2. AL021393. 8. RP5-1177M9. 9. CTA-57G9. 10. CTA240B10. 11. p7041059q13. 12. CTA-256D12. 13 14. Clone name. GenBank accession no.. 34. CTA-440B3. AL022331. 35. RP1-180M12. Z82190. 36. LL22NC03-113A11. Z83856. 37. LL22NC03-44A4. Z82248. AC002059. 38. CTA-342B11. AL008719. AC005529. 39. SC22CB-1E7. Z74021. LL22NC03-80D12. 40. SC22CB-36G12. Z80998. LL22NC03-116C6. 41. CITF22-65B7. Z83849. 15. LL22NC03-142E1. 42. RP1-20O8. AL022321. 16. LL22NC01-142A11. 43. RP1-127L4. Z83839. 17. LL22NC03-10H11. 44. RP1-90G24. AL008723. 18. LL22NC03-69B4. 45. RP1-149A16. AL021937. 19. RP1-76B20. AC004882. 46. LL22NC03-28H9. Z71183. 20. RP1-15I23. AC004819. 47. CTA-285F3. AL021452. 21. RP3-394A18. AC003681. 48. LL22NC03-104C7. Z82246. 22. RP3-438O4. AC002378. 49. LL22NC03-117B5. Z75744. 23. RP1-102K2. AC004264. 50. LL22NC01-92H8. Z81309. 24. RP1-130H16. AC004997. 51. LL22NC03-37F10. Z69714. 25. RP4-539M6. AC004832. 52. LL22NC03-29F4. Z72521. 26. RP1-56J10. AC005006. 53. LL22NC03-19H5. Z72520. 27. RP3-430N8. AC004542. 54. LL22NC01-116C6. Z73495. Z95116. approved by the Karolinska Hospital and the Uppsala University Research Ethics Committees (Institutional Review Board). Selection and preparation of genomic target clones A total of 104 chromosome 22 clones which provided at least 90% coverage of a 7.4 Mb region, including and immediately distal to the NF2 gene, were used on the array. The selection was based on the March 1999 release of the chromosome 22 database (AceDB) from the Sanger Centre ( ftp:// ftp.sanger.ac.uk/pub/human/chr22 ). Six of the clones were cosmids covering the NF2 gene (25) and these were included to enhance the resolution within the NF2 locus. Two additional chromosome 22 control clones located outside the 7.4 Mb region were included on the array. These were RP5-1177D24 and RM22P004, which cover a part of the t(11;22) constitutional translocation breakpoint region in 22q11 and the PDGFB gene in 22q13, respectively. In addition, we included control clones from chromosome 3 (4 clones), chromosome 5 (1 clone) and chromosome X (2 clones). The identity of each. clone was verified by PCR amplification using known or newly designed sequence tagged sites, prior to isolation of DNA (data not shown). The clones included on the array are listed in Table 2 and below. The chromosome 22 clones are as listed in Table 2 in centromere→telomere order. The clones used as controls were as follows (numbers in parentheses correspond to those used for clone identification in Figures 1–3): 689C14 (no. 107) and 590B9 (no. 108) from the X chromosome (23); RP11-129K01 (no. 109), RP11-88M01 (no. 110), RP11-204C23 (no. 111) and RP11-72E23 (no. 112) from chromosome 3; and RP1194J21 (no. 113) from chromosome 5. Isolation of DNA from clones was performed using a CsCl gradient ultracentrifugation or a modified Qiagen midi preparation protocol (23,32). Preparation of the array and hybridization experiments Array production, hybridization and analysis followed Pinkel et al. (23). Briefly, the slides were cleaned in 1:1 H2SO4 (CONS) and H2O2 (30%) solution overnight. They were then.
(10) 280. Human Molecular Genetics, 2001, Vol. 10, No. 3. Table 2. Continued. Clone no.a. Clone name. GenBank accession no.. Clone no.a. Clone name. 55. CTA-766E1. AL023282. 81. CTA-221H1. AL008717. 56. RP1-302D9. Z82198. 82. LL22NC03-13G6. Z68323. 57. CTA-282F2. AL008630. 83. LL22NC03-5E4. Z68288. 58. SC22CB-1D7. Z82173. 84. LL22NC03-98E6. Z68325. 59. CTC-1216H12. AL008715. 85. LL22NC03-12G10. Z69712. 60. LL22NC01-140F8. Z82179. 86. LL22NC01-78H10. Z68754. 61. LL22NC03-37D7. Z73421. 87. LL22NC03-85E10. Z68758. 62. LL22NC03-4F11. Z69943. 88. LL22NC03-76A1. Z50860. 63. LL22NC01-78G1. Z70288. 89. CTA-363A12. AL020992. 64. LL22NC03-117F11. Z97354. 90. LL22NC01-129H9. Z68224. 65. LL22NC01-95B1. Z69042. 91. LL22NC01-141E2. AL049750. 66. LL22NC03-38E12. Z68287. 92. LL22NC03-22D1. Z69907. 67. RP1-75E8. Z76736. 93. RP1-101G11. AL021877. 68. LL22NC03-7A10. Z68324. 94. RP1-288L1. Z82196. 69. LL22NC03-2E9. Z68686. 95. RP1-272J12. Z82194. 70. LL22NC03-73A10. Z49866. 96. RP1-215F16. AL024494. 71. LL22NC03-13E1. Z54073. 97. RP3-323A16. AL031300. 72. LL22NC03-53F3. Z77853. 98. CTA-916H10. AL008635. 73. LL22NC03-74G7. Z69715. 99. CTA-286B10. Z82244. 74. LL22NC03-32F9. Z73429. 100. RP5-824I19. AL009049. 75. LL22NC03-116A5. Z69925. 101. RP4-569D19. AL022334. 76. LL22NC01-90C2. Z82182. 102. CITF22-62D4. AL049747. 77. LL22NC01-75B8. Z99704. 103. SC22CB-33F2. Z79996. 78. LL22NC03-100B10. AL008641. 104. RP1-41P2. AL049748. 79. LL22NC01-95B9. Z69707. 105. RP1-106I20. AL079295. 80. LL22NC01-82F7. AL022338. 106. RMC22P004 (containing the PDGF-B gene). aCorresponds. GenBank accession no.. to numbers used for clone identification in Figures 1–4.. thoroughly rinsed in water, air-dried and immersed in 95% acetone/water with 0.1% 3-aminopropyltrimethoxysilane (Aldrich) for 2 min at room temperature, followed by rinsing five times in acetone. Target DNA (10–15 µg) was sonicated into 1.5–15 kb fragments, ethanol-precipitated and resuspended in 5 µl of 80% DMSO with 0.4 ng/µl nitrocellulose. These DNA solutions were then printed onto the aminosilanecoated microscope slide using a custom-made robot. Two arrays per slide were printed with five replicas of each target clone. Test and reference DNA (1.25 µg) was labeled by nicktranslation with CY3–dCTP (PA 53021; Amersham Pharmacia Biotech) and fluorescein–dCTP (NEL424; NEN Life Science Products), respectively. Unincorporated nucleotides were removed using a Sephadex G50 spin column (Amersham Pharmacia Biotech). The labeled DNA was mixed with ∼50 µg of Cot-1 DNA (Life Technologies) and ethanol-precipitated, rinsed in 70% ethanol and air-dried. The precipitated DNA was dissolved in 15 µl of hybridization mix containing 50% formamide, 10% dextran sulfate, 2× SSC, 0.1% SDS and 0.1% Tween. The hybridization mix was then heated to 72°C for 10 min. to denature the DNA and incubated at 37°C for 30–60 min to achieve proper blocking of repetitive sequences. For prehybridization of the array, we precipitated 100 µg of salmon sperm DNA (Life Technologies) and dissolved this in 15 µl of the hybridization mix (10% dextran sulfate, 50% formamide, 2× SSC, 0.2% SDS, 0.2% Tween). A well for the prehybridization and hybridization mix was made with rubber cement. The prehybridization mix was later applied to this well. To prevent the prehybridization and hybridization solutions from drying, we placed a 2 mm rubber gasket (Grace Bio-Labs) outside the rubber cement wall and sealed the created hybridization chamber with a new microscope slide. After 30 min prehybridization of the array, ∼10 µl of the prehybridization mix was removed and hybridization solution was applied on the slide. The chamber was sealed again and incubated at 37°C for 16 h. After hybridization, we rinsed the array with 0.1 M sodium phosphate buffer with 0.1% NP-40 pH 8.0 to wash away the hybridization solution. The slides were then washed in 50% formamide, 2× SSC and 0.1% SDS at 45°C for 20 min followed by a 15 min wash in the 0.1 M sodium phosphate.
(11) Human Molecular Genetics, 2001, Vol. 10, No. 3. buffer with 0.1% NP-40. After draining excess liquid, the slide array was mounted in an antifade solution containing DAPI (1 µM) to counterstain the DNA targets. A glass coverslip was sealed in place with nail polish, and the slide was wiped with a lens clean paper soaked in 50% acetone/50% methanol to remove fluorescent debris and films. Imaging and analysis Imaging was performed essentially as described, but employing custom-made lenses that provide a 2× magnified image of the array onto a 16-bit cooled charge device (CCD) camera (23). The CCD camera (Pixelvision SV10KV1D/ PUYT-95; Pixelvision) contains a 25 mm2 chip with 1024 × 1024 pixels. Thus, each image covers a 12.5 × 12.5 mm area with a resolution of 12.5 µm. Illumination was supplied by a 100 W mercury arc lamp. Computer-controlled filter wheels allowed selection of excitation and emission wavelengths (five each). For this project DAPI, fluorescein and CY3 images of each array were obtained using exposure times of 4, 11–28 and 6–9 s, respectively. Hybridization intensity analysis of the images was carried out using a custom program. The program locates the targets clones, based on the DAPI image, subtracts background and calculates the intensities of the FITC and CY3 signals. Hybridization targets with less intensity than 70 digital units for either of the probes were excluded from the analysis. Ratios of the intensities of test DNA to the reference DNA were calculated as well as the average and standard deviation of the five replicas of each clone. Clones displaying standard deviation of >10% were discarded from further analysis. The ratio of the chromosome 22 target clones was normalized against the ratio of the target clones from chromosomes 3 and 5 and plotted as graphs (Figs 2 and 3). FISH analysis FISH analysis was performed as described elsewhere (33). Briefly, metaphase spreads were prepared from lymphocytes according to standard methods. DNA from the chromosome 22 probes (1 µg) was labeled with fluorescein-12-dUTP (Roche Diagnostics) by nick-translation. The centromere probe was labeled with SpectrumOrange–dUTP (Vysis). The probes were blocked with Cot-1 DNA (Life Technologies) and hybridized at 37°C overnight. The chromosomes were counterstained with DAPI and the signal was visualized using a Zeiss Axiophot II fluorescence microscope equipped with a CCD camera (Sensys; Photometrics) and the SmartCapture software package (Vysis). Partial sequencing of marker D22S212/KI-831 The insert of genomic marker D22S212/KI-831 was endsequenced from both sides using vector-specific primers, which flank the HindIII cloning site of the phage Charon 21A (primer 1, 5′-TCA CTT CGA CAG AAG AGT TAG TTG-3′; primer 2, 5′-CCT TTA AAA AAG TCG TTT CTG CA-3′). Purified phage DNA (∼500 ng), 3.2 pmol of either of the primers and 2 µl of BigDye terminator sequencing kit was PCR amplified using protocol supplied by the manufacturer and sequenced on an ABI377 automated sequencer (Perkin Elmer).. 281. ACKNOWLEDGEMENTS We would like to thank the chromosome 22 mapping and sequencing teams from the Sanger Centre, UK, for unpublished information from the chromosome 22 database (AceDB), Dr Danita Pearson for rapid shipments of a majority of genomic clones used in this study and Drs Ian Dunham, Ulf G. Pettersson, Koichi Ichimura, Anna Wedell and Magnus Nordenskjöld for critical review of the manuscript. This work was supported by grants from the Swedish Cancer Foundation, the Swedish Medical Research Council, the Cancer Society in Stockholm, the Berth von Kantzow Fund, the Fernström Foundation, Karolinska Hospital, Karolinska Institutet and the US Army Medical Research and Materiel Command, award no. DAMD17-00-1-0536 to J.P.D.; grants from the International Union Against Cancer, the Swedish Medical Research Council and the Blanceflor Boncompagni Ludovisi Född Bildt Foundation to C.E.G.B.; and grants from the US National Institute of Health (HD17665 and CA84030) to D.P. REFERENCES 1. Martuza, R.L. and Eldridge, R. (1988) Neurofibromatosis 2 (bilateral acoustic neurofibromatosis). N. Engl. J. Med., 318, 684–688. 2. Evans, D.G.R., Huson, S.M., Donnai, D., Neary, W., Blair, V., Newton, V., Strachan, T. and Harris, R. (1992) A genetic study of type 2 neurofibromatosis in the United Kingdom. II. Guidelines for genetic counselling. J. Med. Genet., 29, 847–852. 3. Evans, D.G.R., Huson, M., Donnai, D., Neary, W., Blair, V., Newton, V. and Harris, R. (1992) A clinical study of type 2 neurofibromatosis. Q. J. Med., 84, 603–618. 4. Evans, D.G.R., Huson, S.M., Donnai, D., Neary, W., Blair, V., Teare, D., Newton, V., Strachan, T., Ramsden, R. and Harris, R. (1992) A genetic study of type 2 neurofibromatosis in the United Kingdom. I. Prevalence, mutation rate, fitness, and confirmation of maternal transmission effect on severity. J. Med. Genet., 29, 841–846. 5. Mautner, V.F., Tatagiba, M., Guthoff, R., Samii, M. and Pulst, S.M. (1993) Neurofibromatosis 2 in the pediatric age group. Neurosurgery, 33, 92–96. 6. Parry, D.M., Eldridge, R., Kaiser-Kupfer, M., Bouzas, E.A., Pikus, A. and Patronas, N. (1994) Neurofibromatosis 2 (NF2): clinical characteristics of 63 affected individuals and clinical evidence for heterogeneity. Am. J. Med. Genet., 52, 450–461. 7. Evans, D.G.R., Trueman, L., Wallace, A., Collins, S. and Strachan, T. (1998) Genotype/phenotype correlations in type 2 neurofibromatosis (NF2): evidence for more severe disease associated with truncating mutations. J. Med. Genet., 35, 450–455. 8. Trofatter, J.A., MacCollin, M.M., Rutter, J.L., Murrell, J.R., Duyao, M.P., Parry, D., Eldridge, R., Kley, N., Menon, A.G., Pulaski, K. et al. (1993) A novel moesin-, ezrin-, radixin-like gene is a candidate for the neurofibromatosis 2 tumor supressor. Cell, 72, 791–800. 9. Rouleau, G.A., Merel, P., Lutchman, M., Sanson, M., Zuckman, J., Marineau, C., Hoang-Xuan, K., Demczuk, S., Desmase, C., Plougastel, B. et al. (1993) Alteration of a new gene encoding a putative membrane organizing protein causes neurofibromatosis type 2. Nature, 363, 515–521. 10. Merel, P., Hoang-Xuan, K., Sanson, M., Bijlsma, E., Laurent-Puig, P., Pulst, S., Rouleau, G., Lenoir, G., Sterkers, J.M., Philippon, J. et al. (1995) Screening for germ line mutations in the NF2 gene. Genes Chromosomes Cancer, 12, 117–127. 11. Kluwe, L., Bayer, S., Baser, M.E., Hazim, W., Haase, W., Funsterer, C. and Mautner, V.F. (1996) Identification of NF2 germ-line mutations and comparison with neurofibromatosis 2 phenotypes. Hum. Genet., 98, 534–538. 12. Parry, D.M., MacCollin, M.M., Kaiser, K.M., Pulaski, K., Nicholson, H.S., Bolesta, M., Eldridge, R. and Gusella, J.F. (1996) Germ-line mutations in the neurofibromatosis 2 gene: correlations with disease severity and retinal abnormalities. Am. J. Hum. Genet., 59, 529–539. 13. Ruttledge, M.H., Andermann, A.A., Phelan, C.M., Claudio, J.O., Han, F.Y., Chretien, N., Rangaratnam, S., MacCollin, M., Short, P., Parry, D. et al. (1996) Type of mutation in the neurofibromatosis type 2 gene (NF2) frequently determines severity of disease. Am. J. Hum. Genet., 59, 331–342..
(12) 282. Human Molecular Genetics, 2001, Vol. 10, No. 3. 14. Zucman-Rossi, J., Legoix, P., Der Sarkissian, H., Cheret, G., Sor, F., Bernardi, A., Cazes, L., Giraud, S., Ollagnon, E., Lenoir, G. and Thomas, G. (1998) NF2 gene in neurofibromatosis type 2 patients. Hum. Mol. Genet., 7, 2095–2101. 15. Watson, C.J., Gaunt, L., Evans, G., Patel, K., Harris, R. and Strachan, T. (1993) A disease associated germline deletion maps the type 2 neurofibromatosis (NF2) gene between the Ewing sarcoma region and the leukemia inhibitory factor locus. Hum. Mol. Genet., 2, 701–704. 16. Sanson, M., Marineau, C., Desmaze, C., Luthman, M., Ruttledge, M., Baron, C., Narod, S., Delattre, O., Lenoir, G., Thomas, G. et al. (1993) Germline deletion in a neurofibromatosis type 2 kindred inactivates the NF2 gene and a candidate meningioma locus. Hum. Mol. Genet., 2, 1215–1220. 17. Kluwe, L. and Mautner, V.F. (1996) A missense mutation in the NF2 gene results in moderate and mild clinical phenotypes of neurofibromatosis type 2. Hum. Genet., 97, 224–227. 18. Scoles, D.R., Baser, M.E. and Pulst, S.M. (1996) A missense mutation in the neurofibromatosis 2 gene occurs in patients with mild and severe phenotypes. Neurology, 47, 544–546. 19. Ruttledge, M.H., Narod, S.A., Dumanski, J.P., Parry, D.M., Eldridge, M.D., Wertelecki, W., Parboosingh, J., Faucher, M.C., Lenoir, D.V.M., Collins, V.P. et al. (1993) Pre-symptomatic diagnosis for neurofibromatosis 2 with chromosome 22 markers. Neurology, 43, 1753–1760. 20. Bruder, C.E.G., Ichimura, K., Blennow, E., Ikeuchi, T., Yamaguchi, T., Yuasa, Y., Collins, V.P. and Dumanski, J.P. (1999) Severe phenotype of the neurofibromatosis type 2 in a patient with a 7.4 Mbp constitutional deletion on chromosome 22; possible localization of a neurofibromatosis type 2 modifier gene? Genes Chromosomes Cancer, 25, 184–190. 21. Kallioniemi, A., Kallioniemi, O.P., Sudar, D., Rutovitz, D., Gray, J.W., Waldman, F. and Pinkel, D. (1992) Comparative genomic hybridization for molecular cytogenetic analysis of solid tumors. Science, 258, 818–821. 22. Solinas-Toldo, S., Lampel, S., Stilgenbauer, S., Nickolenko, J., Benner, A., Dohner, H., Cremer, T. and Lichter, P. (1997) Matrix-based comparative genomic hybridization: biochips to screen for genomic imbalances. Genes Chromosomes Cancer, 20, 399–407. 23. Pinkel, D., Seagraves, R., Sudar, D., Clark, S., Poole, I., Kowbel, D., Collins, C., Kuo, W.L., Chen, C., Zhai, Y. et al. (1998) High resolution analysis of DNA copy number variation using comparative genomic hybridization to microarrays. Nature Genet., 20, 207–211. 24. Albertson, D.G., Ylstra, B., Segraves, R., Collins, C., Dairkee, S.H., Kowbel, D., Kuo, W.L., Gray, J.W. and Pinkel, D. (2000) Quantitative. 25.. 26.. 27.. 28.. 29. 30.. 31.. 32.. 33.. 34.. mapping of amplicon structure by array CGH identifies CYP24 as a candidate oncogene. Nature Genet., 25, 144–146. Xie, Y.-G., Han, F.-Y., Peyrard, M., Ruttledge, M.H., Fransson, I., DeJong, P., Collins, J., Dunham, I., Nordenskjöld, M. and Dumanski, J.P. (1993) Cloning of a novel, anonymous gene from a megabase-range YAC and cosmid contig in the neurofibromatosis type 2/meningioma region on human chromosome 22q12. Hum. Mol. Genet., 2, 1361–1368. Peyrard, M., Fransson, I., Xie, Y.-G., Han, F.-Y., Ruttledge, M.H., Swahn, S., Collins, J.E., Dunham, I., Collins, V.P. and Dumanski, J.P. (1994) Characterization of a new member of the human β-adaptin gene family from chromosome 22q12, a candidate meningioma gene. Hum. Mol. Genet., 3, 1393–1399. Bijlsma, E.K., Wallace, A.J. and Evans, D.G. (1997) Misleading linkage results in an NF2 presymptomatic test owing to mosaicism. J. Med. Genet., 34, 934–936. Evans, D.G.R., Wallace, A.J., Wu, C.L., Trueman, L., Ramsden, R.T. and Stachan, T. (1998) Somatic mosaicism: a common cause of classic disease in tumor-prone syndromes? Lessons from type 2 neurofibromatosis. Am. J. Hum. Genet., 63, 727–736. Kluwe, L. and Mautner, V.F. (1998) Mosaicism in sporadic neurofibromatosis 2 patients. Hum. Mol. Genet., 7, 2051–2055. Dunham, I., Shimizu, N., Roe, B.A., Chissoe, S., Hunt, A.R., Collins, J.E., Bruskiewich, R., Beare, D.M., Clamp, M., Smink, L.J. et al. (1999) The DNA sequence of human chromosome 22. Nature, 402, 489–495. Gutmann, D.H., Aylsworth, A., Carey, J.C., Korf, B., Marks, J., Pyeritz, R.E., Rubenstein, A. and Viskochil, D. (1997) The diagnostic evaluation and multidisciplinary management of neurofibromatosis 1 and neurofibromatosis 2. J. Am. Med. Assoc., 278, 51–57. Sambrook, J., Fritsch, E.F. and Maniatis, T. (1989) Molecular Cloning: A Laboratory Manual. Cold Spring Harbor Laboratory Press, Cold Spring Harbor, NY. Blennow, E., Nielsen, K.B., Telenius, H., Carter, N.P., Kristoffersson, U., Holmberg, E., Gillberg, C. and Nordenskjold, M. (1995) Fifty probands with extra structurally abnormal chromosomes characterized by fluorescence in situ hybridization. Am. J. Med. Genet., 55, 85–94. Tapia-Paez, I., O’Brien, K.P., Kost-Alimova, M., Sahlen, S., Kedra, D., Bruder, C.E., Andersson, B., Roe, B.A., Hu, P., Imreh, S. et al. (2000) Fine mapping of the constitutional translocation t(11;22)(q23;q11). Hum. Genet., 106, 506–516..
(13)
Figure

+3
Documents relatifs