Best Reflects Protein-Ligand Interactions
Found in Solution? A Comparison of ESI,
nanoESI, and ESSI for the Determination of
Dissociation Constants with Mass
Spectrometry
Matthias Conradin Jecklin, David Touboul, Cédric Bovet,
Arno Wortmann, and Renato Zenobi
Department of Chemistry and Applied Biosciences, ETH Zurich, Zurich, Switzerland
We present a comparison of three different electrospray-based ionization techniques for the investigation of noncovalent complexes with mass spectrometry. The features and character-istics of standard electrospray ionization (ESI), chip-based nanoESI, and electrosonic spray ionization (ESSI) mounted onto a hybrid quadrupole time-of-flight mass spectrometer were compared in their performance to determine the dissociation constant (KD) of the model system hen egg white lysozyme (HEWL) binding to N,N N=,N⬙NN -triacetylchitotriose (NAG3). The best KD value compared with solution data were found for ESSI, 19.4 ⫾ 3.6M. Then, we determined the KDs of the two nucleotide binding sites of adenylate kinase (AK), where we obtained KDs of 2.2⫾ 0.8M for the first and 19.5 ⫾ 8.0M for the second binding site using ESSI. We found a weak charge state dependence of the KD for both protein-ligand systems, where for all ionization techniques the KD value decreases with increasing charge state. We demonstrate that ESSI is very gentle and insensitive to instrumental parameters, and the KD obtained is in good agreement with solution phase results from the literature. In addition, we tried to determine the KDfor the lymphocyte-specific kinase LCK binding to a kinase inhibitor using nanoESI due to the very low amount of sample available. In this case, we found KD values with a strong charge state dependence, which were in no case close to literature values for solution phase. (J Am Soc Mass Spectrom 2008, 19, 332–343) © 2008 American Society for Mass Spectrometry
T
he discovery of electrospray ionization (ESI) [1]and its ability to transfer high molecular weight biomolecules into the gas-phase revolutionized biological mass spectrometry (MS) and is still a con-stantly growing area of research. Earlier ESI sources dispersed liquids into aerosols by forcing a dissolved sample liquid through a hypodermic needle using a syringe pump (at typical flow rate of 5 to 20 L/min) and by applying a spray voltage (usually 3 to 4 kV) on the spray capillary tip[1, 2]. Such electrospray purely driven by the applied potential can form different spray modes, such as dripping, stable cone-jet and multi-jet modes [3]. Vertes’ group showed how spray voltages and modes can be tuned to achieve different ion yields and spray stabilities and how they affect the spectrum quality[4, 5]. Modern ESI interfaces, however, bypass these phenomena to some extent as they are
pneumat-ically assisted by a concentric flow of an inert gas (usually nitrogen) around the electrospray plume. The use of a “nebulizer” or “sheath” gas was first proposed by Bruins et al.[6].
Miniaturization of the electrospray source, the devel-opment of nanoelectrospray ionization (nanoESI), as first described by Wilm and Mann, and coworkers
[7–9], brought considerable advantages to study bio-molecules with MS. The main difference compared with conventional ESI is the use of very small spray capillar-ies (1 to 5m i.d.), that work with very low sample flow rates (20 to 100 nL/min), leading to a drastic reduction in sample consumption. The liquid sample flow is sometimes driven solely by capillary forces or slightly supported by a gentle backing pressure on the capillary, but no coaxial sheath gas is needed. However, the comparatively time-consuming procedure of manual capillary loading is still a limitation for high sample throughput. A chip-based nanoelectrospray (nanoES) source (NanoMate; Advion Bioscience, Ithaca, NY), in contrast, allows fast and automatic loading of the
sam-Address reprint requests to Dr. Renato Zenobi, Department of Chemistry and Applied Biosciences, ETH, Hönggerberg, HCI, CH-8093 Zurich, Swit-zerland. E-mail:[email protected]
Published online November 19, 2007 © 2008 American Society for Mass Spectrometry. Published by Elsevier Inc. Received May 16, 2007
1044-0305/08/$32.00 Revised November 8, 2007
ple by combining a spray chip—a micromachined sili-con wafer—with a pipeting robot[10]. This technology, with its ability of LC-coupling, offers great advantages for automation and high-throughput protein character-ization and proteomics[11]. Conventional ESI produces initial droplets of 1 to 5 m diameter [12], while nanoESI generates initial droplets with a diameter less than 200 nm, which are about 100 to 1000 times smaller in volume[8]. A higher number of droplets generated in nanoES will form more ions that are available for MS since smaller initial droplets accelerate the desolvation process. The higher ionization efficiency is also due to the higher concentration of excess charge on the drop-lets[13].
In 2004, Takats [14] introduced a set-up for elec-trosonic spray ionization (ESSI), which is a hybrid of sonic spray ionization [15, 16] and ESI. It employs a traditional micro ESI source with supersonic nebulizer gas surrounding the spray tip. This technique creates ultrafine initial droplets with a very efficient subse-quent desolvation of the droplets to form ions. Takats and coworkers reported very narrow charge state dis-tributions, considerably less sensitivity to salt clustering effects, and very narrow peak widths for the examined model proteins[14]. They could even provide evidence that fully desolvated ions were generated at atmo-spheric pressure with ESSI. ESSI has been reported to transfer intact biomolecular complexes from solution to the gas phase[17].
ESI-MS is also known to transfer noncovalent com-plexes from solution into the gas phase[18 –24]. How-ever, whether the conformation of these macromole-cules and their noncovalent interactions reflects the actual binding conditions in solution is still a highly debated question[25–32].
A lot of effort is currently put into developing approaches to quantitatively measure noncovalent in-teraction strengths of protein/peptide-ligand systems by ESI-MS[33–37]. Improvements for accurate determi-nation of dissociation constants (KD)s have been
pre-sented, e.g., taking into account different ionization efficiencies of free protein and noncovalent complexes
[38, 39], or correcting for nonspecific ligand binding
[40, 41].
In this work, for verification of our methodology, we first applied the titration method [33] to study the noncovalent interaction in a well-characterized protein ligand system, hen egg white lysozyme (HEWL) bind-ing to N,N N=,N⬙NN -triacetylchitotriose (NAG3). HEWL
catal-yses the hydrolysis of -1,4-glycosidic linkages in certain gram-positive bacterial walls and is a bacterio-logical agent in hen egg white [42, 43]. Three different ionization methods, ESI, nanoESI, and ESSI were inves-tigated in terms of their influence on complex stability in the gas phase and to see which one best reflects the protein complex equilibrium found in solution. In most work found in the literature, KDs are determined from
the ratio of complex and free protein, using either a single (dominant) charge state or mass-deconvoluted
spectra. It is also interesting to study whether the calculated KDvaries with individual charge state. In a
well-behaved system, little or no charge state depen-dence should exist. However, differences in ionization efficiency, in transmission efficiency of the mass spec-trometer for different species, and charge-dependent modulation of interaction with a ligand in the gas phase may exist in some cases. In this work, we therefore calculated KDs for individual charge states. The HEWL–
NAG3interactions was found to be well-behaved in this
respect.
We extended this study to determine the binding affinity of adenylate kinase (AK) binding to adenosine-5=-diphosphate (ADP). AK is a phosphotransferase in-volved in cellular energy homeostasis and is regulating the production of ADP from adenosine-5=-triphosphate under the presence of adenosine-5=monophosphate and has two binding sites for these nucleotides [44]. We compared the three ionization techniques and again calculated the KDs in a charge state-resolved manner.
We observed only a small increase in affinity with increasing charge on the protein; the lowest KDvalues
were found for ESSI.
In addition we tried to apply the ESI-MS titration method to quantify the binding strength of a kinase inhibitor (“Compound A”, whose name and structure cannot be given because of corporate issues) to the SRC-family lymphocyte-specific kinase LCK. Because of the considerably higher sample consumption of ESI and ESSI, this investigation was restricted to nanoESI. LCK is involved in the initial phosphorylation of T-cell receptor components, which is required for signal trans-duction and T-cell activation. Hence, it is an attractive cell-specific target for the design of T-cell immunosup-pressants [45, 46]. Using the same method, we calcu-lated KDvalues for the apparent charge states of LCK
and Compound A. This case was found to be problem-atic: the calculated KD values showed a strong charge
state dependence.
Experimental
Instrumentation
Mass spectrometric analysis was performed with a hybrid quadrupole time-of-flight mass spectrometer (Q-TOF Ultima; Waters/Micromass Ltd., Manchester, UK) equipped with a Z-spray interface. The instrument was controlled via the MassLynx version 4.0 software. All measurements were performed in the positive ion mode. The source temperature was kept at 50 °C to 55 °C for ESSI and nanoESI measurements. For ESI measurements, a higher source temperature of 90 °C was used for a complete desolvation of the protein ions. The cone voltage was kept at 45 V for all the measure-ments, since no influence on the complex stability or desolvation process was observed. The RF1 voltage, the potential applied to the first ion tunnel in the linear flight path before the quadrupole, the collision cell and
333 J Am Soc Mass Spectrom 2008, 19, 332–343 PROTEIN-LIGAND KDs MEASURED WITH ESI, nanoESI, AND ESSI
the TOF-tube, was varied from 20 to 200 V. Argon was used as collision gas and a typical setting of 20 V was used for the collision energy parameter for optimized desolvation. The transmission of the ions was opti-mized on the quadrupole for the required mass range (m/z 1500 to 3500 for HEWL, m/z 2000 to 4500 for AK). Mass spectra were accumulated during 2 to 3 min to have good signal-to-noise ratio. Calibration of the in-strument up to 6000 m/z was performed using the cesium iodide (CsI) clusters generated by spraying a solution of CsI in water/2-propanol (1/1, vol/vol) at a concentration of 2g/ L.
ESI measurements were performed using the manu-facturer’s standard ESI source (Waters/Micromass Ltd.). The i.d. of the spray capillary was 75m and the spray distance was around 1 cm.
The ESSI source was, with some modifications, re-built as described by Takats [14]. The voltage supply was achieved by a stainless steel union (Upchurch Scientific Inc., Oak Harbor, WA) instead of applying it directly to the tip of the syringe. Teflon was chosen as ferrule material (instead of graphite) due to its high flexibility and softness for an optimal sealing of the high pressures in the T-Element. The T-Element was pur-chased from Swagelok (Solon, OH). Untreated fused-silica tubing with standard polyimide coating (350m o.d. and 250m i.d. for the outer capillary; 150 m o.d. and 50 m i.d. for the sample capillary) and ferrules were obtained from BGB Analytik (Böckten, Switzer-land). The ESSI source was mounted on a x-y-z posi-tioning stage and was carefully aligned to the MS inlet to achieve the highest sensitivity. A spray distance of 8 to 10 cm was used for all ESSI measurements. Nitrogen was used for the sonic nebulizing gas at a typical pressure of 15 to 20 bar, which led to a gas flow rate of ⬃2.5 to 3.5 L/min on the spray tip.
A syringe pump (Harvard 22 syringe pump; Har-vard Apparatus GmbH, March-Hugstetten, Germany) was used for sample infusion using ESI and ESSI.
NanoESI measurements were performed using an automated chip-based nanoESI robot (NanoMate model 100; Advion Bioscience, Ithaca, NY). It holds a 96-well sample plate, a rack of 96 disposable, conductive pipette tips, and a nanospray chip containing 20⫻ 20 nozzles of 5m diameter. A gentle backing pressure of 4 to 6 bar on the spray tip was used to assist the liquid sample flow.
Materials and Methods
Hen egg white lysozyme (HEWL; MW ⬇ 14.3 kDa), adenylate kinase from chicken muscle (AK; MW⬇ 24.4 kDa), adenosine-5=-diphosphate (ADP; MW ⫽ 427.2 Da), disodium salt hydrate, N,N N=,N⬙NN -triacetylchitotriose
(NAG3; MW⫽ 627.6 Da), as well as CsI and ammonium bicarbonate were purchased form Sigma-Aldrich Che-mie GmbH, Buchs, Switzerland). LCK (MW⬇ 30.6 kDa) and Compound A were provided by the Novartis Institutes for Biomedical Research.
All mass spectra for the titration experiments were recorded under nondenaturing conditions using a 20 mM ammonium bicarbonate buffer at pH 6.8 (pH was adjusted using dry ice). Before mass spectrometric analysis, HEWL, AK, and LCK samples were desalted using Micro Bio-Spin 6 columns (BioRad, Hercules, CA) with a 6 kDa cutoff equilibrated with the 20 mM ammonium bicarbonate buffer at pH 6.8.
Titration experiments were performed keeping the protein concentration constant (10M for both HEWL and AK) and varying the ligand concentration (from 1 to 50 M ADP for AK and 1 to 100 M NAG3 for HEWL). Mass spectra were first background subtracted and smoothed using the MassLynx software. Second, peak areas for free protein and the noncovalent com-plexes were integrated using JDPeakIntegrator, a soft-ware developed by in our laboratory especially for this purpose[34].
The model for the KDcalculation has been adapted
from Daniel et al. [34]. The ratio of the free protein signal over complex signal was plotted against the concentration of ligand and titration curves obtained that way were fitted using the following equation:
I(P) I(PL)⫽
⫺⫺KD⫹
关
K兴
0⫺关
P兴
0⫺兹
兹
兹
兹
4KD关
L兴
0⫹共
KD⫺ L0⫹关
P兴
0兲
22L0
where I(P)/I(PL) stands for the intensity ratio of free protein over complex, [P]0 indicates the initial protein
concentration, [L]0the initial ligand concentration and
KD was the fitting parameter. We obtained different
titration points by plotting the ratio of free protein over complex as a function of added ligand. By fitting these titration curves using eq 1, we calculated the KDvalues
for the HEWL-NAG3 system and the binding of ADP to the first binding site of AK. To determine the KDvalue
of ADP for the second binding site of AK, we took into account the already bound ADP in the first binding pocket. Therefore, we subtracted 10 M off the initial ADP concentration, as the first binding pocket of the protein (as [P]0⫽ 10M) was fully saturated.
It was assumed for all cases that the ionization efficiency is the same for complex and free protein. The mass of the ligand is very small compared with the proteins mass and therefore the ligand will not interfere greatly with the ionization processes of the protein surface. Furthermore, this assumption allowed us to use the intensity ratios of free protein over complex instead of their concentrations in solution; no response factor had to be introduced. The KDcalculation and titration
curve fitting were performed using Origin v7.5 soft-ware (OriginLab Corp., Northampton, MA).
Results and Discussion
Binding of HEWL with NAG
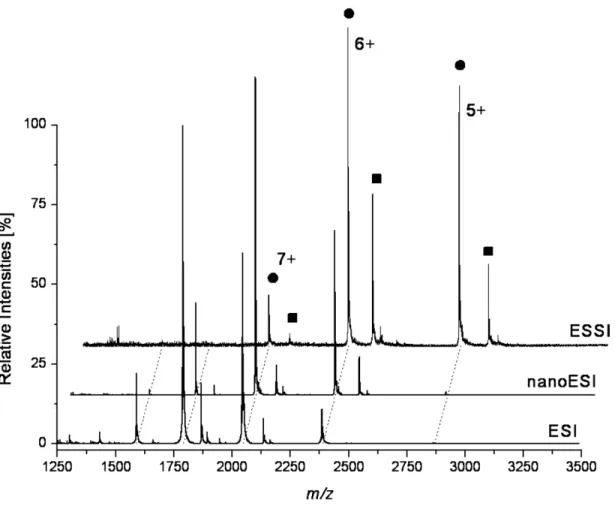
3Representative mass spectra of the noncovalent com-plexes between HEWL and NAG3are shown inFigure 1. The most abundant charge state is shifted comparing ESI, nanoESI, and ESSI. The most intense charge state for ESI is⫹8, appearing together with ⫹9, ⫹7, and ⫹6. For nanoESI the most intense signal is obtained for⫹7, which is observed together with⫹9 (very low), ⫹8, ⫹6, and ⫹5 (very low). For ESSI the predominant protein signal corresponds to charge state ⫹6, which appears together with ⫹7 and ⫹5. By comparing the same charge state (⫹6) for the different ionization techniques inFigure 1, a variation in complex abundance is noted.
The highest signal for the HEWL–NAG3 complex is
observed for ESSI, where the signal for the complex is ⬎50% compared with the free protein signal. For ESI and nanoESI the complex signal never exceeds approx-imately 20% of the corresponding free protein signal. This is evidence for the softness of ESSI. Due to the fast desolvation process of ESSI, noncovalent interactions present in solution can be “frozen” faster and trans-ferred into the gas phase more rapidly. Noncovalent interaction would thus be less disturbed and the com-plexes will be better conserved after transfer into the gas phase.
The KDvalues determined for the titration of HEWL
with NAG3are given inTable 1. The errors indicate the
fitting quality according to eq 1 (see the Experimental
Figure 1. Representative mass spectra of the noncovalent HEWL-NAG3complex (HEWL 10M,
NAG360M in 20 mM ammonium bicarbonate buffer) using different ionization techniques. The
charge states of free protein signals (filled circle) and HEWL-NAG3complex signals (filled square]) are
given for ESSI.
Table 1. Calculated dissociation constants (KDs) inM from the titration experiments of HEWL with NAG 3using different
ionization techniques and constant instrumental parameters (RF1 voltage 100 V). The KDvalues were determined for the individual
charges states of the protein. The error values given represent the fitting quality
Charge state ⫹8 ⫹7 ⫹6 ⫹5 Mean KD
ESSI 18.1⫾ 1.3 20.6⫾ 0.5 19.4⫾ 3.6
NanoESI 38.3⫾ 2.1 41.1⫾ 1.8 40.0⫾ 5 39.8⫾ 8.8
ESI 46.6⫾ 2.8 72.9⫾ 6.0 59.8⫾ 17.6
335 J Am Soc Mass Spectrom 2008, 19, 332–343 PROTEIN-LIGAND KDs MEASURED WITH ESI, nanoESI, AND ESSI
section). The KDvalues agree quite well with the values of HEWL binding NAG3in solution. According to the literature, KDvalues have been obtained using different methods: 6M using diffusion MS [47], 6.6M using UV[48], and 8.6M using fluorescence [49]. Dennhart and Letzel demonstrated a KD determination for the
same protein ligand system by ESI titration MS and reported values in the range of 12 to 27 M using different evaluation methods and different incubation times[43]. The values reported in this work, especially the ones obtained for the ESSI titration, agree within one order of magnitude with literature values. This shows that the solution phase complexes are put into the gas phase intact. However, the spray, the desolva-tion, and the transmission through the mass spectrom-eter modulate the complex to free protein ratio some-what.
The KD values in Table 1 increase from higher to
lower charge states for ESI and ESSI. There are two reasons to explain this observation. First, the conforma-tion of HEWL in the gas phase might be slightly different for different charge states. This has been demonstrated using ion mobility mass spectrometry on gaseous disulfide-intact lysozyme[50]. Two conformers of disulfide-intact lysozyme were found, one highly folded, the other one partially unfolded. These findings could explain the different KDs as the protein
confor-mation and, therefore, the geometry of the binding pocket as well as the interactions with the ligand could be dependent on charge state. Second, noncovalent interaction strengths of biochemical interactions are different in solution compared with the gas phase[33]. As the dielectric constant drops when going from solution to gas phase, interactions based on charges, dipoles, and polarizability are expected to increase. In the case of HEWL binding with NAG3, there are no
ion-ion interactions but only dipole interactions present in the binding pocket (hydrogen bonds between Y63, P103, W109, and NAG3 could be shown for a HEWL
mutant[51]. An increasing charge on the protein should lead to additional stabilization due to induced dipoles, causing a higher apparent affinity. This is indeed found, but there is only a significant trend for ESI, not for nanoESI or ESSI. When going from ⫹6 to ⫹5 for ESSI, the measured KDincreases by only 2.5M, whereas the
increase for ESI when going from ⫹8 to ⫹7 is much higher, 26.3M. The direction of this observation is also somewhat surprising, as more expanded protein con-formations with presumably lower binding affinities would be expected for more highly charged protein ions.
When comparing the same charge states for the different ionization methods, the affinity of ligand to the protein decreases from ESSI to nanoESI to ESI, respectively. The mean value reflects this trend for the three different techniques. Whereas the mean KD
deter-mined for ESSI is 19.4 ⫾ 3.6 M, the mean KD for
nanoESI or ESI is about a factor of two or three higher, respectively. Possibly the overall lower KDvalues found
for ESI are due to the higher desolvation gas tempera-ture (as described in the Experimental section) required for the observation of noncovalent complexes.
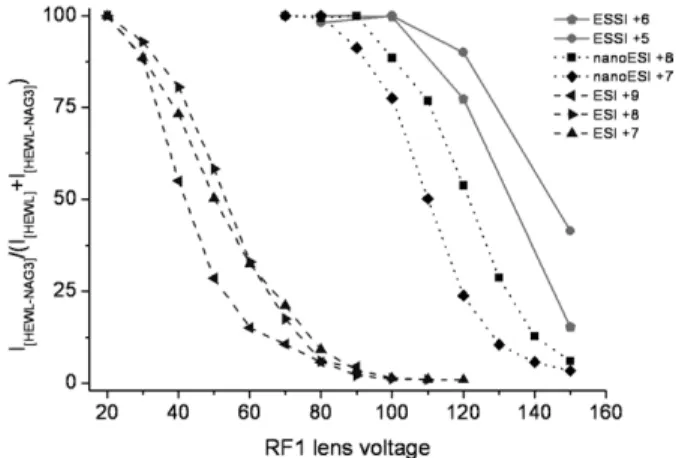
We next investigated the influence of instrumental parameters. Figure 2 shows the influence of the RF1 voltage on the stability of the noncovalent complex between HEWL and NAG3. As the RF1 voltage is
increased, the complex ions gradually dissociate. The RF1 voltage also has an influence on the charge state distribution of the noncovalent complex ions generated. The higher charge states are influenced more strongly by the RF1 parameter than the lower charge states. This is true for ESI, as the complex ions of⫹9 are dissociated at lower voltages compared with complex ions of ⫹8 and ⫹7. It is also the case for ESSI, as the complexes with charge ⫹6 are almost completely destroyed at a RF1 voltage of 150 V, whereas about 50% of the com-plexes with charge ⫹5 are still intact. Since the initial droplets generated by ESI are larger compared with nanoESI or ESSI, harsher instrumental conditions (higher source temperature and RF1 settings) are re-quired to observe a well desolvated protein or complex. In this case, more energy is transferred to the large molecules, which can break the noncovalent interac-tions between the ligand and the protein. The compro-mise of sufficient desolvation versus maintenance of intact complexes is met by softer experimental condi-tions in the case of nanoESI and ESSI, because the initial droplet size is much smaller.
Figure 2also shows that complex ions generated by ESI depend more on the RF1 setting compared with the other techniques, and that noncovalent complexes are completely dissociated at voltages⬎40 V. Complex ions generated by nanoESI or ESSI show a dependence on the RF1 lens only at much higher voltages. The nonco-valent complex ions from nanoESI start to be destroyed at⬎100 V, whereas ESSI complex ions are affected by this parameter only at higher voltages (⬎120 V). It is important to point out that for each protein-ligand system as well as for different instrument types,
opti-Figure 2. Percentage of HEWL-NAG3 complex over total HEWL
(IHEWL⫹IHEWL-NAG3) is plotted against the RF1 lens voltage. The
numbers in the legend indicate the charge states observed for the different ionization techniques.
mum parameters may vary. For example, the cone voltage on instruments using a linear sample infusion and ion transmission geometry seems to have a great influence on the stability of noncovalent complexes[52, 53]. Using the Z-shaped spray interface of the Q-TOF Ultima, however, we found little or no influence of the cone voltage on the stability of noncovalent complexes, neither for HEWL-NAG3nor for AK-ADP. These results
show the importance of a careful optimization of instru-mental parameters for the investigation of noncovalent interactions. The titration experiment for HEWL-NAG3
described in Table 1 was repeated using ESI with an RF1 setting of 50 V to keep the noncovalent complexes intact. Due to incomplete desolvation and peak broad-ening below 50 V, no spectra useful for titration exper-iment could be recorded. We determined KDvalues of
12.9⫾ 0.5M for charge state ⫹7 and of 12.9 ⫾0.4M for charge state ⫹6, which are very similar to those determined by ESSI at a RF1 voltage of 100 V.
Binding of AK with ADP
Representative mass spectra of the noncovalent AK-ADP complex obtained by ESI, nanoESI and ESSI are
shown in Figure 3. These mass spectra were recorded using the same instrumental settings and sample con-centrations (10 M for AK and 2 M for ADP). As shown inFigure 3, the ion source affects the charge state distribution for the same protein sample. For ESI, the most abundant charge states are ⫹11, ⫹10, and ⫹9, with⫹10 being most intense. For nanoESI charge states ⫹10, ⫹9, and ⫹8 are apparent, with ⫹9 being the predominant one. Finally, for ESSI charge states⫹9, ⫹8, ⫹7, and ⫹6 are present and ⫹7 is the most abundant. ESSI has previously been shown to create protein ions with a very narrow charge state distribution or even with only one predominant charge [14, 17]. However, for AK, a broader charge state distribution is observed using ESSI compared with the other ionization tech-niques.
Additional signals appear with low intensity at m/z 3250 and 3750 for both ESI and nanoESI but not for ESSI (Figure 3). They were assigned to the nonspecific AK homodimer. The formation of nonspecific complexes depends on the number of analyte molecules in the progeny droplets that ultimately lead to gaseous ions. The fact that for ESSI no nonspecific homodimer was found is an indication of small initial droplets
(contain-Figure 3. Representative mass spectra of the noncovalent AK-ADP complex (AK 10M, ADP 2 M in 20 mM ammonium bicarbonate buffer) using different ionization techniques. The charge states of free protein signals (depicted as filled circle) and AK-ADP complex signals (filled square) are given for ESSI. The signals for the nonspecific homodimer of AK (inverted filled triangle)[6]were observed only for ESI and nanoESI.
337 J Am Soc Mass Spectrom 2008, 19, 332–343 PROTEIN-LIGAND KDs MEASURED WITH ESI, nanoESI, AND ESSI
ing less analyte molecules) generated due to the high shear force of the nebulizer gas. This assumption is supported by observations made when ESSI was first introduced, where it was reported to exhibit less clus-tering and aggregation [14].
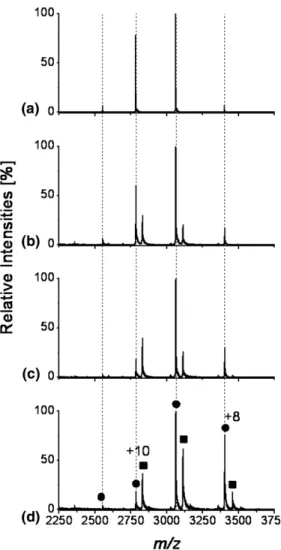
It is known from active site-blocking experiments done earlier in this group that AK specifically binds nucleotides in ESI-MS measurements [34]. Thus, non-specific binding can be excluded in this case. Moreover, we could not observe nonspecific clustering, even at high ADP concentrations (50 M ADP) confirming the specificity of the complexes observed. Figure 4 shows
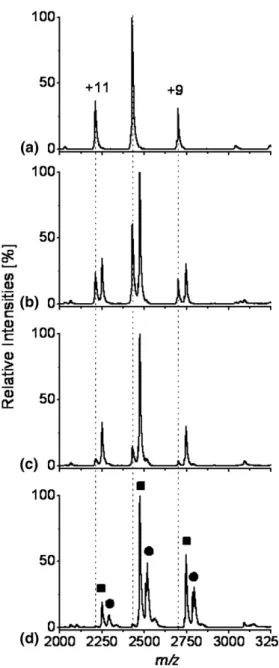
the progress of the AK-ADP titration using nanoESI.
Figures 4b, c, and d show the mass spectrum of AK without ADP added to the solution. Figures 4b and c show mass spectra of AK titrated with 6M, 10 M and 50 M ADP, respectively. It is quite obvious that with 10 M ADP, full complexation of the AK is achieved, indicated by the complete mass shift to the AK-(ADP) species. If the concentration is further increased, the second binding pocket of AK also binds ADP. The peaks appear to be broader, but the integrated signals used for the KDdetermination were comparable for the
free AK and the AK-(ADP) complexes. Due to the higher KDvalue even at high ADP concentrations some
AK-(ADP) will remain uncomplexed.
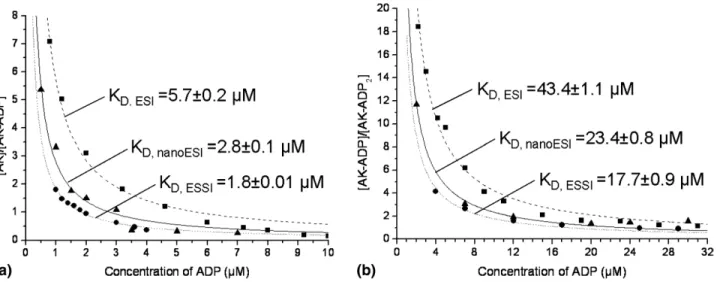
Figure 5 shows the fitted titration curves for the AK-ADP experiments using different ionization tech-niques.Figure 5a shows the titration of the first binding site of AK for charge state ⫹9. The same trend was observed by comparing charge state⫹10 for the differ-ent ionization methods (data not shown). The intensity ratio of free protein over complex is plotted against the initial ligand concentration. At concentrations higher than 10 M, the ratio of free protein over complex remains constant (for all three ionization methods) indicating that the protein species in solution is com-pletely saturated with ligand (Figure 5a). If the ligand concentration is further increased (⬎10 M), an addi- tional signal appears in the mass spectrum correspond-ing to the AK-(ADP)2 complex. Figure 5b shows the
titration of the second binding pocket of AK by moni-toring the ratio of AK-(ADP) over AK-(ADP)2 against
the ligand concentration. In both cases (Figures 5a and b) ESSI show the highest affinity, followed by nanoESI and then ESI. This can again be attributed to the fast and more complete desolvation process of ESSI ions and the better conservation of the noncovalent com-plexes during their path from solution into the gas phase. The droplet evolution to from ions produced by ESI is considerably different compared with nanoESI and ESSI [8, 2, 14]. Starting at much bigger initial droplets, the desolvation process in the case of ESI is likely much slower and the number of Coulombic fissions required is much higher. This leads to only partial desolvation in the atmospheric pressure region and often further desolvation and ion formation hap-pens in the first part of the mass spectrometer. The fact that a high source temperature had to be set for ESI (see the Experimental section) compared with the other two techniques supports this interpretation.
The KD values obtained for the first and second
binding pocket of AK binding ADP in the absence of magnesium are shown inTable 2a and b, respectively. The KDvalues for the first active site are all in the range
of 1.8 to 5.7 M for the ionization techniques investi- gated. By comparing the KDs for charge state⫹9 for all
ionization methods, ESSI has the lowest values com-pared with the others. In fact, the KDs obtained for ESI
are more than a factor of two higher than for ESSI. Again, the higher KDfound for ESI may be due to the Figure 4. Representative mass spectra of AK with different ADP
concentrations using nanoESI. (a) The mass spectrum of 10M AK in absence of ADP. (b), (c), (d) The mass spectra of 10M AK in presence of 6, 10, 50M ADP, respectively. The lines are added to help guide the eye for the free AK, the AK-(ADP) and the AK-(ADP)2species are depicted as filled square and filled circle,
required elevated desolvation gas temperature, as ex-plained in the Experimental section. The same phenom-enon is observed by comparing charge state ⫹10 and ⫹9 inTable 2b, where this difference is even larger than a factor of two. To our knowledge, no data has been published on KDvalues for the binding of ADP to AK,
even though several crystal structures have been deter-mined for the noncovalent complex between AK and ADP [54, 55]. There are two different, independent binding sites on AK[44]; one binding site for ATP and one for AMP. Both site, however, are also capable of binding ADP, which has been reported for
Mycobacte-rium tuberculosis AK [54]. Moreover, large domain movements and substrate-induced conformational changes upon substrate binding have been reported, implying that there are cooperative effects present when occupying the second binding site [44]. In our work, we can observe quite clearly that the second binding pocket is “activated” upon ADP binding of the first binding site. This activated AK-ADP complex is then capable of binding ADP in the second binding site
with an affinity about one order of magnitude lower compared with the first ADP bound.
InTable 2, the same general tendency was observed regarding the charge state dependence of the KDvalues,
as in the case of the HEWL-NAG3titration (seeTable 2).
This trend was found for all three ionization methods examined. The KD values increase with decreasing
charge state (seeTable 2a), a trend even more apparent for the titration of the second binding pocket (Table 2b) where the difference can be greater than 7 M in KD
going from charge state⫹10 to ⫹6 for ESSI. Regarding this general tendency, there are again differences for the different ionization methods. Whereas the change in KD
going from⫹10 to ⫹8 is between 0.2M ( Table 2a) and 4.7M ( Table 2b) for ESSI, the change for ESI by going from⫹11 to ⫹9 is considerably greater, 1.9M ( Table 2a) and 6.8M ( Table 2b). In other words, the charge state dependent KD values obtained for ESSI are more
consistent within a broad range of charge states com-pared with, e.g., ESI. In this case, ionic interactions between the phosphates of ADP and the AK binding
Figure 5. Titration curves for AK with ADP of charge state 9⫹ using different ionization techniques.
ESI is depicted as filled square, nanoESI as filled triangle, and ESSI as filled circle. (a) The titration of AK with ADP of the first binding site. (b) The titration of the second binding site.
Table 2. Calculated dissociation constants (KDs) inM for different charge states from the titration experiments of AK with ADP.
(a) shows the obtained KDs for the first binding site of AK, (b) shows the determined KDs for the second binding site. The errors
show the fitting quality of the titration curve
a ⫹11 ⫹10 ⫹9 ⫹8 ⫹7 ⫹6 Mean KD Charge state ESSI 1.9⫾ 0.1 1.8⫾ 0.01 2.1⫾ 0.1 2.3⫾ 0.1 2.7⫾ 0.1 2.2⫾ 0.8 NanoESI 2.0⫾ 0.2 2.8⫾ 0.1 3.6⫾ 0.2 2.8⫾ 1.0 ESI 3.8⫾ 0.2 4.7⫾ 0.1 5.7⫾ 0.2 4.7⫾ 1.0 b ⫹11 ⫹10 ⫹9 ⫹8 ⫹7 ⫹6 Mean KD Charge state ESSI 15.0⫾ 0.9 17.7⫾ 0.9 19.7⫾ 0.8 23.1⫾ 0.6 22.1⫾ 0.8 19.5⫾ 8.0 NanoESI 23.4⫾ 0.8 23.0⫾ 0.8 23.2⫾ 3.2 ESI 36.6⫾ 1.8 40.8⫾ 1.4 43.4⫾ 1.1 40.3⫾ 5.0 339 J Am Soc Mass Spectrom 2008, 19, 332–343 PROTEIN-LIGAND KDs MEASURED WITH ESI, nanoESI, AND ESSI
pockets are present[54, 55]. As reported in the crystal structures, in the AK binding pocket (depending on the organism) there are different arginines and lysines present, which stabilize the phosphates of the nucleo-tides. This fact can again be discussed in terms of a modulation of the relative intensities of complex and free protein signal due to different interaction strengths in the gas phase compared with solution. The trend of increasing ligand affinity with increasing charge on the protein can be explained by stronger electrostatic forces between a more highly charged protein ion interacting with a ligand carrying an opposite charge [33]. Never-theless, as in the case of HEWL-NAG3, this change in
interaction strength must be rather weak, since the variation in KDwith charge state is small. It can also be
questioned whether the ionization efficiency of protein ions is constant when ADP is bound. Ionization effi-ciency and ion formation in ESI is partially governed by protonation of basic residues (arginines, lysines, and histidines) of the proteins[56, 57]. When ADP is bound in the binding pocket, however, the arginines and lysines present would be shielded by the ligand and their protonation would be prevented. If, however, these residues would take part in the protonation of the protein during the electrospray process, a shift in aver-age charge state would be expected when ligand is added, as less protonation sites are available. No such a shift was observed in our experiments, which led us to conclude that the basic residues in the binding pocket are not involved in the protonation of the protein during the electrospray process.
Binding of LCK with Compound A
In terms of sample consumption, ESI and ESSI are comparable: for one 3-min measurement and a flow rate of 5L/min, both techniques require a sample volume of 15 to 20 L. However, to have mass spectra of comparable intensity with nanoESI, a sample volume of only 2 to 3L is needed. Comparing the spray stability of the ionization techniques used, ESSI has by far the most stable spray over time, followed by nanoESI. It is quite difficult to achieve a stable spray mode with ESI using aqueous solutions, and the required voltage win-dow to accomplish this is quite narrow [3, 4]. The advantage of nanoESI using the NanoMate is clearly its ease of use and the exceptionally low sample consump-tion, which makes it even more attractive when dealing with expensive and precious samples. This was the case for our LCK sample and, therefore, we chose to perform the titration experiments using only the NanoMate to determine this protein’s binding constant to Com-pound A.
Figure 6 shows four representative mass spectra of LCK under nondenaturing conditions with various amounts of Compound A. Figure 6a shows the mass spectrum obtained for 5M LCK in absence of ligand: charge states⫹11, ⫹10, and ⫹9 were observed.Figures 6b– d show mass spectra obtained for the noncovalent
LCK-Compound A complex, for three different concen-trations. In this case the complex abundance is very different for the different charge states. For charge state ⫹10 the ratio of free protein to complex is around 2:1, it decreases going to charge state ⫹9 and for ⫹8 no complex signal appears at this concentration.
Another interesting aspect is that the charge state distribution is slightly shifted by adding ligand, i.e., charge state⫹8 is not apparent for LCK in the absence of Compound A, but by adding 10M Compound A to the sample (Figure 6c) charge state⫹11 disappears and ⫹8 becomes more dominant compared withFigure 6b. Again, the ratio of free protein to complex is strongly charge state dependent, as for ⫹10 the ratio now is around 1:2 whereas for ⫹9 the ratio does not change compared with Figure 6b, and for⫹8 still no complex signal is observed. With increasing Compound A
con-Figure 6. Representative mass spectra using nanoESI of the LCK-Compound A titration experiment (LCK 5 M, in 20 mM ammonium bicarbonate buffer at pH 6.8). (a) shows the mass spectrum obtained of LCK sprayed under nondenaturing condi-tions in absence of Compound A. Mass spectra of the titration points with 1, 10, and 50M Compound A are shown in ( b), (c), and (d), respectively. In (d), charge states and corresponding free protein signals (filled circle) and noncovalent LCK-Compound A complex (filled square) are depicted.
centration (50 M, Figure 6d) this ratio appears to be constant for⫹10, it decreased for ⫹9, and finally for ⫹8 a complex signal emerged. With charge state⫹9 being the most intense and⫹8 at about 80% relative intensity, the overall charge state distribution is shifted a lot compared withFigure 6a.
We performed a titration experiment using concen-trations of Compound A ranging up to 500 M, which was necessary to get useful ratios for free protein to complex for charge state ⫹9. We determined the KD
value for each charge state using the method described in the Experimental section. The calculated KDs were
142⫾ 9M for charge state ⫹9, 15.3 ⫾ 0.8M for ⫹10, and 1.12⫾ 0.06M for ⫹11. The trend to lower affinity with decreasing charge on the protein is very strong in this case, about one order of magnitude between sub-sequent charge states. Finally, there is a large discrep-ancy between our measurements and known KDvalues
(nM range) obtained by measurements in solution. Overall, this strong charge state dependence indi-cates that the complex is not well behaved in these experiments; ESI titration experiments are not well suited for assessing KD values in such a case. Possible
explanations for this behavior could be: (1) As dis-cussed for lysozyme, there could be more than one LCK conformation in the gas phase, depending on the charge state. If the binding pocket conformation is changed a lot with increasing charge on the protein, different complex abundances comparing charge states could result. Unfortunately, no ion mobility data are available for LCK up to now. (2) A completely different interac-tion may exist in the gas phase compared with soluinterac-tion behavior. By looking at structures of complexes with other ligands competing for the ATP-binding site of LCK, the residues that take part in the ligand binding can be identified. Zhu et al.[45]have shown that for the competitive ligands AMP-PNP (a nonselective, nonhy-drolyzable ATP analog), staurosporine (a potent but nonselective protein kinase inhibitor), and PP2 (a potent SRC-family selective protein tyrosine kinase inhibitor), hydrogen bond interactions (E317, M319, S323, and T316, E317, M319, respectively), and several dispersion forces can be attributed to the residues in the binding pocket. K273, which is part of the binding pocket, is assumed to play a key role for the phenomena in the gas phase. (3) Binding of Compound A can prevent proto-nation of basic residues in (or near) the binding pocket (e.g., K273), thus affecting the charge state and ioniza-tion efficiency of ligand-bound protein. This interpreta-tion is consistent with the overall shift to lower charge with increasing ligand concentration (Figure 6). The large change in the KD values derived from different
charge states, and the overall shift in average charge state with increasing amount of ligand could perhaps be dealt with by using a response factor accounting for the different ionization efficiencies. As shown by Ga-belica et al.[38], one titration curve can be fitted to give
KDs and response factors orders of magnitudes off but
still at very good fitting quality. However, in the
present case, different response factors for each charge state would have to be used, leading to several addi-tional fitting parameters for the KD calculation, a
pro-cedure expected to be quite prone to error.
Conclusions
We compared the performance of ESI, nanoESI, and ESSI for KDdetermination with mass spectrometry. For
the model system HEWL binding NAG3, we found that
all three ionization techniques investigated here gave KD values that were similar and in good agreement
with the literature values observed in solution phase. ESSI, however, yielded the best KD values compared
with solution data, which is evidence for the softness of this method [14, 17]. The study of the influence of instrumental parameters on the complex stability re-vealed that ESSI ions are significantly less prone to gas-phase dissociation compared with the other ion sources.
We then determined the binding affinity of ADP binding to the two nucleotide binding pockets of AK. The ionization methods examined gave very similar KD
values, again with ESSI providing the lowest values, 2.2 ⫾ 0.8M for the first and 19.5 ⫾ 8.0M for the second binding site. We conclude that the droplet evaporation process is considerably different for ESSI compared with nanoESI and conventional ESI. For ESI, there is a droplet shrinking process accompanied by Coulomb droplet fissions and evaporation, eventually leading to fully desolvated ions[56, 57]. A very similar process is proposed for nanoESI, assuming that fewer fissions occur that the evaporation is faster, because nanoESI starts from smaller initial droplets [8]. For ESSI how-ever, the ion formation from charged droplets seems to be substantially different as the whole process is driven by the sonic sheath gas. The time scale of the evapora-tion in ESSI from the analyte in a charged droplet to the fully desolvated ion is expected be a lot shorter com-pared with the other spray methods. This feature to-gether, with the low internal energy of the ions, might be the reason for the unique spectral characteristics obtained from ESSI experiments.
For both systems, HEWL-NAG3 and AK-ADP, we
found a weak charge state dependence of the deter-mined KD values—an increasing affinity with
increas-ing charge on the protein. Nonspecific interactions due to electrostatic effects the gas phase, however, could be excluded for the HEWL and AK systems investigated here.
Our experiments with LCK binding Compound A demonstrate that a reliable KDdetermination is difficult
when dealing with a large charge state dependence of complex abundance. The following criteria can be used to judge whether one should expect a KDdetermination
to be difficult or impossible: (1) when a ligand signifi-cantly alters the ionization efficiency of its protein target, and a shift in average charge state distribution results, and (2) if the KDvalues determined for
individ-341 J Am Soc Mass Spectrom 2008, 19, 332–343 PROTEIN-LIGAND KDs MEASURED WITH ESI, nanoESI, AND ESSI
ual charge states increase a lot (by one order of magni-tude) between adjacent charge states. In such a case, the introduction of a response factor can be reasonable. However, the introduction of charge state dependent response factors provides several additional fitting pa-rameters, which would leave calculated KDs even more questionable.
Acknowledgments
MCJ and DT thank Novartis Institutes for BioMedical Research for financial support and sample donation. MCJ thanks Kurt Baum-gartner from the ETH machine shop for his assistance in setting up the electrosonic spray source.
References
1. Fenn, J. B.; Mann, M.; Meng, C. K.; Wong, S. F.; Whitehouse, C. M. Electrospray Ionization for Mass-Spectrometry of Large Biomolecules.
Science 1989, 246, 64 –71.
2. Gross, J. H. Mass Spectrometry. A Textbook, 2nd ed.; Springer-Verlag: Berlin and Heidelberg, 2004; 441– 474.
3. Cloupeau, M.; Prunetfoch, B. Electrohydrodynamic Spraying Function-ing Modes—A Critical-Review. J. Aerosol Sci. 1994, 25, 1021–1036. 4. Parvin, L.; Galicia, M. C.; Gauntt, J. M.; Carney, L. M.; Nguyen, A. B.;
Park, E.; Heffernan, L.; Vertes, A. Electrospray Diagnostics by Fourier Analysis of Current Oscillations and Fast Imaging. Anal. Chem. 2005, 77, 3908 –3915.
5. Nemes, P.; Marginean, I.; Vertes, A. Spraying Mode Effect on Droplet Formation and Ion Chemistry in Electrosprays. Anal. Chem. 2007, 79, 3105–3116.
6. Bruins, A. P.; Covey, T. R.; Henion, J. D. Ion Spray Interface for Combined Liquid Chromatography/Atmospheric Pressure Ionization Mass-Spectrometry. Anal. Chem. 1987, 59, 2642–2646.
7. Wilm, M. S.; Mann, M. Electrospray and Taylor-Cone Theory, Doles Beam of Macromolecules at Last. Int. J. Mass Spectrom Ion Processes 1994,
136, 167–180.
8. Wilm, M.; Mann, M. Analytical Properties of the Nanoelectrospray Ion Source. Anal. Chem. 1996, 68, 1– 8.
9. Wilm, M.; Shevchenko, A.; Houthaeve, T.; Breit, S.; Schweigerer, L.; Fotsis, T.; Mann, M. Femtomole Sequencing of Proteins from Polyacryl-amide Gels by Nano-Electrospray Mass Spectrometry. Nature 1996, 379, 466 – 469.
10. Schultz, G. A.; Corso, T. N.; Prosser, S. J.; Zhang, S. A Fully Integrated Monolithic Microchip Electrospray Device for Mass Spectrometry. Anal.
Chem. 2000, 72, 4058 – 4063.
11. Zhang, S.; Van Pelt, C. K. Chip-Based Nanoelectrospray Mass Spec-trometry for Protein Characterization. Expert Rev. Proteom. 2004, 1, 449 – 468.
12. Kebarle, P.; Tang, L. From Ions in Solution to Ions in the Gas Phase—the Mechanism of Electrospray Mass-Spectrometry. Anal. Chem. 1993, 65, A972–A986.
13. Juraschek, R.; Dulcks, T.; Karas, M. Nanoelectrospray— More than Just a Minimized-Flow Electrospray Ionization Source. J. Am Soc. Mass
Spectrom. 1999, 10, 300 –308.
14. Takats, Z.; Wiseman, J. M.; Gologan, B.; Cooks, R. G. Electrosonic Spray Ionization. A Gentle Technique for Generating Folded Proteins and Protein Complexes in the Gas Phase and for Studying Ion-Molecule Reactions at Atmospheric Pressure. Anal. Chem. 2004, 76, 4050 – 4058. 15. Hirabayashi, A.; Sakairi, M.; Koizumi, H. Sonic Spray Ionization
Method for Atmospheric-Pressure Ionization Mass-Spectrometry. Anal.
Chem. 1994, 66, 4557– 4559.
16. Hirabayashi, A.; Sakairi, M.; Koizumi, H. Sonic Spray Mass-Spectrom-etry. Anal. Chem. 1995, 67, 2878 –2882.
17. Wiseman, J. M.; Takats, Z.; Gologan, B.; Davisson, V. J.; Cooks, R. G. Direct Characterization of Enzyme-Substrate Complexes by Using Elec-trosonic Spray Ionization Mass Spectrometry. Angew. Chem. Int. Ed.
2005,44, 913–916.
18. Ganem, B.; Li, Y. T.; Henion, J. D. Observation of Noncovalent Enzyme Substrate and Enzyme Product Complexes by Ion-Spray Mass-Spec-trometry. J. Am. Chem. Soc. 1991, 113, 7818 –7819.
19. Smith, R. D.; Lightwahl, K. J. The Observation of Noncovalent Interac-tions in Solution by Electrospray-Ionization Mass-Spectrometry— Promise, Pitfalls, and Prognosis. Biol. Mass Spectrom. 1993, 22, 493–501. 20. Loo, J. A. Studying Noncovalent Protein Complexes by Electrospray
Ionization Mass Spectrometry. Mass Spectrom. Rev. 1997, 16, 1–23. 21. Schnier, P. D.; Klassen, J. S.; Strittmatter, E. E.; Williams, E. R. Activation
Energies for Dissociation of Double Strand Oligonucleotide Anions: Evidence for Watson-Crick Base Pairing in Vacuo. J. Am. Chem. Soc.
1998,120, 9605–9613.
22. Heck, A. J. R.; van den Heuvel, R. H. H. Investigation of Intact Protein Complexes by Mass Spectrometry. Mass Spectrom. Rev. 2004, 23, 368 – 389.
23. Ashcroft, A. E. Recent Developments in Electrospray Ionization Mass Spectrometry: Noncovalently Bound Protein Complexes. Nat. Prod. Rep.
2005,22, 452– 464.
24. Hofstadler, S. A.; Sannes-Lowery, K. A. Applications of ESI-MS in Drug Discovery: Interrogation of Noncovalent Complexes. Nat. Rev. Drug
Discov. 2006, 5, 585–595.
25. Cunniff, J. B.; Vouros, P. False Positives and the Detection of Cyclodex-trin Inclusion Complexes by Electrospray Mass-Spectrometry. J. Am.
Soc. Mass Spectrom. 1995, 6, 437– 447.
26. Kitova, E. N.; Wang, W. J.; Bundle, D. R.; Klassen, J. S. Retention of Bioactive Ligand Conformation in a Gaseous Protein-Trisaccharide Complex. J. Am. Chem. Soc. 2002, 124, 13980 –13981.
27. Hossain, B. M.; Simmons, D. A.; Konermann, L. Do Electrospray Mass Spectra Reflect the Ligand Binding State of Proteins in Solution? Can.
J. Chem. Rev. 2005, 83, 1953–1960.
28. Iavarone, A. T.; Parks, J. H. Conformational Change in Unsolvated Trp-Cage Protein Probed by Fluorescence. J. Am. Chem. Soc. 2005, 127, 8606 – 8607.
29. Ruotolo, B. T.; Giles, K.; Campuzano, I.; Sandercock, A. M.; Bateman, R. H.; Robinson, C. V. Evidence for Macromolecular Protein Rings in the Absence of Bulk Water. Science 2005, 310, 1658 –1661.
30. Benesch, J. L.; Robinson, C. V. Mass spectrometry of Macromolecular Assemblies: Preservation and Dissociation. Curr. Opin. Struct. Biol. 2006,
16, 245–251.
31. Ruotolo, B. T.; Robinson, C. V. Aspects of Native Proteins are Retained in Vacuum. Curr. Opin. Chem. Biol. 2006, 10, 402– 408.
32. Wortmann, A.; Kistler-Momotova, A.; Zenobi, R.; Heine, M. C.; Wil-helm, O.; Pratsinis, S. E. Shrinking Droplets in Electrospray Ionization and Their Influence on Chemical Equilibria. J. Am. Soc. Mass Spectrom.
2007,18, 385–393.
33. Daniel, J. M.; Friess, S. D.; Rajagopalan, S.; Wendt, S.; Zenobi, R. Quantitative Determination of Noncovalent Binding Interactions Using Soft Ionization Mass Spectrometry. Int. J. Mass Spectrom. 2002, 216, 1–27. 34. Daniel, J. M.; McCombie, G.; Wendt, S.; Zenobi, R. Mass Spectrometric Determination of Association Constants of Adenylate Kinase with Two Noncovalent Inhibitors. J. Am. Soc. Mass Spectrom. 2003, 14, 442– 448. 35. Wendt, S.; McCombie, G.; Daniel, J.; Kienhofer, A.; Hilvert, D.; Zenobi,
R. Quantitative Evaluation of Noncovalent Chorismate Mutase-Inhibi-tor Binding by ESI-MS. J. Am. Soc. Mass Spectrom. 2003, 14, 1470 –1476. 36. Tjernberg, A.; Carno, S.; Oliv, F.; Benkestock, K.; Edlund, P. O.; Griffiths, W. J.; Hallen, D. Determination of Dissociation Constants for Protein-Ligand Complexes by Electrospray Ionization Mass Spectrometry. Anal.
Chem. 2004, 76, 4325– 4331.
37. Wortmann, A.; Rossi, F.; Lelais, G.; Zenobi, R. Determination of Zinc to -Peptide Binding Constants with Electrospray Ionization Mass Spec-
trometry. J. Mass Spectrom. 2005, 40, 777–784.
38. Gabelica, V.; Galic, N.; Rosu, F.; Houssier, C.; De Pauw, E. Influence of Response Factors on Determining Equilibrium Association Constants of Noncovalent Complexes by Electrospray Ionization Mass Spectrometry.
J. Mass Spectrom. 2003, 38, 491–501.
39. Chitta, R. K.; Rempel, D. L.; Gross, M. L. Determination of Affinity Constants and Response Factors of the Noncovalent Dimer of Grami-cidin by Electrospray Ionization Mass Spectrometry and Mathematical Modeling. J. Am. Soc. Mass Spectrom. 2005, 16, 1031–1038.
40. Daubenfeld, T.; Bouin, A. P.; van der Rest, G. A deconvolution method for the separation of specific versus nonspecific interactions in nonco-valent protein-ligand complexes analyzed by ESI-FT-ICR mass spec-trometry. J. Am. Soc. Mass Spectrom. 2006, 17, 1239 –1248.
41. Sun, J. X.; Kitova, E. N.; Wang, W. J.; Klassen, J. S. Method for Distinguishing Specific from Nonspecific Protein-Ligand Complexes in Nanoelectrospray Ionization Mass Spectrometry. Anal. Chem. 2006, 78, 3010 –3018.
42. Fukamizo, T. Chitinolytic Enzymes: Catalysis, Substrate Binding, and Their Application. Curr. Protein Pept. Sci. 2000, 1, 105–124.
43. Dennhart, N.; Letzel, T. Mass Spectrometric Real-Time Monitoring of Enzymatic Glycosidic Hydrolysis, Enzymatic Inhibition, and Enzyme Complexes. Anal. Bioanal. Chem. 2006, 386, 689 – 698.
44. Yan, H.; Tsai, M.-D. Mechanism of Enzyme Action, Part A, Vol. 73; John Wiley and Sons: Gainesville, FL, 1999, pp. 103–134.
45. Zhu, X. T.; Kim, J. L.; Newcomb, J. R.; Rose, P. E.; Stover, D. R.; Toledo, L. M.; Zhao, H. L.; Morgenstern, K. A. Structural Analysis of the Lymphocyte-Specific Kinase Lck in Complex with Nonselective and Src Family Selective Kinase Inhibitors. Struct. Folding Design 1999, 7, 651– 661.
46. Fabian, M. A.; Biggs, W. H.; Treiber, D. K.; Atteridge, C. E.; Azimioara, M. D.; Benedetti, M. G.; Carter, T. A.; Ciceri, P.; Edeen, P. T.; Floyd, M.; Ford, J. M.; Galvin, M.; Gerlach, J. L.; Grotzfeld, R. M.; Herrgard, S.; Insko, D. E.; Insko, M. A.; Lai, A. G.; Lelias, J. M.; Mehta, S. A.; Milanov, Z. V.; Velasco, A. M.; Wodicka, L. M.; Patel, H. K.; Zarrinkar, P. P.; Lockhart, D. J. A Small Molecule-Kinase Interaction Map for Clinical Kinase Inhibitors. Nat. Biotechnol. 2005, 23, 329 –336.
47. Clark, S. M.; Konermann, L. Determination of Ligand-Protein Dissoci-ation Constants by electrospray Mass Spectrometry-Based Diffusion Measurements. Anal. Chem. 2004, 76, 7077–7083.
48. Imoto, T.; Johnson, L. N.; North, A. C. T.; Phillips, D. C.; Rupley, J. A.
49. Schindler, M.; Assaf, Y.; Sharon, N.; Chipman, D. M. Mechanism of Lysozyme Catalysis—Role of Ground-State Strain in Subsite-D in Hen Egg-White and Human Lysozymes. Biochemistry 1977, 16, 423– 431. 50. Valentine, S. J.; Anderson, J. G.; Ellington, A. D.; Clemmer, D. E.
Disulfide-Intact and -Reduced Lysozyme in the Gas Phase: Conformations and Pathways of Folding and Unfolding. J. Phys. Chem. B 1997, 101, 3891–3900. 51. RCSB Protein data bank, e. B.
52. Hunter, C. L.; Mauk, A. G.; Douglas, D. J. Dissociation of Heme from Myoglobin and Cytochrome b(5): Comparison of Behavior in Solution and the Gas Phase. Biochemistry 1997, 36, 1018 –1025.
53. Rogniaux, H.; Van Dorsselaer, A.; Barth, P.; Biellmann, J. F.; Barbanton, J.; van Zandt, M.; Chevrier, B.; Howard, E.; Mitschler, A.; Potier, N.; Urzhumtseva, L.; Moras, D.; Podjarny, A. Binding of Aldose Reductase Inhibitors: Correlation of Crystallographic and Mass Spectrometric Studies. J. Am. Soc. Mass Spectrom. 1999, 10, 635– 647.
54. Bellinzoni, M.; Haouz, A.; Grana, M.; Munier-Lehmann, H.; Shepard, W.; Alzari, P. M. The Crystal Structure of Mycobacterium tuberculosis Adenylate Kinase in Complex with Two Molecules of ADP and Mg2⫹ Supports an Associative Mechanism for Phosphoryl Transfer. Protein
Sci. 2006, 15, 1489 –1493.
55. Berry, M. B.; Bae, E. Y.; Bilderback, T. R.; Glaser, M.; Phillips, G. N. Crystal Structure of ADP/AMP Complex of Escherichia coli Adenylate Kinase. Proteins Struct. Funct. Bioinformatics 2006, 62, 555–556. 56. Kebarle, P. A Brief Overview of the Present Status of the Mechanisms
Involved in Electrospray Mass Spectrometry. J. Mass Spectrom. 2000, 35, 804 – 817.
57. Peschke, M.; Verkerk, U. H.; Kebarle, P. Features of the ESI Mechanism that Affect the Observation of Multiply Charged Noncovalent Protein Complexes and the Determination of the Association Constant by the Titration Method. J. Am. Soc. Mass Spectrom. 2004, 15, 1424 –1434.
343 J Am Soc Mass Spectrom 2008, 19, 332–343 PROTEIN-LIGAND KDs MEASURED WITH ESI, nanoESI, AND ESSI