Printed in Great Britain. All rights reserved © 1987 ICIPE—ICIPE Science Press
FACTORS INFLUENCING THE LIFE TABLE STATISTICS
OF THE CASSAVA MEALYBUG
PHENACOCCUS MANIHOTI
F. SCHULTHESS1, J. U. BAUMGARTNER2
and H. R. HERREN1
'International Institute of Tropical Agriculture, Oyo Road, PMB 5320, Ibadan Nigeria; 'Institute of Phytomedicine, Swiss Federal Institute of Technology, 8092 Zurich, Switzerland
(Received 27 November 1986)
Abstract—Detailed age-specific life table studies were carried out under controlled conditions to measure the effect of temperature, leaf quality (= age), variety and plant drought stress on net production rate (RQ), intrinsic rate of increase (rm) and generation time (G) of Phenacoccus manihoti Mat.-Ferr. in order to explain changes in population densities observed in the field. The developmental threshold calculated from our data and results published by various authors was 14.7°C. At 35°C all mealybugs died before reaching the adult stage. Mealybugs reared on leaves of different ages showed little differences in rm, and the higher occurrence of P. manihoti on plant tips and oldest leaves could not be explained with better nutritive value of these plant parts alone. Cassava varieties have a strong influence on the intrinsic rate of increase, which could explain differences in results published by other authors. Plant drought stress had little influence on the life table statistics, but rainfall is assumed to be a determinant factor in the dynamics of the mealybug.
Key Words: Age-specific life tables, temperature, leaf quality, variety, plant drought stress
Resume—Des etudes visant a etablir une table de survie detaillee par categories d'age ont ete menees en environnement controle arm d'evaluer l'impact de la temperature, de la qualite du feuillage (age), de la variete et des contraintes hydriques sur le taux de production net (/?o)> ^e taux de croissance intrinseque (rm) et la duree des generations (G) de Phenacoccus manihoti Mat.-Ferr. Ces experiences permettent d'expliquer 1'evolution de la densite des populations d'insectes telle qu'on peut l'observer en milieu reel. Le seuil de developpement calcule a partir de nos donnees est de 14,7°C, et correspond aux resultats deja publies par plusieurs scientifiques. A 35°C, toutes les cochenilles meurent avant d'avoir atteint l'age adulte. Les insectes eleves sur des feuilles d'ages differents ont quasiment le meme rm. La plus grande incidence de P. manihoti a l'extremite des plants et sur les feuilles plus vieilles n'est pas seulement due a la meilleure valeur nutritive de ces parties vegetales. Les varietes de manioc exercent une forte influence sur le taux de croissance intrinseque, ce qui peut expliquer les divergences apparaissant dans les resultats publies par d'autres auteurs. Les contraintes hydriques ont peu d'impact sur les donnees statistiques de la table de survie, bien que la pluviometrie semble constituer un facteur determinant de la dynamique des populations de cochenilles du manioc.
Mots Clefs: Tables de survie par categories d'age, temperature, qualite du feuillage, variete, contraintes hydriques
INTRODUCTION conditions for the cassava mealybug and building
TT „ T I , . , . T . . . ., population models (Gutierrez et al., this Issue).
H. R. Herren (this Issue) gives an overview on the r v K importance of the cassava mealybug, Phenacoccus
manihoti Mat.-Ferr. (Horn., Pseudococcidae), as a MATERIALS AND METHODS
pest in Africa's cassava fields. In addition he presents
not only the results of biological control work, but Experimental procedures
recognizes also the importance of basic ecological Five factors are recognized to be important for studies in the cassava cropping system. For such the cassava mealybug life system: temperature, air studies the systems approach provides the necessary humidity, leaf quality, variety and drought stress. Air theoretical background for the work on the popu- humidity is treated elsewhere (Le Ru and Fabres, lation dynamics off. manihoti and yield formation of 1986) and is therefore omitted in the experimental its host plant. This paper focuses on the dynamics of part of this work. For each of the remaining factors P. manihoti and presents age-specific life tables for several levels are chosen which represent the experi-different ecological situations characterized by vari- mental conditions for the life table studies. Experi-ous factors. These life tables provide an under- ment A evaluates the temperature influence, B refers standing of how various biotic and abiotic factors to leaf quality studies, C considers varietal influences, change pest population densities in the field; an and D explores the influence of drought stress at understanding essential for creating optimal rearing different temperature levels.
removed. Twenty-four hr later, newly laid eggs were collected and transferred to 10 clip cages attached to leaves of potted plants and kept under controlled conditions. Each cage contained 10 to 15 eggs, the development of which was observed daily. Emerged crawlers (40 for each temperature level in A and D, 32 for each level in experiment C) were transferred to other clip cages and kept individually or in pairs (C). In daily observations time of moulting and survivor-ship among immature stages were determined. The remaining eggs were further observed for more de-tailed hatchability studies. In experiment B the eggs were first transferred to Petri dishes that contained two filter papers, a dry one on the bottom and one that was kept constantly humid under the cover. A total of 240 newly moulted crawlers were transferred from this rearing unit to leaf lobes and growing tips in 80 similarly prepared Petri dishes (20 per level). To facilitate observations only two folded leaves of about 10 mm were left on a tip. Thus each Petri dish contained three lobes or three tips with one individual on each. Lobes and tips were replaced every 2 days. After the crawlers had moulted to the second instar, 30 individuals per level were observed as in the above experiment. In all the experiments, ovisacs were removed daily after ovipositing started and eggs were counted under the binocular to determine age-specific fecundity and survivorship.
Thermal conditions. Five levels were used to
evaluate the influence of temperature: 20, 24, 28, 32 and 35°C. The relative air humidity could not be controlled satisfactorily and ranged between 65 and 95%. The variety used in this experiment was TMS 30572. The plants were watered three times in 10 days.
Leaf quality. To investigate the development of P. manihoti on different plant parts, four different
qualities of leaves were considered in this experiment. As a surrogate for leaf quality the position of the leaf in the plant, which determines its age, was used. Thus, the levels of the factor leaf quality consisted of oldest, medium, and youngest leaves and tips, of the variety TMS 30572. The temperature used in this experiment was 28°C.
Variety. The monitoring of pest populations every
2 weeks showed higher densities on local varieties than on improved IITA varieties (Hammond et al., this issue). To study the varietal influence on the development of P. manihoti, two fast-growing leafy IITA varieties, i.e., TMS 30572 (bitter) and TMS 91934 (bitter), and three local varieties, i.e., the early branching cultivar Ege dudu (bitter), Odongbo (bitter), and Isunikankiyan (sweet), which produce low leaf area indices, were chosen. The constant temperature used during this experiment was 28°C.
Drought stress and temperature. Outbreaks of P. manihoti during the dry season in the absence of
natural enemies could be related to two factors, i.e., the absence of the rain as a natural control factor and favourable changes in the physiology of the plant under drought stress that increase the nutritional value of the food (Fabres, 1981; Fabres and Le Ru, 1986). To separate these two factors, potted plants
in 10 days. In addition, the surface temperature of five leaves was measured with a thermocouple in both treatments and under each constant temperature 30 times during 3 days.
Statistical analysis
Temperature-dependent development and physio-logical time. The inverse of the duration in days (R)
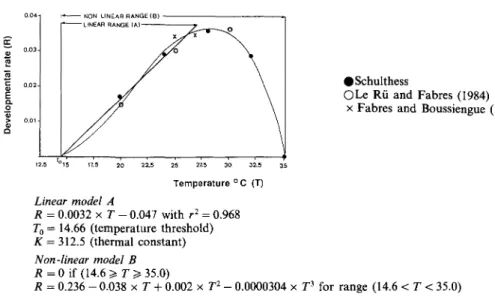
from egg to egg in experiment A was plotted against the rearing temperature (T; Fig. 1). In addition data reported in the literature were also considered (Fabres and Boussiengue, 1981; Le Rii and Fabres, 1986). Two different models were used for describing this relationship. Following Campbell et al. (1974), the model
R(T) = a+b x T [A]
was used for the linear range of the relationship. Consequently the regression line cuts the abscissa at
the temperature threshold (To) whereas the reciprocal
of the slope (b) is the thermal constant K, i.e. the number of degree days to complete the pre-reproductive phase. This model enables the definition of physiological time in units of degree days (Gilbert
et al., 1976). For the whole temperature range
permit-ting development (Fig. 1), however, the non-linear polynomial model of Harcourt and Yee (1982) was used.
R(T) = ao + al [B]
According to this non-linear model, physiological time is expressed as a proportion of pre-reproductive development (Stinner et al., 1974).
Life table analysis. Figure 2 shows development
of immature stages, age-specific fecundity and sur-vivorship for the non-stress treatment at 28°C. For this experiment and all remaining life tables, the
summary statistics RQ (net reproductive rate), rm
(intrinsic rate of increase) and G (generation time) were calculated after Birch (1948) with an algorithm provided by A. P. Gutierrez (pers. commun). The statistics as affected by temperatures are presented in Fig. 3. The time is expressed in both days and degree-days. For the discussion, however, only days were used to facilitate comparison with the literature.
Additionally, rm is used to compare the factor
tem-perature with corresponding data reported elsewhere (Fig. 4). The influence of the leaf quality and variety factors is shown in Tables 1 and 2; a comparison of the same statistics for insects reared on stressed and non-stressed plants is presented in Table 3.
RESULTS
Threshold estimation and developmental rate
The relationship between P. manihoti development and temperature is shown in Fig. 3. The rate of development was linear between 20 and 27.5°C (model A, Gilbert et al., 1976). At 28°C the devel-opmental rate (R) began to depart from linearity and declined at 32°C. No development occurred at 35°C where all nymphs died before reaching the pre-ovipositing adult stage. The calculated developmental
853
#Schulthess
OLe Rii and Fabres (1984) x Fabres and Boussiengue (1981)
Temperature °C (T)
Linear model A
R = 0.0032 x T - 0.047 with r2 = 0.968
To = 14.66 (temperature threshold)
K = 312.5 (thermal constant) Non -linear model B R = 0 if (14.6 Js T > 35.0)
R = 0.236 - 0.038 x T + 0.002 x T1- 0.0000304 x T3 for range (14.6 < T < 35.0) Fig. 1. The developmental rate for pre-reproductive life stages of Phenacoccus manihoti as a function of
temperature. Two models (A, B) are used to describe this relationship and are discussed in the text.
threshold in model A, i.e., where R equals zero, was 14.7°C and the thermal constant K, i.e., the number of degree-days to complete the pre-reproductive phase, was 312.5. Hence, the non-linear polynomial model (model B) after Harcourt and Yee (1982) was used to predict the development of P. manihoti between the
calculated lower developmental threshold (To) and
35°C. The observed data points fitted the prediction curve satisfactorily. The equations for both functions are presented in Fig. 2.
Net reproduction rate. Several authors observed
highest Ro between 20 and 24°C (Lema and Herren,
1985; Fabres and Le Rii, 1986; Nsiame She, 1986). In
our experiment, Ro was highest at 28°C and decreased
rapidly afterwards to zero at 35°C (Fig. 3). At this extreme temperature all nymphs died before reaching the preovipositing stage and no life table statistics could be calculated. The highest reproduction rate was in the range of those reported by Le Rii and Fabres (1986) but was substantially lower than those calculated by Lema and Herren (1985) and Nsiame She (1986), who used a sweet variety (TMS 3001) in their experiments.
Generation time. The mean generation time (G) in
days decreased from 81 days at 20°C to 35 days at 32°C. At 20°C G was considerably higher than
re-Fig. 2. Development time of immature stages (EGG = eggs; LI, L2, L 3 = larvae and nymphs; PREOVI = pre-reproductive adult stage), age-specific fecundity rate (mx) and survivorship (lx) of Phenacoccus manihoti at 28°C.
ported by other authors (Le Rii and Fabres, 1986; Lema and Herren, 1985; Nsiame She, 1986) but was similar in the medium and upper temperature range.
Intrinsic rate of increase. Figure 4 shows a
com-parison of rm values published by different authors. In
our experiments rm calculated on a day basis reached
a maximum of 0.18 at 28°C and decreased afterwards to 0.12 at 32°C. Lema and Herren (1985) and Nsiame
She (1986) reported optimum rm values that remained
on a similar level between 28 and 32.5°C. In the experiments of Le Rii and Fabres (1986) the highest
rm, 0.214, was reached at 30°C. It should be noted
that Le Rii and Fabres (1986) used an approximation of rm (rc) which proved to be strongly correlated with
the rm (Le Rii and Papierok, 1986). In our and Lema
and Herren's (1985) experiments, no oviposition was observed at 35 and 34°C, respectively, whereas Nsiame She (1986) obtained a still considerably high
rm of 0.104 at 34°C.
Influence of leaf quality on the life table statistics
Studies on the within-plant distribution of P.
manihoti showed a higher aggregation on the oldest
leaves and the growing tips. A similar distribution was observed for aphids and attributed to the higher nutritive value of these plant parts (Kennedy, 1958). The life table studies on P. manihoti reared on leaves of different ages and tips, however, resulted in
a highest rm for oldest leaves, but lowest for tips
(Table 1). Generally, the differences between the rm
values were small and rm ranged from 0.1715 to
0.1774. The net reproduction rates were between 230.9 on the oldest leaves and 329 on the medium leaves; the low RQ on the oldest leaves was compen-sated for by the shortest generation time observed in these experiments. As opposed to the above experi-ments, mealybugs in these studies were reared on detached leaf lobes. But this procedure did not
appear to affect rm to a great extent.
Varietal influence
Table 2 presents the life table statistics of P.
3 0 0 200 100 -0.20 -, 0.16 0.12 0.08 0.04 -90 _ odd • d 0.018 0.016 0.014 0.012 - 400 - 200 10 20 30 Temperature ° C
Fig. 3. Net reproduction rate (i?0), intrinsic rate of increase (rm) and generation time (G) for Phenacoccus
manihoti as a function of temperature with time expressed in days (d) and degree-days (dd).
~E 0.24-. . 0 2 0 " I b 0 . 1 6 -^ 0.12-g 0.08-E 0.04-Temperature ° C TNsiame She (1986) A L e Rii and Fabres (1984) OLema and Herren (1982) • Schulthess
Fig. 4. Intrinsic rate of increase (/•„,) as a function of temperature for P. manihoti published by different authors.
T a b l e 1. Influence of leaf q u a l i t y o n the life table statistics of Phenacoccus manihoti Leaf q u a l i t y rm Ro G Old leaf Medium leaf Youngest leaf Growing tip 0.1774 0.1724 0.1740 0.1715 230.93 31.87 329.23 35.03 323.75 34.92 273.73 34.22
variety had a greater influence than the leaf
quali-ty.The rm ranged from 0.157 on TMS 91934 to 0.174
on the local variety Ege dudu, which also had the second highest net reproductive rate and the shortest generation time. The widely distributed local variety
Odongbo, however, had the second lowest rm
ob-served in these experiments. Mealybugs reared on the sweet variety Isunikankiyan had the highest R^ but also the longest generation time.
surface temperature °C (Ts) (stressed leaf)
Fig. 5. Differences in leaf temperature on stressed (Ts) and non-stressed (Tns) plants as a function of Ts in consecutive measurements.
Mealybug life table statistics 855
Table 2. Influence of the cassava variety on the life table statistics of Phenacoccus manihoti
Variety
91934 (bitter, improved, resistant) ODONGBO (bitter, local, susceptible) ISUNIKANKYIAN (sweet, local, susceptible) 30572 (bitter, improved, susceptible) EGE D U D U (bitter, local, susceptible)
rm 0.1573 0.1612 0.1636 0.1641 0.1704 *o 357.44 356.19 467.91 358.19 414.68 G 39.80 38.27 40.21 37.79 37.67
Influence of drought stress
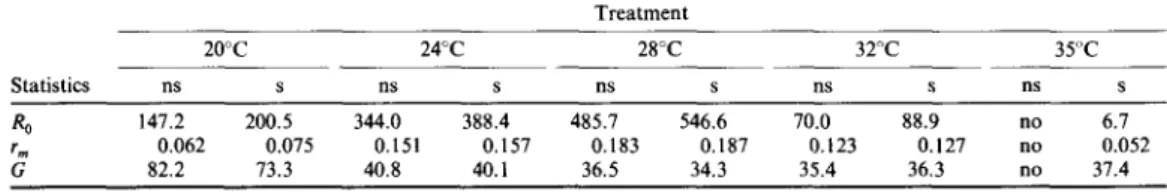
Table 3 shows the life table statistics from the stress and non-stress experiments at different constant
tem-peratures. Generally, the calculated rm and R^ values
tended to be higher on stressed plants, the differences, however, were very small in comparison to those found by Fabres and Le Rii (1986) in a similar
experiment. The biggest differences in Ro and G were
found at the lowest and the highest temperature levels; at 35°C eggs were laid only on stressed plants. The measurement of leaf temperature showed in-creasing differences between stressed and
non-stressed plants as Ts increased. Daily mean difference
reached a maximum of 1.6°C at a Ts of 28.5°C and
then decreased. At the higher Ts range (30-34°C) the
temperature on stressed leaves was lower than on non-stressed.
DISCUSSION
The temperature threshold at 14.7°C, calculated from the linear relationship in Fig. 2, was 10° higher than the value found by Nsiame She (1986). How-ever, Nsiame She used the entire temperature range from 20 to 34°C to describe the R-T relationship, which started to deviate from linearity at 27°C. The
TQ of 14.7°C is also in the range of the value found
for the host plant (13.0°C; Keating and Evenson, 1979), the cassava green mite Mononychellus tanajoa (Bondar) sensu lato (14.4°C; Yaninek, this Issue), and the parasitic wasp Epidinocarsis lopezi (De Santis) (15.4°C; Lohr, pers. commun.) and will be used in further studies on the dynamics of P. manihoti.
There are differences in G and Ro according to leaf
quality, but rm does not differ greatly. As expected,
other factors not considered here are more important for explaining the within-plant distribution. Field observations confirm the results of the study by Fabres and Le Rii (1986) who found that the move-ment of mealybugs within the plant and between the ground and the plant must also be taken into account. In addition mortality factors like natural enemies and wind could act differently on different strata of the plant and thereby change the distribution.
As shown in Table 2, the cassava variety influenced the development of P. manihoti population growth to
a greater extent than did age ( = quality) of plant parts. This could explain the different life table statistics published by other authors (Fig. 3). Thus, Lema and Herren (1985) and Nsiame She (1986) reported considerably higher R^ and lower G values for P. manihoti reared on the sweet variety TMS 3001. Yaninek (this issue) also found the highest fecundity for M. tanajoa reared on the sweet variety Isunikankiyan. This could indicate an antibiotic effect of the cyanide content in the "bitter" cassava leaves. However, further research is needed to confirm this conclusion. On the other hand, the
relatively low rm value found on the popular local
variety Odongbo is in opposition to the development of considerably higher mealybug densities in the field on this cultivar as observed by Schulthess (un-published data) and Hammond et al. (this issue). Thus, further studies on plant-pest and host-plant-natural enemies interaction are needed to ex-plain these differences in P. manihoti population densities.
Plant drought stress mainly influenced the net
reproduction rates and had little effect on rm and G
in the medium temperature range where the differences in the life table statistics can mainly be explained with differences in leaf temperature. At 20 and 35°C, however, the leaf temperatures in both treatments were nearly the same and the differences
in rm were high, which may point to a change of the
nutritive value of the phloem sap if stress is applied under these extreme temperatures. In general, daily average temperatures in Nigeria's cassava growing areas are rarely outside the range of 24-30°C. For this temperature range differences in the life table statistics due to drought stress are rather small and, hence, are unlikely to explain mealybug outbreaks in the dry season. Additional factors not discussed in this work appear more important for reducing densi-ties during the rainy season. Among them is the mechanical effect of the rain (Fabres, 1981) and the incidence of entomophagous fungi (Le Rii, 1986), while air humidity has little influence (Le Rii and Fabres, 1986).
Table 3. Comparison of the life table statistics of Phenacoccus manihoti reared on stressed and non-stressed plants
Statistics «o rm G 20 ns 147.2 0.062 82.2 °C s 200.5 0.075 73.3 24= ns 344.0 0.151 40.8 C s 388.4 0.157 40.1 Treatment 28°C ns s 485.7 546.6 0.183 0.187 36.5 34.3 32' ns 70.0 0.123 35.4 C s 88.9 0.127 36.3 ns no no no 35"C s 6.7 0.052 37.4 no = no oviposition.
Campbell A., Frazer B. D., Gilbert N., Gutierrez A. P. and Mackauer M. (1974) Temperature requirements of some aphids and their parasites. J. Appl. Ecol. 11, 431-438. Fabres G. (1981) Dynamics of cassava mealybug
popu-lations in the People's Republic of Congo. Proc. of the
first Triennial Root Crop Symp. of the Int. Soc. for Tropical Root Crops Africa Branch, 8—12 September 1980,
Ibadan, Nigeria.
Fabres G. and Boussiengue J. (1981) Bioecologie de la cochenille du manioc Phenacoccus manihoti (Horn. Pseu-dococcidae) en Republique Populaire du Congo. Extrait
de VAgronomie Tropicale XXXVI—1 Janvier-mars 1981,
pp. 6-13.
Fabres G. and Le Rii B. (1986) Etude des relations plant-insecte pour la mise au point de methodes de regulation des populations de la cochenille du manioc. In "La
cochenille du manioc et sa biocoenose au Congo,
1979-1984", Travaux de Vequipe Franco-Congolaise
ORSTOM-DGRS, Brazzaville, BP 181, RP du Congo.
Gilbert N., Gutierrez A. P., Frazer B. D. and Jones R. E. (1976) Ecological Relationships. Freeman, Reading and San Francisco.
Harcourt D. G. and Yee J. M. (1982) Polynomial algorithm for predicting the duration of insect life stages. Environ.
Ent. 11, 581-584.
Keating B. A. and Evenson J. P. (1979) Effect of soil temperature on sprouting and sprout elongation of stem cuttings of cassava (Manihot esculenta Crantz) Field
Crops Res. 5, 271-281.
Kennedy J. S. (1958) Physiological condition of the host-plant and susceptibility to aphid attack. Ent. Exp. Appl. 1, 11-65.
165-169.
Le Ru B. and Fabres G. (1986) Influence de la temperature et de l'hygrometrie relative sur le taux d'accroissement des populations de la cochenille du manioc, Phenacoccus
manihoti (Horn. Pseudococcidae) au Congo. In "La co-chenille du manioc et sa biocoenose au Congo 1979-1984". Travaux de Vequipe Franco-Congolaise ORSTOM-DGRS, Brazzaville, BP 181, RP du Congo, p. 39-55.
Le Ru B. and Papierok B. (1986) Taux intrinseque d'accroissement naturel de la cochenille du manioc,
Phenacoccus manihoti Matile-Ferrero (Homopteres, Pseudococcidae). Interet d'une methode simplifiee d'estimation de rm. In "La cochenille du manioc et sa
biocoenose au Congo 1979-1984". Travaux de Vequipe Franco-Congolaise ORSTOM-DGRS, Brazzaville BP
181, RP du Congo, pp. 14-26.
Le Rii B. (1986) Etude de revolution d'une mycose a
Neozygites fumosa (Zygomycetes, Entomophthorales)
dans une population de la cochenille du manioc
Phenacoccus manihoti (Horn.: Pseudococcidae). In "La cochenille du manioc et sa biocoenose au Congo,
1979-1984", Travaux de Vequipe Franco-Congolaise
ORSTOM-DGRS, Brazzaville, BP 181, RP du Congo.
Nsiame She H. D. (1986) The bioecology of the predator,
Hyperaspis jucunda Muls (Coleoptera, Coccinellidae) and
the temperature response of its prey, the cassava mealy-bug, Phenacoccus manihoti Mat.-Fer. (Homoptera, Pseu-dococcidae). Thesis in the Department of Agricultural Biology, University of Ibadan, Ibadan, Nigeria. Stinner R. E., Gutierrez A. P. and Butler G. D. (1974) An
algorithm for temperature growth rate simulation. Can.