HAL Id: hal-02496865
https://hal.archives-ouvertes.fr/hal-02496865
Submitted on 9 Nov 2020
HAL is a multi-disciplinary open access
archive for the deposit and dissemination of
sci-entific research documents, whether they are
pub-lished or not. The documents may come from
teaching and research institutions in France or
abroad, or from public or private research centers.
L’archive ouverte pluridisciplinaire HAL, est
destinée au dépôt et à la diffusion de documents
scientifiques de niveau recherche, publiés ou non,
émanant des établissements d’enseignement et de
recherche français ou étrangers, des laboratoires
publics ou privés.
Djivan Prentout, Olga Razumova, Benedicte Rhone, Hélène Badouin, Hélène
Henri, Cong Feng, Jos Käfer, Gennady Karlov, Gabriel A.B. Marais
To cite this version:
Djivan Prentout, Olga Razumova, Benedicte Rhone, Hélène Badouin, Hélène Henri, et al.. An
effi-cient RNA-seq-based segregation analysis identifies the sex chromosomes of Cannabis sativa. Genome
Research, Cold Spring Harbor Laboratory Press, 2020, 30 (2), pp.164-172. �10.1101/gr.251207.119�.
�hal-02496865�
An efficient RNA-seq-based segregation analysis
identifies the sex chromosomes of Cannabis sativa
Djivan Prentout,
1Olga Razumova,
2,3Bénédicte Rhoné,
1,4Hélène Badouin,
1Hélène Henri,
1Cong Feng,
5,6Jos Käfer,
1Gennady Karlov,
2and Gabriel A.B. Marais
11
Laboratoire de Biométrie et Biologie Évolutive UMR 5558, Université Lyon 1, CNRS, F-69622 Villeurbanne, France;
2Laboratory
of Applied Genomics and Crop Breeding, All-Russia Research Institute of Agricultural Biotechnology, Moscow 127550, Russia;
3N.V. Tsitsin Main Botanical Garden of Russian Academy of Sciences, Moscow 127276, Russia;
4Institut de Recherche pour le
Développement, UMR DIADE, IRD, Université de Montpellier, F-34394 Montpellier, France;
5Chongqing Medical University, Yuzhong
District, Chongqing, 400016, China;
6BGI-Shenzhen, Beishan Industrial Zone, Yantian District, Shenzhen 518083, China
Cannabis sativa
–derived tetrahydrocannabinol (THC) production is increasing very fast worldwide. C. sativa is a dioecious
plant with XY Chromosomes, and only females (XX) are useful for THC production. Identifying the sex chromosome
se-quence would improve early sexing and better management of this crop; however, the C. sativa genome projects have failed
to do so. Moreover, as dioecy in the Cannabaceae family is ancestral, C. sativa sex chromosomes are potentially old and thus
very interesting to study, as little is known about old plant sex chromosomes. Here, we RNA-sequenced a C. sativa family
(two parents and 10 male and female offspring, 576 million reads) and performed a segregation analysis for all C. sativa genes
using the probabilistic method SEX-DETector. We identified >500 sex-linked genes. Mapping of these sex-linked genes to a
C. sativa genome assembly identified the largest chromosome pair being the sex chromosomes. We found that the X-specific
region (not recombining between X and Y) is large compared to other plant systems. Further analysis of the sex-linked genes
revealed that C. sativa has a strongly degenerated Y Chromosome and may represent the oldest plant sex chromosome system
documented so far. Our study revealed that old plant sex chromosomes can have large, highly divergent nonrecombining
regions, yet still be roughly homomorphic.
[Supplemental material is available for this article.]
Cannabis sativa is an ancient crop (Schultes et al. 1974) with two main traditional uses: marijuana and hemp (Small 2015). Marijuana, which is used in folk medicine, as a recreational drug, and lately in conventional medicine (Alexander 2016), has a nar-cotic effect owing to tetrahydrocannabinol (THC) and other can-nabinoids produced in high concentration by some C. sativa cultivars. Until recently, the use of marijuana was prohibited in al-most all countries, but C. sativa–derived products with high THC concentrations are now legal, for example, in several US states, Australia, Germany, Peru, and the UK for medicinal purposes (Offord 2018) and also in Uruguay, Canada, and several US states for recreational use (Yeager 2018). In the US, marijuana legal econ-omy amounted to∼$17 billion in 2016 and may reach as much as $70 billion/year by 2021 (McVey 2017). However, legalization of marijuana is so recent that very few biotech tools have been devel-oped for high THC-producing C. sativa cultivars (Yeager 2018).
THC reaches the highest concentrations in female inflores-cences (bracts), so that only female C. sativa plants are of economic importance; furthermore, pollinated female plants produce small-er inflorescences and thsmall-erefore less THC (Small 2015). It is thus im-portant to avoid growing male plants as they are a waste of resources, labor, and space. Interest in hemp is also increasing as it is a crop for the sustainable production of fibers and oils (Andre et al. 2016; Salentijn et al. 2019). Hemp cultivars usually have a low level of THC and can be legally grown in many coun-tries where marijuana is illegal. Features of male and female
hemp plants differ, and early sexing is also useful (Salentijn et al. 2019).
Sexual dimorphism in C. sativa is weak as in many dioecious plants (Barrett and Hough 2013), and sex can be determined with certainty only when the plants start flowering (Small 2015). C. sat-iva is a dioecious plant in which sex is determined by an XY Chromosome pair (Divashuk et al. 2014). So far, a few Y-linked ge-netic markers have been identified and are used to sex C. sativa seedlings (e.g., Techen et al. 2010). However, it is not known whether these markers work with all cultivars. The C. sativa sex chromosomes sequences would thus be an important genomic re-source that could help improve agricultural yields. Currently, the C. sativa genome projects (van Bakel et al. 2011; Grassa et al. 2018; Laverty et al. 2019) have failed to identify the sex chromo-somes, despite chromosome-level assemblies in the latest projects. C. sativa is one of 15,600 dioecious species of flowering plants (Renner 2014). Dioecy and sex chromosomes have evolved multi-ple times in plants (Renner 2014), but very few plant systems have been studied in detail (Ming et al. 2011; Charlesworth 2015; Muyle et al. 2017). Historically, sex chromosomes have been classi-fied using results from light microscopy (Ming et al. 2011). The terms homomorphic and heteromorphic refer to these results, with the former being roughly of similar size and the latter clearly different (but see Palmer et al. 2019 for another definition of
Corresponding author: gabriel.marais@univ-lyon1.fr
Article published online before print. Article, supplemental material, and publi-cation date are at http://www.genome.org/cgi/doi/10.1101/gr.251207.119.
© 2020 Prentout et al. This article is distributed exclusively by Cold Spring Harbor Laboratory Press for the first six months after the full-issue publication date (see http://genome.cshlp.org/site/misc/terms.xhtml). After six months, it is available under a Creative Commons License (Attribution-NonCommercial 4.0 International), as described at http://creativecommons.org/licenses/ by-nc/4.0/.
Research
164 Genome Research
30:164–172 Published by Cold Spring Harbor Laboratory Press; ISSN 1088-9051/20; www.genome.org www.genome.orgheteromorphy). The extent to which recombination is suppressed between the sex chromosomes largely explains whether a sex chro-mosome pair becomes heteromorphic or not (Charlesworth et al. 2005; Bergero and Charlesworth 2009). Homomorphic XY tend to have large recombining regions and heteromorphic XY large nonrecombining ones. There is a loose correlation between the lev-el of heteromorphy and age, but some old homomorphic systems have been described in animals and algae (e.g., Toups and Hahn 2010; Vicoso et al. 2013; Ahmed et al. 2014; Yazdi and Ellegren 2014). In plants, a model for the evolution of sex chromosomes heteromorphy with six stages has been proposed (Ming et al. 2011). In the initial stages, the sex chromosomes have small to in-termediate nonrecombining regions and are homomorphic. After some time has elapsed since recombination cessation, DNA se-quence and gene content can differ substantially in the nonrecom-bining X and Y regions, even though the sex chromosomes might be homomorphic under light microscopy (Ming et al. 2011; Wang et al. 2012; Veltsos et al. 2019). The well-studied heteromorphic sys-tems in plants are characterized by a Y Chromosome larger than the X due to fast accumulation of repeats on the former, as in Silene lat-ifolia or Coccinia grandis (Matsunaga et al. 1994; Sousa et al. 2013, 2016; Hobza et al. 2017), or multiple Y Chromosomes due to chro-mosomal fission–fusion events, as in Rumex species (Ming et al. 2011; Hough et al. 2014; Crowson et al. 2017). However, these sex chromosomes systems are still relatively young (less than 15 million years), and the late stages in the current model for the evolution of sex chromosomes heteromorphy in plants have not yet received attention from genomic studies. In particular, it is not clear whether the plant Y Chromosomes can shrink, as found in the ancient heteromorphic animal systems such as those of hu-mans and some Drosophila species (Bachtrog 2013).
The Cannabaceae and related families (Urticaceae, Moraceae) derive from a dioecious common ancestor (Zhang et al. 2019). Despite being of similar size (Divashuk et al. 2014), the sex chro-mosomes of C. sativa could thus be much older than those of the species studied so far. Here, we used a recently developed statistical tool to identify X- and Y-linked genes, SEX-DETector (Muyle et al. 2016). We applied SEX-DETector to C. sativa, inferred sex-linked genes, and used those genes to (1) identify the sex chromosomes of C. sativa in an available reference genome assembly, and (2) characterize the C. sativa XY system and compare it to other plant systems.
Results
Identifying sex-linked genes in C. sativa
SEX-DETector requires genotyping data from a cross (two parents and a few offspring individuals) (see Fig. 1). As explained in Muyle et al. (2016), patterns of allele transmission from parents to progeny differ for an autosomal or a sex-linked gene. For exam-ple, an allele only transmitted from father to sons is clearly indic-ative of a Y-linked allele. SEX-DETector relies on a probabilistic model that accounts for typical errors in genotyping data and is used to compute, for each gene, the probability of autosomal and sex-linked segregation types. This key feature of SEX-DETector makes it better at making inferences about segregation type than an empirical approach relying on data filtering to re-move genotyping errors would do (better sensitivity, similar specificity).
More than 576 million 50-bp single-end reads of the parents and five male and five female offspring were mapped to the
refer-ence transcriptome of van Bakel et al. (2011), and all individuals were genotyped (see Methods). From these data, 11,515 genes were inferred as autosomal and 565 as sex-linked (i.e., 4.6% of the genes for which SEX-DETector produced an assignment). The latter included 347 XY gene pairs and 218 X-hemizygous genes (i.e., genes lacking Y copies) (see Methods and Table 1).
Identifying the sex chromosome pair in C. sativa
A total of 363 sex-linked genes (out of the 555 that we could map) mapped to Chromosome 1 in the reference genome of Grassa et al. (2018): 166 out of 340 XY gene pairs (48.8%) and 197 out of 215 X-hemizygous genes (91.6%) (Fig. 2). This indicates that Chromosome pair 1 is the sex chromosome pair. The remaining 192 linked genes that could be mapped (i.e., 35% of all sex-linked genes) mapped to other chromosomes. Whether these genes are likely to be false positives or not is discussed below and inSupplemental Text S1. Note that, for the remaining analyses, we calculate statistics on all sex-linked genes as well as on the sex-linked genes from Chromosome 1 only.
Sex chromosomes typically have nonrecombining regions in which the synonymous divergence between the X and Y copies of a sex-linked gene (also called gametologs) can be substantial (Charlesworth 2015; Muyle et al. 2017). Using the sex-linked
B
A
C
Figure 1. Experimental design and bioinformatic pipeline to identify sex-linked genes. (A,B) The SEX-DETector analysis relies on obtaining gen-otyping data from a cross (parents + F1 progeny). (C ) SEX-DETector infers the segregation type based on how alleles are transmitted from parents to offspring. Three segregation types are included: autosomal (alleles of the parents are transmitted to the progeny the same way in both sexes, in a Mendelian way), XY (one allele of the father—the Y allele—is transmitted exclusively to sons), X-hemizygous (the single allele of the father is trans-mitted exclusively to daughters; the sons get one allele from the mother only). See Methods for more information. C. sativa male and female plants pencil illustration by annarepp/Shutterstock.com.
SNPs inferred by SEX-DETector, we are able to quantify the synon-ymous divergence (dS) between X and Y copies. The dSreaches 0.4
in the two most divergent XY gene pairs (Fig. 3A); furthermore, most XY gene pairs with high X-Y dSvalues mapped to a part of
Chromosome 1. Two regions can be distinguished on this chromo-some (Fig. 2): region 1 (from 30 to 105 Mb) where the XY gene pairs with the highest dSvalues are found (mean X-Y dS= 0.079, top 5%
X-Y dS= 0.32, top 10% X-Y dS= 0.28) and
where 58.6% of the sex-linked genes in the region are X-hemizygous, and region 2 (from 1 to 30 Mb) including mainly au-tosomal genes (791 genes, i.e., 96.1% of the genes in this region), in which the genes inferred as XY gene pairs show lit-tle divergence (mean X-Y dS= 0.014, top
5% X-Y dS= 0.05, top 10% X-Y dS=
0.04), and few X-hemizygous genes are present (only 9.3% of the sex-linked genes). These observations suggest gion 1 is the X-specific region (not re-combining in males) and region 2 the pseudo-autosomal region (= PAR, still re-combining in males).
Age of the C. sativa sex chromosome
system
We then used the 565 sex-linked genes to study the evolution of sex chromosomes in C. sativa. First, we used the dSvalues of
the XY gametologs and different molecu-lar clock estimates for plants to infer the age of the sex chromosomes on C. sativa. Using the maximum observed dS value
(0.4), we estimated that recombination suppression between X and Y Chromo-somes was initiated 26.7–28.6 million years (myr) ago in C. sativa. If we use the dS values of the 5% or 10% most
divergent gene pairs to be more conserva-tive when estimating the maximum X-Y divergence, we obtain more recent ages for the initial recombination suppression (17.3–20 myr old using the top 5% X-Y dS
values; 12–18.6 myr old using the top 10% X-Y dSvalues) (see Table 2).
Degeneration of the Y Chromosome and dosage compensation in
C. sativa
Second, we studied the extent of Y degeneration in C. sativa and estimated gene loss using the X-hemizygous genes. This measure of Y gene loss is, of course, a rough estimate as it reflects both true loss and simply the absence of expression of the Y copy in flower buds (Bergero and Charlesworth 2011; Bergero et al. 2015). SNP-based methods, such as ours, underestimate the number of X-hemizy-gous genes with respect to XY gene pairs, as X-hemizyX-hemizy-gous genes can only be detected when there is polymorphism in the X. To cor-rect for this, we compared the number of X-hemizygous genes (218) and the XY gene pairs with polymorphism in the X copy (89), and we found that∼70% of the Y-linked genes may have been lost in C. sativa. The results were similar when focusing on sex-linked genes found on Chromosome 1 only (72.5%).
To further study Y degeneration, we focused on the expression of the sex-linked genes. Allele-specific expression analysis at the XY gene pairs revealed a median Y/X expression ratio of 0.50 overall (347 genes) and 0.47 for Chromosome 1 genes only (166 genes) (see Fig. 3B), much lower than the expected 1.0 value in the case of equal Y/X expression (i.e., no Y degeneration). We found some evidence for dosage compensation, as in males expression of Table 1. Summary of the results of the SEX-DETector analysis
Numbers
All genesa 30,074
Genes with at least one SNP detected, used for SEX-DETector analysis
28,456 Genes with undetermined segregation typeb 16,381
Autosomal genes 11,510
All sex-linked genes 565
XY gene pairs 347
X-hemizygous genes 218
Estimated Y gene loss rate 70%
aTranscripts from gene annotation of the reference genome (van Bakel
et al. 2011).
bAll posterior probabilities < 0.8, or absence of SNPs without errors.
Figure 2. Distribution of the sex-linked and sex-biased genes onto the C. sativa reference genome. From outer to inner rings: (1) Chromosomes from 1 to 10 and unassembled scaffolds of the reference genome (Grassa et al. 2018); (2) X-Y dSvalues (from 0 to 0.4); (3) proportion of XY-linked genes (in
blue) and X-hemizygous genes (in red) in 2-Mb windows; (4) proportion of genes with sex-biased expres-sion in 2-Mb windows: male-biased (light blue), female-biased (orange). THCAS and CBDAS genes found in Grassa et al. (2018) are indicated by two red dots near the outer ring.
Prentout et al.
166 Genome Research
X was increased when expression of Y was reduced (Fig. 3C). The re-sults were unchanged when using all inferred sex-linked genes or only those found on Chromosome 1 (Fig. 3;Supplemental Fig. S1).
Genomic distribution of the sex-biased genes in C. sativa
Of the genes expressed in flower buds, 15.7% are differentially ex-pressed between male and female individuals (sex-biased genes) (see Table 3;Supplemental Fig. S2). The male-biased genes are sig-nificantly more numerous than the female-biased genes (9.06% vs. 6.64%, Fisher’s exact test P-value < 10−16) (see Table 3), a pattern
that is common in dioecious plants (Harkess et al. 2015; Zemp et al. 2016; Muyle et al. 2017; Cossard et al. 2019, but see Darolti et al. 2018; Sanderson et al. 2019). Sex-biased genes are distributed all over the C. sativa genome (see Fig. 2). The sex-linked genes were significantly enriched among the sex-biased genes (25.8%) com-pared with the autosomal genes (13.9%; Fisher’s exact test P-val-ue = 3.7 × 10⁻¹³), again a very common pattern in dioecious plants (for review, see Muyle et al. 2017; see also Darolti et al. 2018; Sanderson et al. 2019).
Discussion
Chromosome pair 1 is the sex
chromosome pair in C. sativa
Using SEX-DETector, we have been able to identify a large number of sex-linked genes with a moderate sequencing effort (576 millions of single-end 50-bp reads). While most of these sex-linked genes were found to be located on Chromo-some 1 of the assembly of Grassa et al. (2018), some mapped elsewhere on the reference genome. These probably in-clude some false positives, but many are likely to result from assembly errors (see
Supplemental Text S1). Nevertheless, we were able to clearly identify a chromo-some pair (Chromochromo-some 1 in the assem-bly of Grassa et al. 2018) as the sex chromosomes of C. sativa. We propose that the PAR is∼30 Mb large based on gene content and also taking into ac-count the fact that SEX-DETector tends to overestimate the size of the PAR (dis-cussed in Muyle et al. 2016). Indeed, in a family setting, partially sex-linked pseu-do-autosomal genes close to the pseudo-autosomal boundary can be inferred as fully sex-linked by SEX-DETector. How-ever, as these pseudo-autosomal genes still recombine normally, the dS values
between the X and Y alleles identified by SEX-DETector should not exceed the genome-wide nucleotide polymorphism, which is around 1% in our data. Only from 30 Mb onward, the dS values are
above this value, leading us to consider the 0–30 Mb region as pseudo-autosomal. However, more data will be needed (e.g., sex-specific genetic maps) to define pre-cisely the limit of the PAR.
The sex chromosomes are the largest in the C. sativa genome
This pair is the largest pair of the C. sativa genome, in agreement with cytogenetic data (Divashuk et al. 2014). This is frequent in plants with heteromorphic sex chromosomes (e.g., S. latifolia, C. grandis) (for review, see Muyle et al., 2017) but also in species with homomorphic chromosomes, such as papaya, where both
B
A
C
Figure 3. Patterns of molecular evolution of C. sativa sex chromosomes. (A) X-Y dSvalues for the XY
gene pairs. (B) Y/X expression ratio for the XY gene pairs; the black dotted line shows the expected value for no Y degeneration, the red dotted line shows the median observed here (median = 0.47). Both are significantly different (Wilcoxon paired test P-value < 10−16). (C ) Dosage compensation in C. sativa. The expression levels of the X and Y alleles in males and females are shown for gene categories (from left to right, categories 0.61-1 and 0.28-0.61: N = 44, category 0-0.28: N = 43, X-hemizygous: N = 184) with different levels of Y degeneration (measured by the Y/X expression ratio). Sex-biased genes (with strong and significant differences in male and female expression) have been removed, as they are not ex-pected to exhibit dosage compensation (see Muyle et al. 2012, 2018). Only sex-linked genes mapping to Chromosome 1 have been included here.Supplemental Figure S1shows the same analyses with all sex-linked genes.
Table 2. Estimates of the age of the C. sativa sex chromosome system
Age estimate using all XY gene pairsa
Age estimate using XY gene pairs on Chr 1a Maximum X-Y dSvalue 26.7–28.6 26.7–28.6 Top 5% X-Y dSvalues 17.3–18.6 18.7–20 Top 10% X-Y dSvalues 12–13 17.3–18.6
the X and Y increased in size due to the accumulation of repeats (Gschwend et al. 2012; Wang et al. 2012). We did not observe signs of such a process in C. sativa, as the gene density on the X Chromosome is similar to the gene density on the autosomes (32 genes/Mb vs. 33 genes/Mb). It is thus possible that the sex chromosomes are the largest in C. sativa simply because the sex-determining genes happened to evolve on the largest pair of chromosomes.
C. sativa sex chromosomes are relatively old
Age estimates of the C. sativa sex chromosomes range from ∼12 myr to ∼29 myr old (Table 2). This is plausible, as dioecy prob-ably is ancestral for the whole Cannabaceae family that diversified ∼80 myr ago (Zhang et al. 2019). They
may be the oldest sex chromosomes in plants for which the age was inferred from sequence data (Ming et al. 2011; Charlesworth 2015; Muyle et al. 2017). For instance, sex chromosomes are∼11 myr old in S. latifolia (Krasovec et al. 2018) and 8–16 myr old in two dioecious Rumex species (Crowson et al. 2017). However, only more precise molecular clocks for these plants and age estimates in more plant systems will give a precise picture on where the C. sativa sex chro-mosomes stand in the age distribution of plant sex chromosomes.
Further evidence that the C. sativa sex chromosomes are older than those of S. latifolia and Rumex hastatulus is the fact that the median Y/X expression ratio is∼0.5, much lower than what has been reported for the other species [∼0.8 for S. latifolia (Bergero and Charlesworth 2011; Muyle et al. 2012) and ∼0.8 for the old sex-linked genes R. hastatulus (Hough et al. 2014)]. Moreover, Y gene loss is about 70% in C. sativa, which is much higher than other species where Y gene loss has been estimated using the same methodology:∼40% for S. lati-folia (Muyle et al. 2018; see also
Papadopulos et al. 2015) and 30% in R. hastatulus (Hough et al. 2014). In R. rothschildianus, gene loss amounts to∼90%, but the degeneration speed, not the age of the system, is believed to explain this observation (Crowson et al. 2017). Thus, the Y Chromosome of C. sativa seems more strongly degenerated than the Y Chromosomes of species with strong sex chromosome heteromorphy.
Implications for the sex chromosome evolution model in plants
Most of the plant sex chromosome systems that have been studied so far with genomic approaches either have small nonrecombin-ing regions and homomorphic sex chromosomes (e.g., Carica papaya, Asparagus officinalis, Diospyros lotus) or have large nonre-combining regions and heteromorphic sex chromosomes, with the Y being larger than the X (e.g., Silene latifolia, Coccinia grandis). We here found that in a species with homomorphic sex chro-mosomes, the nonrecombining region is large, as it represents ∼70% (75/105 Mb) of the C. sativa sex chromosomes (as suggested in Divashuk et al. 2014, based on cytogenetic data).
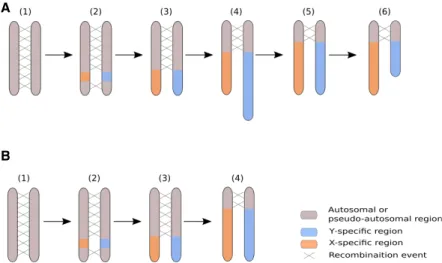
In the current scenario for the evolution of the sex chromo-somes heteromorphy in plants (Ming et al. 2011; Charlesworth 2015; Muyle et al. 2017), it is unclear where these XY Chromosomes fit. Indeed, sex chromosome evolution in plants is thought to start with a small nonrecombining region on the Y Chromosome, which accumulates DNA repeats and tends to grow (Fig. 4). In papaya, the Y nonrecombining region is∼8 Mb large while the X homologous region is ∼4 Mb (Wang et al. 2012). In some dioecious plants, DNA repeat accumulation in the Y nonrecombining region has been fast, and Y Chromosomes that are much larger than the X have evolved in Silene latifolia (Matsunaga et al. 1994) and Coccinia grandis (Sousa et al. 2013). Table 3. List of sex-biased genes
Gene categories Total
Female-biased expression
Male-biased
expression P-valuea
All genes with sex biased-expressionb 3483 1473 2010 <10−16 Autosomal genesc 1599 725 874 2.1 × 10⁻⁴ Sex-linked genesc 146 79 67 0.36 XY gene pairsc 87 34 53 0.053 X-hemizygous genesc 59 45 14 6.5 × 10⁻⁵
aExact binomial test, with a theoretical mean equal to 0.5. bAmong all 30074 C. sativa genes (see Table 1).
cAutosomal, sex-linked (XY and X-hemizygous) genes inferred by
SEX-DETector (see Table 1).
B
A
Figure 4. Revisiting the model for the evolution of plant sex chromosomes heteromorphy with C. sat-iva. (A) The current model for the evolution of plant sex chromosomes heteromorphy is as follows: (1) Sex chromosomes originate from autosomes on which sex-determining genes evolve; (2) the region encom-passing the sex-determining genes stops recombining; (3) the non-recombining region grows larger due to additional events of recombination suppression; (4) the nonrecombining region of the Y Chromosome accumulates repeats and can become larger than the corresponding region on the X Chromosome; (5–6) the Y Chromosome undergoes large deletions and ultimately becomes smaller than the X Chromosome. Steps 1–4 have been previously documented in plants (e.g., Charlesworth et al. 2005; Ming et al. 2011; Muyle et al. 2017 for review), while steps 5–6 are speculative. Our study is supportive of this scenario if we assume that the C. sativa Y Chromosome has been larger in the past. (B) It is possible, however, that the accumulation of repeats has been slow in the Y Chromosome of the C. sativa lineage and that X and Y Chromosomes have always been of similar size. Here, step 4 does not imply the elon-gation of the Y Chromosome.
Prentout et al.
168 Genome Research
Either DNA repeat accumulation on the Y has been slow in the C. sativa lineage, or the Y used to be larger than it is today and has undergone genomic shrinking, a process that is reminis-cent of the evolution of the sex chromosomes heteromorphy in animals (Ming et al. 2011; Bachtrog 2013), where old Y Chromosomes can be tiny compared to their X counterpart (Fig. 4). Distinct assemblies for the X and Y Chromosomes in C. sat-iva and also sequencing of other dioecious Cannabaceae species will help in testing this idea in the future.
Methods
Plant material, RNA extraction, and sequencing
One male and one female C. sativa plant (“Zenitsa” cultivar) were grown in controlled conditions in a greenhouse. A female was crossed with a male plant (controlled pollination). Seeds from this cross were sown to produce the F1. Flower buds (chosen because they are RNA-rich) of 3–5 d before expected flowering time (∼1–3 mm) were sampled (5–7 buds per individual) from the parents and five offspring of each sex, as in Muyle et al. (2012). Total RNA was isolated from young flower buds using the RNeasy Plant Mini (Qiagen) plant isolation kit as recommended by the manufacturer. Isolated RNA was placed in RNAstable tubes (Sigma-Aldrich). One library per individual was prepared. RNA-se-quencing was conducted using the Complete Genomic (CG) tech-nology, which provides 20 million∼50-bp single-end reads per sample (Liu et al. 2012). Two CG runs were done, and we obtained a mean of 48 million reads per individual (seeSupplemental Table S1). Read quality was good (Phred score >35 for all reads), and no trimming was performed.
Mapping, genotyping, and SEX-DETector analysis
The SEX-DETector analysis requires mapping the reads of the indi-viduals to a reference transcriptome and performing SNP-calling to genotype all individuals for all expressed genes. Ideally, the refer-ence transcriptome is from a female individual so that the X and Y reads map to the same transcript and XY SNPs can be identified by SEX-DETector (Muyle et al. 2016). We extracted the 30,074 transcripts from the annotation of the 2011 complete genome from a Purple Kush female individual (van Bakel et al. 2011). The initial mapping analyses were done using BWA, allowing for five mismatches per read (version 0.7.15-r1140, bwa aln -n 5 and bwa samse) (see Li and Durbin 2010). For comparison, an alterna-tive mapping was performed with Bowtie 2 (version 2.1.0, bow-tie2-build and bowtie2 –x) (see Langmead and Salzberg 2012), which yielded similar results. We used SAMtools (version 1.3.1, samtools view -t output.fa -F 4 -h and samtools sort -m 2G) (see Li et al. 2009) to remove unmapped reads and to prepare the files for the genotyping.
The genotyping was performed using reads2snp (version 2.0.64, reads2snp -aeb -min 3 -par 0) (see Gayral et al. 2013), as rec-ommended by Muyle et al. (2016) (i.e., by accounting for allelic ex-pression biases and without filtering for paralogous SNPs). Only SNPs supported by at least three reads were conserved for subse-quent analysis (except inSupplemental Table S2).
We ran SEX-DETector (-system xy/zw/no_sex_chr -seq -detail -detail-sex-linked -L -SEM -thr 0.8) (see Muyle et al. 2016) on gen-otyping data of the 12 individuals. SEX-DETector uses a maximum likelihood approach to estimate the parameters of its model, which include several genotyping error parameters. The posterior proba-bility of being autosomal (P_A), XY (P_XY), or X-hemizygous (P_Xh) is computed for each SNP and for each transcript (combin-ing the posterior probabilities of all SNPs) (see Muyle et al. 2016). A
transcript was inferred as sex-linked when its posterior probability of being either XY or X-hemizygous was≥ 0.8 (i.e., P_XY + P_Xh ≥ 0.8) and if at least one sex-linked SNP had no genotyping error; au-tosomal segregation was inferred similarly (P_A≥ 0.8 and at least one autosomal SNP without genotyping error) (see Muyle et al. 2016). The remaining transcripts were considered undetermined and were not used for further analysis unless explicitly mentioned. To identify X-hemizygous genes among the sex-linked genes, we selected (1) the genes that have only X-hemizygous SNPs, of which at least one is without genotyping error, and (2) the genes that have no Y expression and at least one SNP without genotyping er-ror. The second set of genes typically has mainly X-hemizygous SNPs and only a few X/Y SNPs with many Y genotyping errors. After averaging Y expression across all SNPs and individuals of these genes, Y expression is null. Only a few genes were added with step 2.
SEX-DETector runs on the first mapping with BWA (and also Bowtie 2) yielded high Y genotyping error (YGE) parameter values, which could be the result of mapping errors of Y-linked reads (Muyle et al. 2016). The reference transcriptome used for mapping was derived from the genome of a female plant (van Bakel et al. 2011), which may result in a mapping bias against the Y-linked reads. To solve this problem, we used GSNAP (version 2017-11-15, gsnap -m 5) (see Wu and Nacu 2010), which can be used to map RNA-seq reads onto a divergent reference. GSNAP was thus used in a SNP-informed mode that adjusts read alignment onto a reference taking into account a user-provided list of SNPs that are not considered mismatches. For this procedure, we first mapped reads with BWA and collected all the SNPs present in SEX-DETector’s output, which were provided to GSNAP. We ran four iterations of GSNAP. For each iteration, SEX-DETector detect-ed new sex-linkdetect-ed SNPs, which were adddetect-ed to the list of SNPs pro-vided to GSNAP. As expected, the Y genotyping error parameter value decreased from 0.84 with BWA to 0.07 with the fourth GSNAP iteration (Supplemental Table S2) and the mapping rate from 82.57% to 87% (Supplemental Table S1). All inferred sex-linked genes are available inSupplemental Table S3.
Circular representations of location of sex-linked genes
in the C. sativa genome
To map the sex-linked genes to the C. sativa genome, we used BLAST (Altschul et al. 1990) to find the best hit of each C. sativa transcript in the van Bakel et al. (2011) transcriptome on one of the recent reference genomes (blastn -max_target_seqs 1 -max_hsps 1). For this mapping, we used the C. sativa reference ge-nome with the best assembly statistics (size = 875 Mb, 10 pseudo-molecules, 220 scaffolds, N50 = 91 Mb) (see https://www.ncbi .nlm.nih.gov/genome/genomes/11681 and Grassa et al. 2018), which was, however, unannotated. We then used Circos (version 0.69-6) (Krzywinski et al. 2009) for visualizing the location of sex-linked genes. We split each chromosome in windows of 2 Mb using BEDTools makewindows (version v2.26.0) (Quinlan & Hall 2010). BEDTools intersect (version v2.26.0, -c option) (Quinlan & Hall 2010) was used for computing proportions of sex-linked genes per window. Proportions of sex-linked genes were computed by dividing the number of XY gene pairs (or X-hemizygous genes) by the number of all genes (sex-linked, auto-somal, and undetermined) that blasted in the same window. A similar analysis was done for sex-biased genes. A comparison of the genomes of Grassa et al. (2018) and Laverty et al. (2019) is also shown in the supplemental material (Supplemental Fig. S4). Chromosome 1 in the assembly of Grassa et al. (2018) apparently corresponds to Chromosome 10 in the assembly of Laverty et al. (2019). Note, however, that the assembly of Chromosome 10 in
Laverty et al. (2019) seems to be much less complete than that of Chromosome 1 in Grassa et al. (2018): Chromosome 10 is enriched in sex-linked genes, but many sex-linked genes fall in the unassem-bled scaffolds.
Analysis of the sex-linked genes
Y gene loss
To estimate the rate of gene loss in the Y Chromosome, we com-pared the number of XY gene pairs and the number of X-hemizy-gous genes, as in Bergero and Charlesworth (2011). Identifying XY gene pairs relies on fixed XY differences, while identifying X-hemi-zygous genes relies on X-polymorphism only, which makes detec-tion of X-hemizygous genes less likely (see Bergero and Charlesworth 2011; Muyle et al. 2016). The Y gene loss proportion estimate was thus corrected for this bias as follows:
Y gene loss=
X-hemizygous gene number
(X-hemizygous gene number + XY gene pair with X polymorphism number)
Values of synonymous divergence (d
S) and age of the XY system
The X and Y open reading frame sequences were aligned using the translated reference transcripts to get reading-frame informed alignments. X-Y dSvalues were obtained using codeml (PAML
ver-sion 4.9) (see Yang 2007) in pairwise mode. To estimate the age of the C. sativa XY system, we considered maximum X-Y dSvalues
and used two different molecular clocks for plants: 1.5 × 10⁻⁸ sub-stitutions/site/year (Koch et al. 2000) and 7 × 10⁻⁹mutations/site/ generation (Ossowski et al. 2010). We obtained the age of the XY system as follows:
age(in years) =dSmax rate , using the molecular clock of Koch et al. (2000), and
age(in number of generations) =dSmax
2m , using the molecular clock of Ossowski et al. (2010).
The age in million years from the Ossowski et al. (2010) mo-lecular clock was obtained assuming one generation per year in natural populations of C. sativa (which is a tall annual plant).
Allele-specific expression analyses
We used allele-specific expression estimates at XY gene pairs pro-vided by SEX-DETector (Muyle et al. 2016) for the estimation of the Y/X expression ratio and patterns of dosage compensation (see Fig. 3B–C). These estimates relied on counting reads spanning XY SNPs only and were normalized using the total read number in a library for each individual. These estimates were further normal-ized by the median autosomal expression for each individual.
Identifying sex-biased genes
As the differential gene expression analysis methods currently available vary in performance (Schurch et al. 2016; Costa-Silva et al. 2017), we chose to combine several methods. Analyses con-trasting the gene expression level between our 12 male and female individuals were thus performed using three R packages: (1) DESeq2 version 1.10.1 (Love et al. 2014); (2) edgeR version 3.26.9 (Robinson et al. 2010), both relying on negative binomial distribution of read count modeling; and (3) limma-voom version
3.26.9 (Ritchie et al. 2015), based on log-normal distribution mod-eling to take into account the sampling variance of small read counts. Very lowly expressed genes were discarded from the anal-ysis, keeping only genes covered by at least 10 reads in a minimum of two replicates. Using a FDR-adjusted P-value cut-off of 0.0001, we retained as sex-biased the genes that had significant differences in expression between males and females in at least two of the three methods (Supplemental Fig. S3).
Statistics
All statistical tests and figures were done using R version 3.2.3 (R Core Team 2016).
Data access
All RNA-seq data for the C. sativa samples generated in this study have been submitted to the NCBI BioProject database (https:// www.ncbi.nlm.nih.gov/bioproject/) under accession number PRJNA549804.
Competing interest statement
The authors declare no competing interests.
Acknowledgments
We thank the BGI for free sequencing, thanks to their call for RNA-seq for medicinal plants. We thank Aline Muyle for advice with SEX-DETector and discussions. We thank Dr. Tatyana Sukhorada, P. P. Lukyanenko Krasnodar Research and Development Institute of Agriculture for providing seeds of the C. sativa cultivar “Zen-itsa.” We thank three anonymous referees and the editor for their useful comments that helped improve this manuscript. This work was performed using the computing facilities of the CC LBBE/ PRABI; we thank Bruno Spataro and Stéphane Delmotte for cluster maintenance. This project was supported through Agence Natio-nale de la Recherche (ANR) grant ANR-14-CE19-0021-01 to G.A.B.M.
Author contributions: Conceptualization of the study: G.A.B.M. and G.K.; methodology: G.A.B.M. and G.K.; software: D.P., B.R., and H.B.; formal analysis: D.P.; investigation: D.P., O.R., B.R., H.B., H.H., J.K., G.K., and G.A.B.M.; resources: O.R., C.F., and G.K.; data curation: C.F.; writing—original draft: G.A.B.M., D.P., and J.K.; writing—review and editing: all authors; visualization: D.P.; supervision: G.A.B.M., J.K., and G.K.; project administration: G.A.B.M.; funding acquisition: G.A.B.M. and G.K.
References
Ahmed S, Cock JM, Pessia E, Luthringer R, Cormier A, Robuchon M, Sterck L, Peters AF, Dittami SM, Corre E, et al. 2014. A haploid system of sex de-termination in the brown alga Ectocarpus sp. Curr Biol24: 1945–1957. doi:10.1016/j.cub.2014.07.042
Alexander SP. 2016. Therapeutic potential of cannabis-related drugs. Prog Neuropsychopharmacol Biol Psychiatry 64: 157–166. doi:10.1016/j .pnpbp.2015.07.001
Altschul SF, Gish W, Miller W, Myers EW, Lipman DJ. 1990. Basic local alignment search tool. J Mol Biol215: 403–410. doi:10.1016/S0022-2836(05)80360-2
Andre CM, Hausman JF, Guerriero G. 2016. Cannabis sativa: the plant of the thousand and one molecules. Front Plant Sci7: 19. doi:10.3389/fpls .2016.00019
Bachtrog D. 2013. Y-chromosome evolution: emerging insights into pro-cesses of Y-chromosome degeneration. Nat Rev Genet14: 113–124. doi:10.1038/nrg3366
Barrett SC, Hough J. 2013. Sexual dimorphism in flowering plants. J Exp Bot 64: 67–82. doi:10.1093/jxb/ers308
Prentout et al.
170 Genome Research
Bergero R, Charlesworth D. 2009. The evolution of restricted recombination in sex chromosomes. Trends Ecol Evol24: 94–102. doi:10.1016/j.tree .2008.09.010
Bergero R, Charlesworth D. 2011. Preservation of the Y transcriptome in a 10-million-year-old plant sex chromosome system. Curr Biol 21: 1470–1474. doi:10.1016/j.cub.2011.07.032
Bergero R, Qiu S, Charlesworth D. 2015. Gene loss from a plant sex chromo-some system. Curr Biol25: 1234–1240. doi:10.1016/j.cub.2015.03.015 Charlesworth D. 2015. Plant contributions to our understanding of sex
chromosome evolution. New Phytol 208: 52–65. doi:10.1111/nph .13497
Charlesworth D, Charlesworth B, Marais G. 2005. Steps in the evolution of heteromorphic sex chromosomes. Heredity (Edinb)95: 118–128. doi:10 .1038/sj.hdy.6800697
Cossard GG, Toups MA, Pannell JR. 2019. Sexual dimorphism and rapid turnover in gene expression in pre-reproductive seedlings of a dioecious herb. Ann Bot123: 1119–1131. doi:10.1093/aob/mcy183
Costa-Silva J, Domingues D, Lopes FM. 2017. RNA-Seq differential expres-sion analysis: an extended review and a software tool. PLoS One12: e0190152. doi:10.1371/journal.pone.0190152
Crowson D, Barrett SCH, Wright SI. 2017. Purifying and positive selection influence patterns of gene loss and gene expression in the evolution of a plant sex chromosome system. Mol Biol Evol 34: 1140–1154. doi:10.1093/molbev/msx064
Darolti I, Wright AE, Pucholt P, Berlin S, Mank JE. 2018. Slow evolution of sex-biased genes in the reproductive tissue of the dioecious plant Salix viminalis. Mol Ecol27: 694–708. doi:10.1111/mec.14466
Divashuk MG, Alexandrov OS, Razumova OV, Kirov IV, Karlov GI. 2014. Molecular cytogenetic characterization of the dioecious Cannabis sativa with an XY chromosome sex determination system. PLoS One9: e85118. doi:10.1371/journal.pone.0085118
Gayral P, Melo-Ferreira J, Glémin S, Bierne N, Carneiro M, Nabholz B, Lourenco JM, Alves PC, Ballenghien M, Faivre N, et al. 2013. Reference-free population genomics from next-generation transcrip-tome data and the vertebrate–invertebrate gap. PLoS Genet 9: e1003457. doi:10.1371/journal.pgen.1003457
Grassa CJ, Wenger JP, Dabney C, Poplawski SG, Motley ST, Michael TP, Schwartz C, Weiblen GD. 2018. A complete Cannabis chromosome as-sembly and adaptive admixture for elevated cannabidiol (CBD) content. bioRxiv doi:10.1101/458083
Gschwend AR, Yu Q, Tong EJ, Zeng F, Han J, VanBuren R, Aryal R, Charlesworth D, Moore PH, Paterson AH, et al. 2012. Rapid divergence and expansion of the X chromosome in papaya. Proc Natl Acad Sci109: 13716–13721. doi:10.1073/pnas.1121096109
Harkess A, Mercati F, Shan HY, Sunseri F, Falavigna A, Leebens-Mack J. 2015. Sex-biased gene expression in dioecious garden asparagus (Asparagus officinalis). New Phytol207: 883–892. doi:10.1111/nph.13389 Hobza R, Cegan R, Jesionek W, Kejnovsky E, Vyskot B, Kubat Z. 2017.
Impact of repetitive elements on the Y chromosome formation in plants. Genes (Basel)8: 302. doi:10.3390/genes8110302
Hough J, Hollister JD, Wang W, Barrett SC, Wright SI. 2014. Genetic degen-eration of old and young Y chromosomes in the flowering plant Rumex hastatulus. Proc Natl Acad Sci111: 7713–7718. doi.org/10.1073/pnas .1319227111
Koch M, Haubold B, Mitchell-Olds T. 2000. Comparative evolutionary anal-ysis of chalcone synthase and alcohol dehydrogenase loci in Arabidopsis, Arabis and related genera (Brassicaceae). Mol Biol Evol17: 1483–1498. doi:10.1093/oxfordjournals.molbev.a026248
Krasovec M, Chester M, Ridout K, Filatov DA. 2018. The mutation rate and the age of the sex chromosomes in Silene latifolia. Curr Biol28: 1832– 1838.e4. doi:10.1016/j.cub.2018.04.069
Krzywinski M, Schein J, Birol I, Connors J, Gascoyne R, Horsman D, Jones SJ, Marra MA. 2009. Circos: an information aesthetic for comparative geno-mics. Genome Res19: 1639–1645. doi:10.1101/gr.092759.109 Langmead B, Salzberg SL. 2012. Fast gapped-read alignment with Bowtie 2.
Nat Methods9: 357–359. doi:10.1038/nmeth.1923
Laverty KU, Stout JM, Sullivan MJ, Shah H, Gill N, Holbrook L, Deikus G, Sebra R, Hughes TR, Page JE, et al. 2019. A physical and genetic map of Cannabis sativa identifies extensive rearrangements at the THC/ CBD acid synthase loci. Genome Res 29: 146–156. doi:10.1101/gr .242594.118
Li H, Durbin R. 2010. Fast and accurate long-read alignment with Burrows– Wheeler transform. Bioinformatics26: 589–595. doi:10.1093/bioinfor matics/btp698
Li H, Handsaker B, Wysoker A, Fennell T, Ruan J, Homer N, Marth G, Abecasis G, Durbin R; 1000 Genome Project Data Processing Subgroup. 2009. The Sequence Alignment/Map format and SAMtools. Bioinformatics25: 2078–2079. doi:10.1093/bioinformatics/btp352 Liu L, Li Y, Li S, Hu N, He Y, Pong R, Lin D, Lu L, Law M. 2012. Comparison
of next-generation sequencing systems. Biomed Res Int2012: 251364. doi:10.1155/2012/251364
Love MI, Huber W, Anders S. 2014. Moderated estimation of fold change and dispersion for RNA-seq data with DESeq2. Genome Biol15: 550. doi:10.1186/s13059-014-0550-8
Matsunaga S, Hizume M, Kawano S, Kuroiwa T. 1994. Cytological analyses in Melandrium album: genome size, chromosome size and fluorescence in situ hybridization. Cytologia (Tokyo)59: 135–141. doi:10.1508/cytolo gia.59.135
McVey E. 2017. U.S. marijuana industry’s economic impact to approach $70B by 2021. In Marijuana Business Daily. Published June 12, 2017. https://mjbizdaily.com/chart-u-s-marijuana-industrys-economic-impact-approach-70b-2021/
Ming R, Bendahmane A, Renner SS. 2011. Sex chromosomes in land plants. Annu Rev Plant Biol62: 485–514. doi:10.1146/annurev-arplant-042110-103914
Muyle A, Zemp N, Deschamps C, Mousset S, Widmer A, Marais GA. 2012. Rapid de novo evolution of X chromosome dosage compensation in Silene latifolia, a plant with young sex chromosomes. PLoS Biol 10: e1001308. doi:10.1371/journal.pbio.1001308
Muyle A, Käfer J, Zemp N, Mousset S, Picard F, Marais GA. 2016. SEX-DETector: a probabilistic approach to study sex chromosomes in non-model organisms. Genome Biol Evol8: 2530–2543. doi:10.1093/gbe/ evw172
Muyle A, Shearn R, Marais GA. 2017. The evolution of sex chromosomes and dosage compensation in plants. Genome Biol Evol 9: 627–645. doi:10.1093/gbe/evw282
Muyle A, Zemp N, Fruchard C, Cegan R, Vrana J, Deschamps C, Tavares R, Hobza R, Picard F, Widmer A, et al. 2018. Genomic imprinting mediates dosage compensation in a young plant XY system. Nat Plants4: 677– 680. doi:10.1038/s41477-018-0221-y
Offord C. 2018. UK to legalize medicinal Cannabis. In The Scientist. Published July 27, 2018. https://www.the-scientist.com/news-opinion/ uk-to-legalize-medicinal-cannabis-64574
Ossowski S, Schneeberger K, Lucas-Lledo JI, Warthmann N, Clark RM, Shaw RG, Weigel D, Lynch M. 2010. The rate and molecular spectrum of spon-taneous mutations in Arabidopsis thaliana. Science327: 92–94. doi:10 .1126/science.1180677
Palmer DH, Rogers TF, Dean R, Wright AE. 2019. How to identify sex chro-mosomes and their turnover. Mol Ecol28: 4709–4724. doi:10.1111/mec .15245
Papadopulos AS, Chester M, Ridout K, Filatov DA. 2015. Rapid Y degenera-tion and dosage compensadegenera-tion in plant sex chromosomes. Proc Natl Acad Sci112: 13021–13026. doi:10.1073/pnas.1508454112
Quinlan AR, Hall IM. 2010. BEDTools: a flexible suite of utilities for compar-ing genomic features. Bioinformatics26: 841–842. doi:10.1093/bioinfor matics/btq033
R Core Team. 2016. R: a language and environment for statistical computing. R Foundation for Statistical Computing, Vienna. http://www.R-project .org/.
Renner SS. 2014. The relative and absolute frequencies of angiosperm sexual systems: dioecy, monoecy, gynodioecy, and an updated online data-base. Am J Bot101: 1588–1596. doi:10.3732/ajb.1400196
Ritchie ME, Phipson B, Wu D, Hu Y, Law CW, Shi W, Smyth GK. 2015. limma powers differential expression analyses for RNA-sequencing and microarray studies. Nucleic Acids Res 43: e47. doi:10.1093/nar/ gkv007
Robinson MD, McCarthy DJ, Smyth GK. 2010. edgeR: a Bioconductor pack-age for differential expression analysis of digital gene expression data. Bioinformatics26: 139–140. doi:10.1093/bioinformatics/btp616 Salentijn EM, Petit J, Trindade LM. 2019. The complex interactions between
flowering behavior and fiber quality in hemp. Front Plant Sci10. doi:10 .3389/fpls.2019.00614
Sanderson BJ, Wang L, Tiffin P, Wu Z, Olson MS. 2019. Sbiased gene ex-pression in flowers, but not leaves, reveals secondary sexual dimor-phism in Populus balsamifera. New Phytol221: 527–539. doi:10.1111/ nph.15421
Schultes RE, Klein WM, Plowman T, Lockwood TE. 1974. Cannabis: an ex-ample of taxonomic neglect. Bot Mus Lealf Harv Univ23: 337–367. doi:10.1515/9783110812060.21
Schurch NJ, Schofield P, Gierliński M, Cole C, Sherstnev A, Singh V, Wrobel N, Gharbi K, Simpson GG, Owen-Hughes T, et al. 2016. How many bi-ological replicates are needed in an RNA-seq experiment and which dif-ferential expression tool should you use? RNA 22: 839–851. doi:10 .1261/rna.053959.115
Small E. 2015. Evolution and classification of Cannabis sativa (marijuana, hemp) in relation to human utilization. Bot Rev81: 189–294. doi:10 .1007/s12229-015-9157-3
Sousa A, Fuchs J, Renner SS. 2013. Molecular cytogenetics (FISH, GISH) of Coccinia grandis: a ca. 3 myr-old species of Cucurbitaceae with the largest Y/autosome divergence in flowering plants. Cytogenet Genome Res139: 107–118. doi:10.1159/000345370
Sousa A, Bellot S, Fuchs J, Houben A, Renner SS. 2016. Analysis of transpos-able elements and organellar DNA in male and female genomes of a spe-cies with a huge Y chromosome reveals distinct Y centromeres. Plant J 88: 387–396. doi:10.1111/tpj.13254
Techen N, Chandra S, Lata H, Elsohly MA, Khan IA. 2010. Genetic identifi-cation of female Cannabis sativa plants at early developmental stage. Planta Med76: 1938–1939. doi:10.1055/s-0030-1249978
Toups MA, Hahn MW. 2010. Retrogenes reveal the direction of sex-chromo-some evolution in mosquitoes. Genetics186: 763–766. doi:10.1534/ge netics.110.118794
van Bakel H, Stout JM, Cote AG, Tallon CM, Sharpe AG, Hughes TR, Page JE. 2011. The draft genome and transcriptome of Cannabis sativa. Genome Biol12: R102. doi:10.1186/gb-2011-12-10-r102
Veltsos P, Ridout KE, Toups MA, González-Martínez SC, Muyle A, Emery O, Rastas P, Hudzieczek V, Hobza R, Vyskot B, et al. 2019. Early sex-chro-mosome evolution in the diploid dioecious plant Mercurialis annua. Genetics212: 815–835. doi:10.1534/genetics.119.302045
Vicoso B, Kaiser VB, Bachtrog D. 2013. Sex-biased gene expression at homo-morphic sex chromosomes in emus and its implication for sex chromo-some evolution. Proc Natl Acad Sci110: 6453–6458. doi:10.1073/pnas .1217027110
Wang J, Na JK, Yu Q, Gschwend AR, Han J, Zeng F, Aryal R, VanBuren R, Murray JE, Zhang W, et al. 2012. Sequencing papaya X and Yh
chromo-somes reveals molecular basis of incipient sex chromosome evolution. Proc Natl Acad Sci109: 13710–13715. doi:10.1073/pnas.1207833109 Wu TD, Nacu S. 2010. Fast and SNP-tolerant detection of complex variants
and splicing in short reads. Bioinformatics26: 873–881. doi:10.1093/bio informatics/btq057
Yang Z. 2007. PAML 4: Phylogenetic Analysis by Maximum Likelihood. Mol Biol Evol24: 1586–1591. doi:10.1093/molbev/msm088
Yazdi HP, Ellegren H. 2014. Old but not (so) degenerated—slow evolution of largely homomorphic sex chromosomes in ratites. Mol Biol Evol31: 1444–1453. doi:10.1093/molbev/msu101
Yeager A. 2018. Canada could come to the fore in Cannabis research. In The Scientist. Published July 6, 2018. https://www.the-scientist.com/news-opinion/canada-could-come-to-the-fore-in-cannabis-research-64455 Zemp N, Tavares R, Muyle A, Charlesworth D, Marais GA, Widmer A. 2016.
Evolution of sex-biased gene expression in a dioecious plant. Nat Plants 2: 16168. doi:10.1038/nplants.2016.168
Zhang Q, Onstein RE, Little SA, Sauquet H. 2019. Estimating divergence times and ancestral breeding systems in Ficus and Moraceae. Ann Bot 123: 191–204. doi:10.1093/aob/mcy159
Received July 31, 2019; accepted in revised form January 24, 2020.