HAL Id: hal-03084764
https://hal.archives-ouvertes.fr/hal-03084764
Submitted on 25 Dec 2020
HAL is a multi-disciplinary open access
archive for the deposit and dissemination of
sci-entific research documents, whether they are
pub-lished or not. The documents may come from
teaching and research institutions in France or
abroad, or from public or private research centers.
L’archive ouverte pluridisciplinaire HAL, est
destinée au dépôt et à la diffusion de documents
scientifiques de niveau recherche, publiés ou non,
émanant des établissements d’enseignement et de
recherche français ou étrangers, des laboratoires
publics ou privés.
driven by only a few plant-associated microbial taxa
Abdoulaye Samaké, Aurélie Bonin, Jean-Luc Jaffrezo, Pierre Taberlet, Samuel
Weber, Gaëlle Uzu, Véronique Jacob, Sébastien Conil, Jean Martins
To cite this version:
Abdoulaye Samaké, Aurélie Bonin, Jean-Luc Jaffrezo, Pierre Taberlet, Samuel Weber, et al.. High
levels of primary biogenic organic aerosols are driven by only a few plant-associated microbial taxa.
Atmospheric Chemistry and Physics, European Geosciences Union, 2020, 20 (9), pp.5609-5628.
�10.5194/acp-20-5609-2020�. �hal-03084764�
https://doi.org/10.5194/acp-20-5609-2020 © Author(s) 2020. This work is distributed under the Creative Commons Attribution 4.0 License.
High levels of primary biogenic organic aerosols are driven by only
a few plant-associated microbial taxa
Abdoulaye Samaké1, Aurélie Bonin2, Jean-Luc Jaffrezo1, Pierre Taberlet2, Samuël Weber1, Gaëlle Uzu1, Véronique Jacob1, Sébastien Conil3, and Jean M. F. Martins1
1Université Grenoble Alpes, CNRS, IRD, INP-G, IGE (UMR 5001), Grenoble, 38000, France 2Université Grenoble Alpes, CNRS, LECA (UMR 5553), BP 53, Grenoble, 38041, France 3ANDRA DRD/OPE Observatoire Pérenne de l’Environnement, 55290 Bure, France
Correspondence: Abdoulaye Samaké (abdoulaye.samake2@univ-grenoble-alpes.fr) and Jean Martins (jean.martins@univ-grenoble-alpes.fr)
Received: 15 December 2019 – Discussion started: 9 January 2020
Revised: 11 March 2020 – Accepted: 14 April 2020 – Published: 13 May 2020
Abstract. Primary biogenic organic aerosols (PBOAs) rep-resent a major fraction of coarse organic matter (OM) in air. Despite their implication in many atmospheric processes and human health problems, we surprisingly know little about PBOA characteristics (i.e., composition, dominant sources, and contribution to airborne particles). In addition, specific primary sugar compounds (SCs) are generally used as mark-ers of PBOAs associated with bacteria and fungi, but our knowledge of microbial communities associated with atmo-spheric particulate matter (PM) remains incomplete. This work aimed at providing a comprehensive understanding of the microbial fingerprints associated with SCs in PM10
(par-ticles smaller than 10 µm) and their main sources in the sur-rounding environment (soils and vegetation). An intensive study was conducted on PM10collected at a rural background
site located in an agricultural area in France. We combined high-throughput sequencing of bacteria and fungi with de-tailed physicochemical characterizations of PM10, soil, and
plant samples and monitored meteorological and agricultural activities throughout the sampling period. Results show that in summer SCs in PM10are a major contributor of OM in air,
representing 0.8 % to 13.5 % of OM mass. SC concentrations are clearly determined by the abundance of only a few spe-cific airborne fungal and bacterial taxa. The temporal fluctu-ations in the abundance of only four predominant fungal gen-era, namely Cladosporium, Alternaria, Sporobolomyces, and Dioszegia, reflect the temporal dynamics in SC concentra-tions. Among bacterial taxa, the abundance of only Massilia, Pseudomonas, Frigoribacterium, and Sphingomonas is
posi-tively correlated with SC species. These microbes are signif-icantly enhanced in leaf over soil samples. Interestingly, the overall community structure of bacteria and fungi are simi-lar within PM10 and leaf samples and significantly distinct
between PM10 and soil samples, indicating that
surround-ing vegetation is the major source of SC-associated microbial taxa in PM10in this rural area of France.
1 Introduction
Airborne particulate matter (PM) is the subject of high sci-entific and political interest mainly because of its important effects on climate and public health (Boucher et al., 2013; Fröhlich-Nowoisky et al., 2016; Fuzzi et al., 2006). Numer-ous epidemiological studies have significantly related both acute and chronic exposures to ambient PM with respira-tory impairments, heart diseases, asthma, and lung cancer, as well as increased risk of mortality (Kelly and Fussell, 2015; Lecours et al., 2017; Pope and Dockery, 2006). PM can also affect directly or indirectly the climate by absorbing and/or diffusing both the incoming and outgoing solar radia-tion (Boucher et al., 2013; Fröhlich-Nowoisky et al., 2016). These effects are modulated by highly variable physical char-acteristics (e.g., size, specific surface, concentrations) and the complex chemical composition of PM (Fröhlich-Nowoisky et al., 2016; Fuzzi et al., 2015). PM consists of a complex mixture of inorganic trace elements and carbonaceous ter (organic carbon and elemental carbon), with organic
mat-ter (OM) generally being the major but poorly characmat-terized constituent of PM (Boucher et al., 2013; Bozzetti et al., 2016; Fortenberry et al., 2018). A quantitative understanding of OM sources is critically important to develop efficient guide-lines for both air-quality control and abatement strategies. So far, considerable efforts have been undertaken to investigate OM associated with anthropogenic and secondary sources, but much less is known about emissions from primary bio-genic sources (Bozzetti et al., 2016; China et al., 2018; Yan et al., 2019).
Primary biogenic organic aerosols (PBOAs) are a subset of organic PM that are directly emitted by processes in-volving the biosphere (Boucher et al., 2013; Elbert et al., 2007). PBOAs typically refer to biologically derived mate-rials, notably including living organisms (e.g., bacteria, fun-gal spores, Protozoa, viruses), nonliving biomass (e.g., mi-crobial fragments), and other types of biological materials like pollen or plant debris (Amato et al., 2017; Elbert et al., 2007; Fröhlich-Nowoisky et al., 2016). PBOAs are gaining increasing attention notably because of their ability to affect human health by causing infectious, toxic, and hypersensi-tivity diseases (Fröhlich-Nowoisky et al., 2016; Huffman et al., 2019). For instance, PBOA components, especially fun-gal spores and bacterial cells, have recently been shown to cause significant oxidative potential (Samaké et al., 2017). However, to date, the precise role of PBOA components and interplay regarding mechanisms of diseases are remarkably misunderstood (Coz et al., 2010; Hill et al., 2017). Specific PBOA components can also participate in many relevant at-mospheric processes like cloud condensation and ice nucle-ation, thereby directly or indirectly affecting the Earth’s hy-drological cycle and radiative balance (Boucher et al., 2013; Fröhlich-Nowoisky et al., 2016; Hill et al., 2017). These di-verse impacts are effective at a regional scale due to the transport of PBOAs (Dommergue et al., 2019; Yu et al., 2016). Moreover, PBOAs are a major component of OM found in particles less than 10 µm in aerodynamic diameter (PM10) (Bozzetti et al., 2016; Coz et al., 2010; Samaké et
al., 2019b). For instance, Bozzetti et al. (2016) have shown that PBOAs equal the contribution of secondary organic aerosols (SOAs) to OM in PM10 collected at a rural
back-ground site in Switzerland during both the summer and win-ter periods. However, current estimates of global win-terrestrial PBOA emissions are very uncertain and range between 50 and 1000 Tg yr−1(Boucher et al., 2013; Coz et al., 2010; El-bert et al., 2007), underlining the critical gap in the under-standing of this significant OM fraction.
The recent application of fluorescent technics, such as the ultraviolet aerodynamic particle sizer, the wideband in-tegrated bioaerosol sensor (Bozzetti et al., 2016; Gosselin et al., 2016; Huffman and Santarpia, 2017; Huffman et al., 2019), and scanning electron microscopy (Coz et al., 2010), has provided very insightful information on the abundance of size-segregated ambient PBOAs. Atmospheric sources of PBOAs are numerous and include agricultural activities, leaf
abrasion, and soil resuspension (Coz et al., 2010; Medeiros et al., 2006; Pietrogrande et al., 2014). To date, the detailed constituents of PBOAs, their predominant sources, and their atmospheric emission processes, as well as their contribu-tions to total airborne particles, remain poorly documented and quantified (Bozzetti et al., 2016; Coz et al., 2010; Elbert et al., 2007). Such information would be important for inves-tigating the properties and atmospheric impacts of PBOAs, as well as for a future optimization of source-resolved chemical transport models (CTMs), which are still generally unable to accurately simulate important OM fractions (Ciarelli et al., 2016; Heald et al., 2011; Kang et al., 2018).
Primary sugar compounds (SCs, defined as sugar alcohols and saccharides) are ubiquitous water-soluble compounds found in atmospheric PM (Gosselin et al., 2016; Medeiros et al., 2006; Pietrogrande et al., 2014; Jia et al., 2010b). SC species are emitted from biologically derived sources (Medeiros et al., 2006; Verma et al., 2018) and have some-times been detected in aerosols taken from air masses influ-enced by smoke from biomass burning (Fu et al., 2012; Yang et al., 2012). However, recent studies conducted at several sites across France revealed a weak correlation between daily concentrations of SC and levoglucosan in PM2.5 and PM10
collected throughout the year (Golly et al., 2018; Samaké et al., 2019a). This suggests that the open burning of biomass is not a significant source of SCs in the environments studied here. In this context, specific SC species are still extensively viewed as powerful markers for tracking sources and esti-mating PBOA contributions to OM mass (Bauer et al., 2008; Gosselin et al., 2016; Jia et al., 2010b; Medeiros et al., 2006). For example, glucose is the most common monosaccharide in vascular plants, and it has been predominantly used as an in-dicator of plant material (such as pollen or plant debris) from several areas around the world (Jia et al., 2010b; Medeiros et al., 2006; Pietrogrande et al., 2014; Verma et al., 2018). Trehalose (a.k.a. mycose) is a common metabolite of various microorganisms, serving as an osmoprotectant accumulating in a cell’s cytosol during harsh conditions (e.g., dehydration and heat) (Bougouffa et al., 2014). It has been proposed as a generic indicator of soil-borne microbiota (Jia et al., 2010b; Medeiros et al., 2006; Pietrogrande et al., 2014; Verma et al., 2018). Similarly, mannitol and arabitol are two very common sugar alcohols (also called polyols), serving as storage and transport solutes in fungi (Gosselin et al., 2016; Medeiros et al., 2006; Verma et al., 2018). Their atmospheric concentra-tion levels have frequently been used to investigate fungal spore contributions to PBOA mass in different environments (urban, rural, costal, and polar) around the world (Barbaro et al., 2015; Gosselin et al., 2016; Jia et al., 2010b; Verma et al., 2018; Weber et al., 2018).
Despite the relatively vast literature using the atmospheric concentration levels of SCs as potential suitable markers of PBOAs associated with bacteria and fungi, our understand-ing of associated airborne microbial communities (i.e., di-versity and community composition) remains poor. This is
due in particular to the lack of high-resolution (i.e., daily) data sets characterizing how well the variability of these mi-crobial communities may be related to that of primary sugar species. Such information is of paramount importance to bet-ter understand the dominant atmospheric sources of SCs (and then PBOAs), as well as their relevant effective environmen-tal drivers, which are still poorly documented (Bozzetti et al., 2016).
Our recent works discussed the size distribution features and the spatial and temporal variability in atmospheric par-ticulate SC concentrations in France (Golly et al., 2018; Samaké et al., 2019a, b). As a continuation, in this study we present the first daily temporal-concurrent characterization of ambient SC species concentrations and both bacterial and fungal community compositions for PM10 collected at a
ru-ral background site located in an intensive agriculturu-ral area. The aim of this study was to use a DNA metabarcoding ap-proach (Taberlet et al., 2018) to investigate PM10-associated
microbial communities, which can help answer the follow-ing research questions. (i) What are the microbial community structures associated with PM10? (ii) Is the temporal
dynam-ics of SC concentrations related to changes in the airborne microbial community composition? (iii) What are the pre-dominant sources of SC-associated microbial communities at a continental rural field site? Since soil and vegetation are currently believed to be the dominant sources of airborne mi-croorganisms in most continental areas (Bowers et al., 2011; Jia et al., 2010a; Rathnayake et al., 2016), our study focused on these two potential sources.
2 Material and methods 2.1 Site description
The Observatoire Pérenne de l’Environnement (OPE) is a continental rural background observatory located about 230 km east of Paris at an altitude of 392 m (Fig. 1). This French critical zone observatory (CZO) is part of a long-term multidisciplinary project monitoring the state of en-vironmental variables, including among others fluxes, abi-otic and biabi-otic variables, and their functions and dynamics (http://ope.andra.fr/index.php?lang=en, last access: 10 De-cember 2019). It is largely impacted by agricultural activ-ities. It is also characterized by a low population density (less than 22 per square kilometer within an area of 900 km2) with no industrial activities or surrounding major transport roads. The air monitoring site itself lies in a “reference sec-tor” of 240 km2 in the middle of a field crop area (tens of kilometers in all directions). This reference sector is com-posed of vast farmlands interspersed with wooded areas. The area is further defined by a homogeneous soil type with a predominantly superficial clay–limestone composition. The daily agricultural practices and meteorological data (includ-ing wind speed and direction, temperature, rainfall level, and
relative humidity) within the reference sector are recorded and made available by ANDRA (Agence nationale pour la gestion des déchets radioactifs). The agricultural fields of the area are generally submitted to a 3-year crop-rotation sys-tem. The major crops during the campaign period were pea and oilseed rape.
2.2 Sample collection
An intensive field campaign was conducted at this site for the sake of the present study. The aerosol sampling cam-paign period lasted from 12 June to 21 August 2017, cover-ing the summer period in France. Durcover-ing this period, ambient PM10was collected daily (from 09:00 UTC to 09:00 UTC the
next day) onto prebaked quartz fiber filters (Pall Tissuquartz 2500QAT-UP, Ø = 150 mm) using high-volume samplers (Aerosol Sampler DHA-80, DIGITEL; 24 h at 30 m3h−1). After collection, all filter samples were wrapped in aluminum foil, sealed in zipper plastic bags, and stored at <4◦C un-til further analysis. More details on the preparation, storage, and handling of these filter samples can be found in Samaké et al. (2019b). A total of 69 samples and 6 field blanks were collected.
Surface soil samples (0–5 cm depth, 15 cm×15 cm area) were simultaneously collected from two fields within the pea and oilseed rape growing areas. The fields are located in the immediate vicinity of the PM10 sampler and under the
prevailing wind directions (Fig. 1). To represent as closely as possible the local soil microbial communities, we ran-domly collected five subsamples (about 100 g per sampling unit) within each parcel and pooled them. Topsoil sampling took place on a weekly basis during the campaign period. After collection and homogenization, 15 g of each subsam-ple was stored in airtight containers (sterile bottles, Schott, GL45, 100 mL) containing the same weight of sterile sil-ica gel (around 15 g). Such a soil desiccation method is a straightforward approach to prevent any microbial growth and change in community over time at room temperature (Taberlet et al., 2018). A total of eight topsoil samples were collected for each parcel.
Finally, leaf samples were collected from the major types of vegetation within the reference sector. These include leaves of oilseed rape, pea, oak, maple, beech, and herbs (Fig. 1). A total of eight leaf samples were analyzed. These samples were also stored in airtight containers (sterile bot-tles, Schott, GL45, 100 mL) containing 15 g of silica gel. It should be noted that leaf samples were collected only once, 4 weeks after the end of PM and soil sampling, while the major crops were still on site.
2.3 Chemical analyses
Daily PM10 samples were analyzed for various chemical
species using subsampled fractions of the collection filters and a large array of analytical methods. Detailed information
Figure 1. Overview of the sampling area at the OPE site (France). (a) Location of sampling units and (b) wind conditions (speed and direction) during the field-sampling campaign period.
on all the chemical-analysis procedures has been reported previously (Golly et al., 2018; Samaké et al., 2019b; Waked et al., 2014). Briefly, SCs (i.e., polyols and saccharides) and water-soluble ions (including Ca2+) were systematically an-alyzed in all samples, using respectively high-performance liquid chromatography with pulsed amperometric detection (HPLC-PAD) and ionic chromatography (IC; Thermo Fisher ICS 3000, USA). Free-cellulose concentrations were deter-mined using an optimized enzymatic hydrolysis (Samaké et al., 2019a) and the subsequent analysis method of the re-sultant glucose units using HPLC-PAD (Golly et al., 2018; Samaké et al., 2019b; Waked et al., 2014). Organic and elemental carbon (OC, EC) were analyzed using a Sunset thermal-optic instrument and the EUSAAR2 protocol (Cav-alli et al., 2010). This analytical method requires a high tem-perature, thereby constraining the choice of quartz as the sampling filter material. OM content in PM10 samples was
then estimated using an OM-to-OC conversion factor of 1.8: OM = 1.8 × OC (Samaké et al., 2019a, b). This value of 1.8 for the OM/OC ratio was chosen on the basis of previous studies carried out in France (Samaké et al., 2019b, and ref-erences therein)
2.4 Biological analyses: DNA extraction in PM10
samples
Aerosol samples typically contain very low DNA concentra-tions, and the DNA-binding properties of the quartz fibers of aerosol collection filters make its extraction with tradi-tional protocols challenging (Dommergue et al., 2019; Jiang et al., 2015; Luhung et al., 2015). In the present study, we were also constrained by the limited daily collection filter surface for the simultaneous chemical and microbiological analyses of the same filters. To circumvent issues of low ef-ficiency during genomic DNA extraction, several technical improvements have been made to optimize the extraction of
high-quality DNA from PM10 samples (Dommergue et al.,
2019; Jiang et al., 2015; Luhung et al., 2015). This includes thermal water bath sonication helping the lysis process in thick cell walls (e.g., fungal spores and Gram-positive bacte-ria), which might not be effectively lysed solely by means of bead beating (Luhung et al., 2015). Some consecutive (2 d at maximum) quartz filter samples with low OM concentrations were also pooled when necessary. Detailed information re-garding the resultant composite samples (labeled A1 to A36) is presented in Table S1 in the Supplement. Figure S1 in the Supplement presents the average concentration levels of SC species in each sample. The results clearly show that air sam-ples can be categorized from low (background, from A1 to A4 and A21 to A36) to high (peak, from A5 to A20) PM10
-SC concentration levels.
In terms of DNA extraction, one-quarter (about 38.5 cm2) of each filter sample was used. First, filter aliquots were asep-tically inserted into individual 50 mL Falcon tubes filed with sterilized saturated phosphate buffer (Na2HPO4, NaH2PO4,
0.12 M; pH ≈ 8). PM10 was desorbed from the filter
sam-ples by gentle shaking for 10 min at 250 rpm. This pretreat-ment allows the separation of the collected particles from the quartz filters thanks to the high competing interaction be-tween the saturated phosphate buffer and the charged biolog-ical materials (Jiang et al., 2015; Taberlet et al., 2018). After gentle vortex mixing, the subsequent resuspension was fil-tered with a polyethersulfone membrane disk filter (Supor® PES 47 mm 200, 0.2 µm, Pall, USA). We repeated this des-orbing step three times to enhance the recovery of the bio-logical material from the quartz filters. Each collection PES membrane was then shredded into small pieces and used for DNA extractions using the DNeasy PowerWater kit (Qiagen, Germantown, MD, USA). The standard protocol of the sup-plier was followed with only minor modifications: 30 min of thermal water bath sonication at 65◦C (EMAG, Emmi-60 HC, Germany; 50 % efficiency) and 5 min of bead beating
before and after sonication were added. Finally, DNA was eluted in 50 µL of EB buffer. Such an optimized protocol has been recently shown to produce a 10-fold increase in DNA extraction efficiency (Dommergue et al., 2019; Luhung et al., 2015), thereby allowing high-throughput sequencing of air samples. Note that all the steps mentioned above were per-formed under laminar flow hoods and that materials (filter funnels, forceps, and scissors) were sterilized prior to use. 2.4.1 Biological analyses: DNA extraction from soil and
leaf samples
The soil sample pretreatment and the extracellular DNA ex-traction were achieved following an optimized protocol pro-posed elsewhere (Taberlet et al., 2018). Briefly, this proto-col involves thoroughly mixing and extracting 15 g of soil in 15 mL of sterile saturated phosphate buffer for 15 min. About 2 mL of the resulting extracts was centrifuged for 10 min at 10 000 g, and 500 µL of the resulting supernatant was used for DNA extraction using the NucleoSpin Soil Kit (Macherey-Nagel, Düren, Germany) following the manufac-turer’s original protocol after skipping the cell lysis step. Fi-nally, DNA was eluted with 100 µL of SE buffer.
To extract DNA from either endophytic or epiphytic mi-croorganisms, aliquots of leaf samples (about 25–30 mg) were extracted with the DNeasy Plant Mini Kit (QIAGEN, Germany) according to the supplier’s instructions with the following minor modifications: after the resuspension of powdered samples in 400 µL of AP1 buffer, the samples were incubated for 45 min at 65◦C with RNase A. Finally, DNA was eluted with 100 µL of AE buffer.
2.4.2 Biological analyses: polymerase chain reaction amplification and sequencing
Bacterial and fungal community compositions were surveyed using, respectively, the Bact02 (Forward 50–KGCCAGCMGCCGCGGTAA–30 and Reverse 30– GGACTACCMGGGTATCTAA–50) and Fung02 (Forward 50–GGAAGTAAAAGTCGTAACAAGG–30 and Reverse 30–CAAGAGATCCGTTGYTGAAAGTK–50) published primer pairs (see Taberlet et al., 2018, for details on these primers). The primer pair Bact02 targets the V4 region of the bacterial 16S rDNA region while the Fung02 primer pair targets the nuclear ribosomal internal transcribed spacer region 1 (ITS1). Four independent PCR (polymerase chain reaction) replicates were carried out for each DNA extract. Eight nucleotide tags were added to both primer ends to uniquely identify each sample, ensuring that each PCR replicate was labeled by a unique combination of forward and reverse tags. The tag sequences were created with the oligotag command within the open-source OBITools software suite (Boyer et al., 2016) so that all pairwise tag combinations were differentiated by at least five different base pairs (Taberlet et al., 2018).
DNA amplification was performed in a 20 µL total vol-ume solution containing 10 µL of AmpliTaq Gold 360 Master Mix (Applied Biosystems, Foster City, CA, USA), 0.16 µL of 20 mg mL−1 bovine serum albumin (BSA; Roche Diagnos-tics, Basel, Switzerland), 0.2 µM of each primer, and 2 µL of diluted DNA extract. DNA extracts from soil and filters were diluted eight times, while DNA extracts from leaves were diluted four times. Amplifications were performed us-ing the followus-ing thermocyclus-ing program: an initial activa-tion of DNA polymerase for 10 min at 95◦C; x cycles of 30 s denaturation at 95◦C, 30 s annealing at 53◦C and 56◦C for bacteria and fungi, respectively, and 90 s elongation at 72◦C; and a final extension at 72◦C for 7 min. The number of cy-cles x was determined by qPCR and set at 40 for all mark-ers and DNA extract types, except for the Bact02 amplifica-tion of soil and leaf samples (30 cycles) and the Fung02 am-plification of filter samples (42 cycles). After amam-plification, about 10 % of amplification products were randomly selected and verified using a QIAxcel Advanced device (QIAGEN, Hilden, Germany) equipped with a high-resolution cartridge for separation.
After amplification, PCR products from the same marker were pooled in equal volumes and cleaned with the MinElute PCR purification kit (Qiagen, Hilden, Ger-many), following the manufacturer’s instructions. The two pools were sent to Fasteris SA (Geneva, Switzerland; https://www.fasteris.com/dna/, last access: 10 December 2019) for library preparation and MiSeq Illumina 2 × 250 bp paired-end sequencing. The two sequencing libraries (one per marker) were prepared according to the PCR-free MetaFast protocol (https://www.fasteris.com/dna/?q= content/metafast-protocol-amplicon-metagenomic-analysis, last access: 10 May 2020), which aims at limiting the formation of chimeras.
To monitor any potential false positives inherent to tag jumps and contamination (Schnell et al., 2015), the sequenc-ing experiment included both extraction and PCR negatives, as well as unused tag combinations.
2.4.3 Bioinformatic analyses of raw reads
The Illumina raw sequence reads were processed separately for each library using the OBITools software suite (Boyer et al., 2016), specifically dedicated to metabarcoding data pro-cessing. First, the raw paired-ends were assembled using the illuminapairedend program, and the sequences with a low alignment score (fastq average quality score <40) were dis-carded. The aligned sequences were then assigned to the cor-responding PCR replicates with the program ngsfilter by al-lowing zero and two mismatches on tags and primers, respec-tively. Strictly identical sequences were dereplicated using the program obuniq, and a basic filtration step was performed with the obigrep program to select sequences within the ex-pected range length (i.e., longer than 65 and 39 bp for fungi and bacteria, respectively, excluding tags and primers),
with-out ambiguous nucleotides, and observed at least 10 times in at least one PCR replicate.
The remaining unique sequences were grouped and as-signed to molecular operational taxonomic units (MOTUs) with a 97 % sequence identity using the Sumatra and Sumaclust programs (Mercier et al., 2013). The Sumatra algorithm computes pairwise similarities among sequences based on the length of the longest common subsequence, and the Sumaclust program uses these similarities to cluster the sequences (Mercier et al., 2013). An abundance of sequences belonging to the same cluster was summed up, and the cluster center was defined as the MOTU representative of the cluster (Mercier et al., 2013).
The taxonomic classification of each MOTU was per-formed using the ecotag program (Boyer et al., 2016), which uses full-length metabarcodes as references. The ecoPCR program (Ficetola et al., 2010) was used to build the metabar-code reference database for each marker. Briefly, ecoPCR performs an in silico amplification within the EMBL public database (release 133), using the Fung02 and Bact02 primer pairs and allowing a maximum of three mismatches per primer. The resultant reference database was further refined by keeping only sequence records assigned at the species, genus, and family levels.
After taxonomic assignment, data sets were acquired, and further processing with the open-source R software (RStu-dio interface, version 3.4.1) was performed to filter out chimeras, potential contaminants, and failed PCR replicates. More specifically, MOTUs that were highly dissimilar to any reference sequence (sequence identity <0.95) were con-sidered chimeras and discarded. Secondly, MOTUs whose abundance was higher in extraction and PCR negatives were also excluded. Finally, PCR replicates inconstantly distant from the barycenter of the four PCR replicates correspond-ing to the same sample were considered dysfunctional and discarded. The remaining PCR replicates were summed up per sample.
2.5 Data analysis
Unless specified otherwise, all exploratory statistical anal-yses were achieved with R. Rarefaction and extrapolation curves were obtained with the iNEXT 2.0-12 package (Hsieh et al., 2016) to investigate the gain in species richness as we increased the sequencing depth for each sample. Alpha di-versity estimators including Shannon and Chao1 were cal-culated with the phyloseq 1.22-3 package (McMurdie and Holmes, 2013) on data rarefied to the same sequencing depth per sample type (see Table S2 for details on the rarefaction depths). Nonmetric multidimensional scaling (NMDS) ordi-nation analysis was performed to decipher the temporal pat-terns in airborne microbial community structures (phylum or class taxonomic group) in air samples. These analyses were achieved with the metaMDS function within the vegan package (Oksanen et al., 2019) with the number of random
starts set to 500. The NMDS ordinations were obtained us-ing pairwise dissimilarity matrices based on Bray–Curtis in-dex. The envfit function implemented in vegan was used to assess the airborne microbial communities, which could ex-plain the temporal dynamics of ambient SC species concen-trations. Pairwise analysis of similarity (ANOSIM) was per-formed to assess similarity between groups of PM10aerosol
samples. This was achieved using the anosim function of ve-gan (Oksanen et al., 2019) with the number of permutations set to 999. Spearman’s rank correlation analysis was used to investigate further the relationship between airborne micro-bial communities and SC species.
To gain further insight into the dominant source of SC-associated microbial communities, NMDS analysis based on Horn distance was performed to compare the microbial com-munity composition similarities between PM10aerosol, soil,
and leaf samples.
3 Results
3.1 Primary sugar compounds and relative contributions to OM mass
Temporal dynamics of daily PM10carbonaceous components
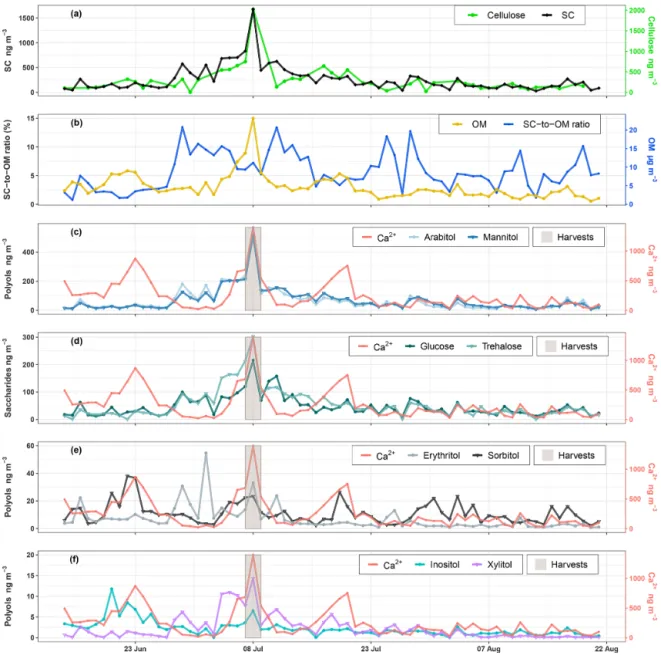
(e.g., primary sugar compounds, cellulose, and OM) are pre-sented in Fig. 2. Nine SCs including seven polyols and two saccharide compounds have been quantified in all ambient PM10 collected at the study site. Ambient SC
concentra-tion levels peaked on 8 August 2017 in excellent agree-ment with the daily harvest activities around the study site (Fig. 2a). The average concentration (average ± SD) of to-tal SCs during the campaign is 259.8 ± 253.8 ng m−3 with a range of 26.6 to 1679.5 ng m−3, contributing on average to 5.7 ± 3.2 % of total OM mass in PM10 with a range of
0.8–13.5 % (Fig. 2b). The total measured polyols present an average concentration of 26.3 ± 54.4 ng m−3. Among all the measured polyols, arabitol (67.4±83.1 ng m−3) and mannitol (68.1 ± 75.3 ng m−3) are the predominant species, followed by lesser amounts of sorbitol (10.9 ± 7.6 ng m−3), erythri-tol (7.0±8.8 ng m−3), inositol (2.3±2.0 ng m−3), and xylitol (2.3 ± 3.0 ng m−3). Glycerol was also observed in our sam-ples but with concentrations frequently below the quantifi-cation limit. The average concentration of saccharide com-pounds is 51.2±45.0 ng m−3. Trehalose (55.8±51.9 ng m−3) is the most abundant saccharide species, followed by glucose (46.9 ± 37.1 ng m−3). The average concentration of calcium is 251.1 ± 248.4 ng m−3.
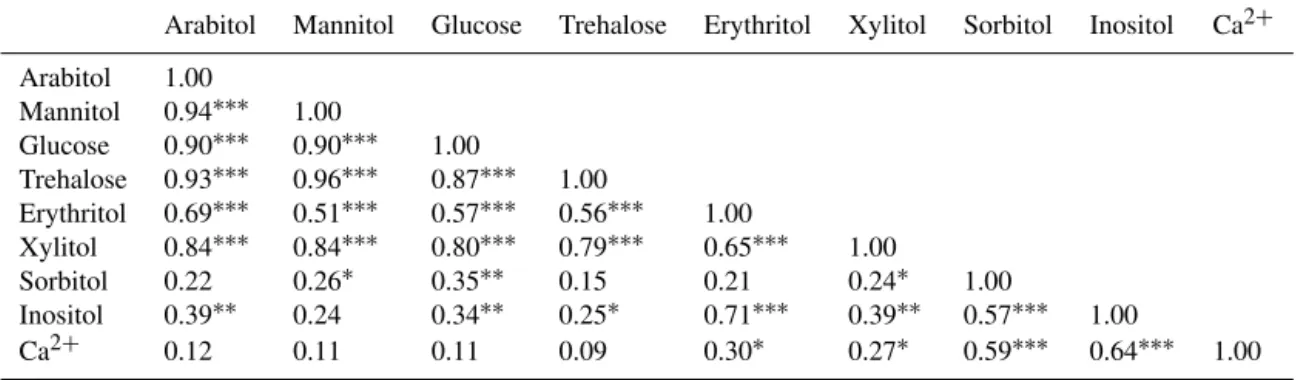
A Spearman’s rank correlation analysis based on the daily dynamics was used to examine the relationships between SC species. As shown in Table 1, sorbitol and inositol are well-correlated linearly (R = 0.57, p<0.001). Herein, sor-bitol (R = 0.59, p<0.001) and inositol (R = 0.64, p<0.001) are significantly correlated to Ca2+. It can also be noted that all other SC species are highly correlated with each other
Figure 2. Ambient concentrations of carbonaceous components in PM10. (a, c–f) Daily variations in SC and calcium concentrations along with daily agricultural activities around the site. (b) Contribution of SCs to organic matter mass. Results for 9-week daily measurements indicate that SCs together represent a large fraction of OM, contributing to between 0.8 % to 13.5 % of OM mass in summer. Glycerol is not presented because its concentration was generally below the quantification limit.
(p<0.001) and that they are weakly correlated to the tempo-ral dynamics of sorbitol and inositol (Table 1).
3.2 Microbial characterization of samples, richness and diversity
The structures of bacterial and fungal communities were gen-erated for the 62 collected samples, consisting of 36 aerosol, 18 surface soil, and 8 leaf samples. After paired-end assem-bly of sequence reads, sample assignment, filtering based on sequence length and quality, and discarding rare sequences, we are left with 2 575 857 and 1 647 000 reads respectively for fungi and bacteria, corresponding to 4762 and 5852
unique sequences, respectively. After the clustering of high-quality sequences, potential contaminants, and chimeras, the final data sets (all samples pooled) consist respectively of 597 and 944 MOTUs for fungi and bacteria, with 1 959 549 and 901 539 reads. The average number of reads (average ± SE) per sample is 31 607 ± 2072 and 14 563 ± 1221 for fungi and bacteria, respectively. The rarefaction curves of MOTU di-versity showed common logarithmic shapes approaching a plateau in all cases (Fig. S2). This indicates an overall suffi-cient sequencing depth to capture the diversity of sequences occurring in the different types of samples. To compare the microbial community diversity and species richness, data normalization was performed by randomly selecting from
Table 1. Relationships between SCs and calcium in PM10from the study site. Spearman’s rank correlation analyses are based on the daily dynamics of chemical species (n = 69).
Arabitol Mannitol Glucose Trehalose Erythritol Xylitol Sorbitol Inositol Ca2+ Arabitol 1.00 Mannitol 0.94∗∗∗ 1.00 Glucose 0.90∗∗∗ 0.90∗∗∗ 1.00 Trehalose 0.93∗∗∗ 0.96∗∗∗ 0.87∗∗∗ 1.00 Erythritol 0.69∗∗∗ 0.51∗∗∗ 0.57∗∗∗ 0.56∗∗∗ 1.00 Xylitol 0.84∗∗∗ 0.84∗∗∗ 0.80∗∗∗ 0.79∗∗∗ 0.65∗∗∗ 1.00 Sorbitol 0.22 0.26∗ 0.35∗∗ 0.15 0.21 0.24∗ 1.00 Inositol 0.39∗∗ 0.24 0.34∗∗ 0.25∗ 0.71∗∗∗ 0.39∗∗ 0.57∗∗∗ 1.00 Ca2+ 0.12 0.11 0.11 0.09 0.30∗ 0.27∗ 0.59∗∗∗ 0.64∗∗∗ 1.00 Note:∗p<0.1,∗∗p<0.01,∗∗∗p<0.001
each sample 4287 fungal sequence reads and 2 865 bacte-rial sequence reads. The Chao1 values of fungi are higher for aerosol samples than for soil and leaf samples (p<0.05), indicating higher richness in airborne PM10 (Fig. S3a). In
contrast, PM10 and soil samples showed higher values of
Shannon index (p<0.05), indicating a higher fungal diver-sity in these ecosystems. The soil harbors higher bacterial richness and diversity than PM10 (p<0.05), which in turn
harbors greater richness and diversity compared to leaf sam-ples (p<0.05) (Fig. S3b).
3.3 Taxonomic composition of airborne PM10
3.3.1 Fungal communities
The statistical assignment of airborne PM10 fungal
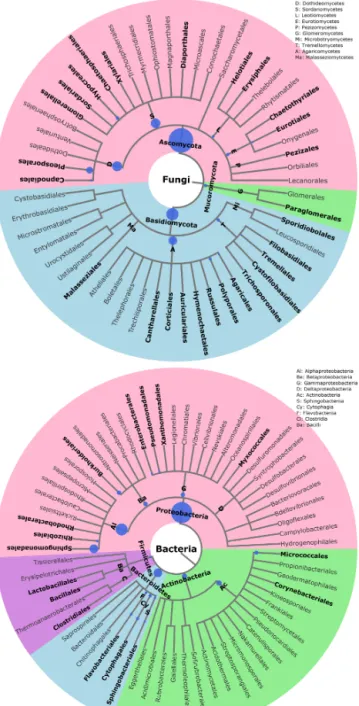
MO-TUs at different taxonomic levels reveals 3 phyla, 17 classes, 58 orders, and 160 families (Fig. 3). Interest-ingly, fungal MOTUs are dominated by two common phyla: Ascomycota (accounting for an average of 76 ± 20.4 % (average ± SD) of fungal sequences across all air samples), followed by Basidiomycota (23.9 ± 20.4 %). The remaining sequences correspond to Mucoromycota (<0.01 %) and to unclassified sequences (approximately 0.03 %). As evidenced in Fig. 3, the predominant (>1 %) fungal classes are Dothideomycetes (70.0 %), followed by Agaricomycetes (16.0 %), Tremellomycetes (5.0 %), Sor-dariomycetes (2.6 %), Microbotryomycetes (2.2 %), Leo-tiomycetes (1.8 %), and EuroLeo-tiomycetes (1.4 %). The pre-dominant orders include Pleosporales (35.5 %) and Capnodi-ales (34.4 %), which belong to Ascomycota. Likewise, the dominant orders in Basidiomycota are Polyporales (7.5 %), followed by Russulales (4.2 %), Tremellales (2.8 %), Hy-menochaetales (2.6 %), and Sporidiobolales (2.2 %). At the genus level, about 327 taxa are characterized across all air samples, among which Cladosporium (32.9 %), Al-ternaria(15.0 %), Epicoccum (15.0 %), Peniophora (2.7 %), Sporobolomyces(2.2 %), Phlebia (2.0 %), and Pyrenophora (1.9 %) are the most abundant communities.
3.3.2 Bacterial communities
For bacterial communities, the Bact02 marker allowed 17 phyla, 43 classes, 91 orders, and 182 families to be identified (Fig. 3). Predominant phyla include Proteobacteria (55.3 ± 8.6 %), followed by Bacteroidetes (22.1±4.1 %), Actinobac-teria (14.2±2.2 %), and Firmicutes (6±5.9 %), with less than 1.8 % of the total bacterial sequence reads being unclassified. At the class level, the predominant bacteria are Alphapro-teobacteria (29.4 %), Actinobacteria (13.8 %), Gammapro-teobacteria (12.1 %), BetaproGammapro-teobacteria (11.4 %), Cytopha-gia (8.3 %), Flavobacteriia (6.3 %), Sphingobacteriia (5.9 %), Bacilli (3.5 %), and Clostridia (2.2 %). As many as 392 gen-era were detected in all aerosol samples, although many sequences (22.8 %) could not be taxonomically assigned at the genus level. The most abundant (>2 %) genera are Sphingomonas (20.0 %), followed by Massilia (8.4 %), Hymenobacter (5.5 %), Pseudomonas (5.1 %), Pedobacter (3.3 %), Flavobacterium (2.8 %), Chryseobacterium (2.8 %), Frigoribacterium(2.5 %), and Methylobacterium (1.9 %). 3.4 Relationship between airborne microbial
community abundances and PM10SC species
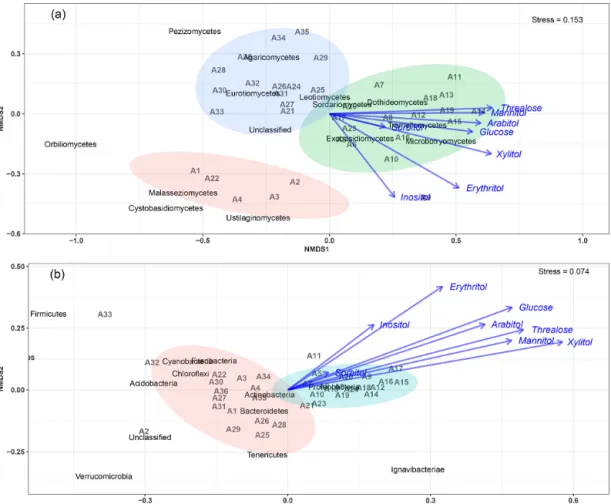
The NMDS (nonmetric multidimensional scaling) ordination exploring the temporal dynamics of microbial community beta diversity among all PM10aerosol samples revealed
sig-nificant temporal shifts in community structure for both fungi and bacteria (Fig. 4).
An NMDS (two dimensions, stress = 0.15) based on fun-gal class-level compositions (Fig. 4a) results in three dis-tinct clusters of PM10 samples. With one exception (A23),
all air samples with higher SC concentration levels (A5 to A20, see Table S2 and Fig. S1) are clustered together and are distinct from those with background levels of at-mospheric SC concentrations. This pattern is further con-firmed with the analysis of similarity, which shows a sig-nificant separation of clusters of samples (ANOSIM, R = 0.31, p<0.01). As evidenced in Fig. 4a, this difference is
Figure 3. Taxonomic and phylogenetic trees of fungal and bacterial community structures in PM10at the study site. Phylogenetic trees
are analyzed with the Environment for Tree Exploration (ETE3) package implemented in Python (Huerta-Cepas et al., 2016). The circle from the inner to the outer layer represents classification from kingdom to order successively. Further details on fungal and bac-terial taxa at genus level are provided in Fig. S4. The node size represents the average relative abundance of taxa. Only nodes with relative abundance ≥ 1 are highlighted in bold.
mainly explained by the NMDS1 axis, which results from the predominance of only a few class-level fungi in PM10
samples, including Dothideomycetes, Tremellomycetes, Mi-crobotryomycetes, and Exobasidiomycetes. Vector fitting of
chemical time series data to the NMDS ordination plot indi-cates that the latter four fungal community assemblages best correlate with individual SC species. Mannitol (R2=0.37, p<0.01), arabitol (R2=0.36, p<0.01), trehalose (R2= 0.41, p<0.01), glucose (R2=0.33, p<0.01), xylitol (R2= 0.45, p<0.01), erythritol (R2=0.40, p<0.01), and inositol (R2=0.24, p = 0.01) are significantly positively correlated to the fungal assemblage ordination solution.
For bacterial phylum-level compositions (Fig. 4b), an NMDS ordination (two dimensions, stress = 0.07) analysis differentiates the PM10samples into two distinct clusters
ac-cording to their SC concentration levels. All air samples with higher SC concentration levels except two (A23 and A24) are clustered separately from those with ambient background concentration levels. ANOSIM analysis (R = 0.69, p<0.01) further confirms the significant difference between the two clusters of samples. Proteobacteria constitute the most dom-inant bacterial phylum during the SC peak over the sam-pling period. Interestingly, changes in individual SC profiles are significantly correlated with bacterial community tempo-ral shifts (Fig. 4b). Mannitol (R2=0.25, p<0.01), arabitol (R2=0.24, p<0.01), trehalose (R2=0.32, p<0.01), glu-cose (R2=0.32, p<0.01), xylitol (R2=0.38, p<0.01), and erythritol (R2=0.27, p<0.01) are mainly positively corre-lated to the bacterial community dissimilarity.
Given the distinct clustering patterns of airborne PM10
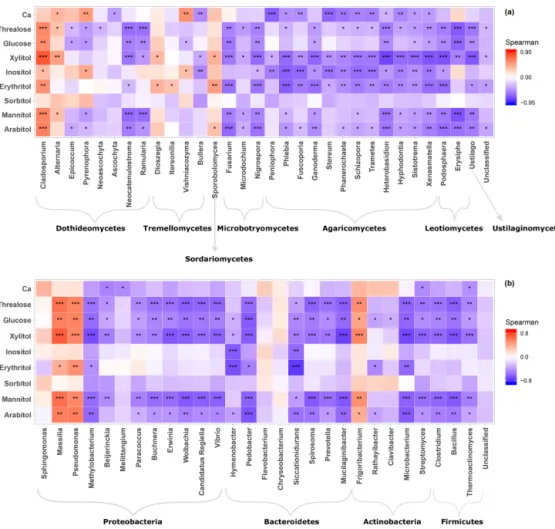
mi-crobial beta diversity structures according to SC concentra-tion levels, a Pearson’s rank correlaconcentra-tion analysis has been performed to further examine the relationship between indi-vidual SC profiles and airborne microbial community abun-dance at phylum and class levels. This analysis reveals that for class-level fungi, the abundances of Dothideomycetes, Tremellomycetes, and Microbotryomycetes are highly pos-itively correlated (p<0.05) to the temporal evolutions of the individual SC species concentration levels (Fig. S5a). Likewise, ambient SC species concentration levels are sig-nificantly correlated (p<0.05) to the Proteobacteria phylum (Fig. S5b). To gain further insight into the airborne micro-bial fingerprints associated with ambient SC species, cor-relation analyses were also performed at a finer taxonomic level. These analyses show that the temporal dynamics of SC species primarily correlates best (p<0.05) with the Cla-dosporium, Alternaria, Sporobolomyces, and Dioszegia fun-gal genera (Fig. 5a). Similarly, the time series of SC species are primarily positively correlated (p<0.05) with Massilia, Pseudomonas, Frigoribacterium, and to a lesser degree (non-significant) with the Sphingomonas bacterial genus (Fig. 5b). 3.5 Sources of airborne microbial communities at the
study site
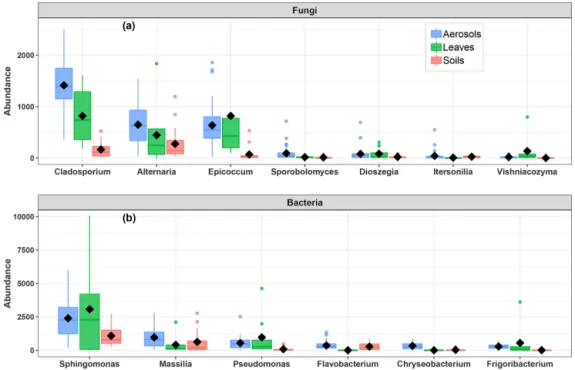
As shown in Fig. 6, the airborne microbial genera most positively correlated with SC species are also distributed in the surrounding environmental samples of surface soils and leaves. In addition, microbial taxa of PM10 associated with
Figure 4. Main airborne microbial communities associated with atmospheric concentrations of SC species. NMDS ordination plots are used to show the relationship among time series of aerosol samples. The stress values indicate an adequate two-dimensional picture of sample distribution. Ellipses represent 95 % confidence intervals for the cluster centroid. NMDS analyses are performed directly on taxonomically assigned quality-filtered sequence tables at class and phylum level for fungi (a) and bacteria (b), respectively. Ambient primary sugar concentration levels in PM10appear to be highly influenced by the airborne microbial community structure and abundance. Similar results
are obtained with taxonomically assigned MOTU tables, highlighting the robustness of our methodology.
SC species are generally more abundant in the leaf than in the topsoil samples (Fig. 6). In order to further explore and visu-alize the similarity of species compositions across local envi-ronment types, we conducted an NMDS ordination analysis (Fig. 7). As evidenced in Fig. 7, the beta diversities of fungal and bacterial MOTUs are more similar within the same habi-tat (PM10, plant, or soil) and are grouped across habitats as
expected. Interestingly, the beta diversities of fungal and bac-terial MOTUs in leaf samples and those in airborne PM10are
generally not readily distinguishable, with similarity becom-ing more prominent durbecom-ing atmospheric peaks of SC concen-tration levels (Fig. 6). However, the overall beta diversities in airborne PM10and in leaf samples are significantly different
from those from topsoil samples (ANOSIM, R = 0.89 and 0.80 and p<0.01 for fungal and bacterial communities, re-spectively), without any overlap regardless of whether or not harvesting activities are performed around the sampling site.
This observation is also confirmed by an unsupervised hi-erarchical cluster analysis, which reveals a pattern similar to that observed in the NMDS ordination, where taxa from leaf samples and airborne PM10are clustered together regardless
of whether ambient concentration levels of SC peaked or not. They are clustered separately from those of topsoil samples (Fig. S7).
4 Discussion
Very few studies exist on the interactions between the air mi-crobiome and PM chemical profiles (Cao et al., 2014; Elbert et al., 2007). In this study, we used a comprehensive multi-disciplinary approach to produce for the first time airborne microbial fingerprints associated with SC species in PM10
and to identify the dominant sources of SCs in an extensively cultivated, continental rural area.
Figure 5. Heatmap of Spearman’s rank correlation between SCs and abundance of airborne communities at the study site. (a) Fungal genera and (b) bacterial genera. Only genera with relative abundance ≥ 1 are shown.
4.1 SCs as a major source of organic matter in PM10
SC species have recently been reported to be ubiquitous in PM10collected in several areas in France (Golly et al., 2018;
Samaké et al., 2019b). In this study, the total SCs presented an average concentration of 259.8 ± 253.8 ng m−3 with a range of 26.6 to 1679.5 ng m−3in all air samples. These con-centration values are on average 5 times higher than those typically observed in urban areas in France (average val-ues during summer 48.5 ± 43.6 ng m−3) (Golly et al., 2018; Samaké et al., 2019a, b). However, these concentration levels are in agreement with a previous study conducted in a similar environment, i.e., continental rural sites located in large crop fields (Yan et al., 2019).
The total concentrations of SCs quantified in atmospheric PM10 over our study site accounted for 0.8 % to 13.5 % of
the daily OM mass. This is remarkable considering that less than 20 % of total particulate OM mass can generally be identified at the molecular level. Hence, our results for a 9-week-long period indicate that SC could be a major identi-fied molecular fraction of OM for agricultural areas during summer, which is in agreement with several previous studies
conducted worldwide (Jia et al., 2010b; Verma et al., 2018; Yan et al., 2019). Further, it has been shown (Samaké et al., 2019a) that the identified polyols probably represent only a small fraction of the emission flux from this PBOA source and that a large fraction of the co-emitted organic material remains unknown. Hence, the PBOA source can potentially represent, for part of the year, a major source of atmospheric OM unaccounted for in CTMs.
4.2 Composition of airborne fungal and bacterial communities
In this study, 597 (39–132 MOTUs per sample) and 944 (31– 129 MOTUs per sample) MOTUs were obtained for the fun-gal and bacterial libraries, respectively, reflecting the high richness of airborne microbial communities associated with ambient PM10in this rural agricultural zone in France.
Air-borne fungi were dominated by Ascomycota (AMC) fol-lowed by Basidiomycota (BMC) phyla, consistent with the natural feature of many Ascomycota, whose single-celled or hyphal forms are small enough to be rapidly aerosolized, in contrast to many Basidiomycota that are typically too large
Figure 6. Abundance of SC-species-associated microbial taxa. (a) Fungal genera and (b) bacterial genera in the airborne PM10samples and
surrounding environmental samples. Black markers inside each box indicate the mean abundance value, while the top, middle, and bottom lines of the box represent the 75th, median, and 25th percentiles, respectively. The whiskers at the top and bottom of the box extend from the 95th to the 5th percentiles. Data were rarefied at the same minimum sequencing depth.
Figure 7. Compositional comparison of sample types in a NMDS scaling ordination. NMDS plots are constructed from a Horn distance matrix of MOTUs abundances for fungi (a) and bacteria (b). Data sets are rarefied at the same sequencing depth. The stress values indicate an adequate two-dimensional picture of sample distribution. Ellipses represent 95 % confidence intervals for the cluster centroids. Circular and triangular shapes highlight air PM10samples with background and peak SC concentrations, respectively.
to be easily aerosolized (Moore et al., 2011; Womack et al., 2015). Many members of AMC and BMC are known to ac-tively eject ascospores and basidiospores, as well as aqueous jets and droplets containing a mixture of carbohydrates and inorganic solutes, into the atmosphere (Elbert et al., 2007; Womack et al., 2015). The prevalence of Ascomycota and Basidiomycota is consistent with results from previous stud-ies also indicating that the Dikarya subkingdom
(Ascomy-cota and Basidiomy(Ascomy-cota) represents about 98 % of known species in the biological kingdom of Eumycota (i.e., fungi) in the atmosphere (Elbert et al., 2007; James et al., 2006; Womack et al., 2015; Xu et al., 2017).
Airborne bacteria in this study belonged mainly to the Proteobacteria, Bacteroidetes, Actinobacteria, and Firmi-cutes phyla, consistent with previous studies (Liu et al., 2019; Maron et al., 2005; Wei et al., 2019b). Gram-negative
Proteobacteria constitute a major taxonomic group among prokaryotes (Itävaara et al., 2016; Yadav et al., 2018), in-cluding bacterial taxa which are very diverse, important in agriculture, and capable of fixing nitrogen in symbiosis with plants (Itävaara et al., 2016; Yadav et al., 2018). Proteobacte-ria can survive under conditions with very low nutrient con-tent, which explains their atmospheric versatility (Itävaara et al., 2016; Yadav et al., 2018). These results are simi-lar to those observed in previous studies conducted in dif-ferent environments around the world, where Proteobacte-ria, ActinobacteProteobacte-ria, and Firmicutes have also been reported as dominant bacterial phyla (Liu et al., 2019; Maron et al., 2005; Wei et al., 2019a). In particular, the most fre-quent Gram-negative (Proteobacteria and Bacteroidetes) and Gram-positive (Actinobacteria and Firmicutes) bacteria and filamentous fungi (Ascomycota and Basidiomycota) have been previously linked to raw straw handling activities. For instance, it has been suggested that straw combustion during agricultural activities could be a major source of airborne mi-croorganisms in PM2.5in the northern plains of China (Wei
et al., 2019a, b). However, in our study, SC species are not correlated (R = −0.09, p = 0.46; Fig. S7) with levoglucosan during the campaign period, confirming that biomass burn-ing is not an important source of airborne microbial taxa as-sociated with SCs in our PM10 series. Bubble bursting
as-sociated with sea spray could also potentially be a source of bacteria, fungi, and water-soluble organic species, along with sea salts, to PM10 (Prather et al., 2013; Zhu et al., 2015).
However, SC species were not found to be significantly re-lated to Cl− (R = −0.14, p = 0.28) or Na+ (R = −0.18, p =0.16), which are two inorganic tracers typical of marine sources, nor did they correlate with methanesulfonic acid (R = −0.05, p = 0.69), a well-known tracer of biogenic ma-rine activity (Arndt et al., 2017; Gaston et al., 2010). It there-fore seems unlikely that the sources of SCs from marine en-vironments were significant at this site. This point is further discussed in Sect. 4.4.
4.3 Atmospheric concentration levels of SC species in PM10are associated with the abundance of a few
specific airborne taxa of fungi and bacteria
SCs are widely produced in large quantities by many mi-croorganisms to cope with environmental stress conditions (Medeiros et al., 2006). SC species are known to accumu-late in high concentrations in microorganisms at low wa-ter availability to reduce intracellular wawa-ter activity and pre-vent enzyme inhibition due to dehydration (Hrynkiewicz et al., 2010). In addition, the temporal dynamics of ambient polyol concentrations has been suggested as an indicator to follow the general seasonal trend in airborne fungal spore counts (Bauer et al., 2008; Gosselin et al., 2016). Although this strategy has allowed the introduction of conversion ratios between specific polyol species (i.e., arabitol and mannitol) and airborne fungal spores in general (Bauer et al., 2008),
the structure of the airborne microbial community associated with SC species has not yet been studied. Our results provide culture-independent evidence that the airborne microbiome structure and the combined bacterial and fungal communi-ties largely determine the SC species concentration levels in PM10.
Temporal fluctuations in the abundance of only a few spe-cific fungal and bacterial genera reflect the temporal dy-namics of ambient SC concentrations. For fungi, genera that show a significant positive correlation (p<0.05) with SC species include Cladosporium, Alternaria, Sporobolomyces, and Dioszegia. Cladosporium and Alternaria are fungal gen-era that contribute on avgen-erage to 47.9 % of total fungal se-quence reads in our air samples series. These are asexual fun-gal genera that produce spores by dry-discharge mechanisms, wherein spores are detached from their parent colonies and easily dispersed by the ambient airflow or other external forces (e.g., raindrops, elevated temperature), as opposed to actively discharged spores with liquid jets or droplets in the air (Elbert et al., 2007; Wei et al., 2019b; Womack et al., 2015). Our results are consistent with the well-known sea-sonal behavior of airborne fungal spores with levels of Cla-dosporiumand Alternaria which have been shown to reach their maximum from early to midsummer in a rural agricul-tural area of Portugal (Oliveira et al., 2009).
Similarly, bacterial genera positively correlated with SC species are Massilia, Pseudomonas, Frigoribacterium, and Sphingomonas. Although it is the prevalent bacterial genus at the study site, Sphingomonas is indeed not significantly pos-itively correlated with SC species. The genus Sphingomonas is known to include numerous metabolically versatile species capable of using carbon compounds usually present in the at-mosphere (Cáliz et al., 2018). The atmospheric abundance of species affiliated with Massilia has already been linked to the change in the stage of plant development (Ofek et al., 2012), which can be attributed to the capacity of Massilia to promote plant growth through the production of indoleacetic acid (Kuffner et al., 2010) and siderophores (Hrynkiewizc et al., 2010), which makes it antagonistic towards Phytophthora infestans(Weinert et al., 2010).
As far as we know, this is the first study evaluating micro-bial fingerprints with SC species in atmospheric PM; hence, it is not possible to compare our correlation results with those of previous works. However, it has already been suggested that types and quantities of SC species produced by fungi under culture conditions are specific to microbial species and external conditions such as carbon source, drought, heat, etc. (Hrynkiewicz et al., 2010). In future studies, we intend to ap-ply a culture-dependent method to directly characterize the SC contents of some species amongst the dominant micro-bial taxa identified in this study after growth under several laboratory chambers, reproducing controlled environmental conditions in terms of temperature, water vapor, and carbon sources.
4.4 Local vegetation as a major source of airborne microbial taxa of PM10associated with SC species
There are still many challenging questions on the emission processes leading to fungi and bacteria being introduced into the atmosphere together with their chemical components. In particular, the potential influence of soil and vegetation and their respective roles in structuring airborne microbial com-munities are still debated (Lymperopoulou et al., 2016; Rath-nayake et al., 2016; Womack et al., 2015), especially since this knowledge is particularly essential for the precise mod-eling of PBOA emissions processes to the atmosphere within chemical transport models.
The characterization of the temporal dynamics of SC species concentrations could provide important information on PBOA sources in terms of composition, environmental drivers, and impacts. The results obtained over a 9-week pe-riod of daily PM10 SC measurements clearly show that the
temporal dynamics of sorbitol (R = 0.59, p<0.001) and in-ositol (R = 0.64, p<0.001) are well-correlated linearly with that of calcium, a typical inorganic water-soluble ion from crustal material. This indicates a common atmospheric ori-gin for these chemicals. Sorbitol and inositol are well-known reduced sugars that serve as a carbon source for microorgan-isms when other carbon sources are limited (Ng et al., 2018; Xue et al., 2010). In microorganisms, sorbitol and inositol are mainly produced by the reduction of intracellular glu-cose by aldose reductase in the cytoplasm (Ng et al., 2018; Welsh, 2000; Xue et al., 2010). Moreover, significant con-centrations of both sorbitol and inositol have already been measured in surface-soil samples from five cultivated fields in the San Joaquin Valley, USA (Jia et al., 2010b; Medeiros et al., 2006). Therefore, sorbitol and inositol are most likely associated with microorganisms from soil resuspension.
With the exception of sorbitol and inositol, all other SC species measured in air samples at our sampling site are strongly correlated with each other, indicating a common origin. Daily calcium concentration peaks are not systemat-ically associated with those of these other SC species. Inter-estingly, the highest atmospheric levels of these SC species occurred on 8 August 2017, coinciding well with daily har-vesting activities around the site. This is also consistent with the multi-year monitoring of the dominant SCs in PM10 at
this site, where ambient SCs showed a clear seasonal trend with higher values recorded in early August and in good agreement with harvesting activities around the study area every year from 2012 to 2017 (Samaké et al., 2019a). This suggests that the processes responsible for the dynamics of atmospheric concentrations of SCs are replicated annually and are most likely effective over large areas of field crop (Golly et al., 2018; Samaké et al., 2019a). Interestingly, glu-cose – the most common monosaccharide present in vascular plants and microorganism – has already been proposed as a molecular indicator of biota emitted into the atmosphere by vascular plants and/or by the resuspension of soil from
agricultural land (Jia et al., 2010b; Pietrogrande et al., 2014). Therefore, all other SC species measured in our series can be considered to be most likely the result of the mechanical resuspension of crop residues (e.g., leaf debris) and microor-ganisms attached to them. Other confirmations of this inter-pretation stem from the excellent daily covariations observed in the PM10between SC species levels and ambient cellulose,
which is widely considered a reliable indicator of plant de-bris sources in PM studies (Bozzetti et al., 2016; Hiranuma et al., 2019).
Microbial abundance and community structure in samples from the surrounding environment can provide further useful information on source apportionment and importance. Our data indicate that the airborne microbial genera most pos-itively correlated to SC species are also distributed in the surrounding environmental samples of both surface soils and leaves, suggesting a dominant influence of the local environ-ment for microbial taxa associated with SC species as op-posed to long-range transport. This observation makes sense since actively discharged ascospores and basidiospores are generally relatively large airborne particles with a short at-mospheric residence time (Elbert et al., 2007; Womack et al., 2015), limiting the possibilities of long-range dissemination. Accordingly, the majority of previous studies investigating the potential sources of air microbes identified local surface environments (e.g., leaves, soils) as having more important effects on the airborne microbiome structure in field crop ar-eas (Bowers et al., 2011; Wei et al., 2019b; Womack et al., 2015). This is all the more the case in our study with ho-mogeneous crop activities for tens to hundreds of kilometers around the site.
In the present study, microbial diversity and richness ob-served in the surface soils are generally higher than those on leaf surfaces. Microbial taxa which most positively corre-lated with PM10SC species are generally more abundant in
leaf than in topsoil samples. These results were unexpected and show the possible importance of leaf surfaces in struc-turing the airborne taxa associated with SC species. Con-sidering the general grouping of leaf samples and airborne PM10regardless of harvesting activities around the study site
and in addition to the separate assemblies of rarefied MOTUs in airborne PM10 and topsoil samples, it can be argued that
the aerial parts of plants are the major source of microbial taxa associated with SC species. Such an observation is most likely related to increased vegetative surfaces (e.g., leaves) in summer that provides sufficient nutrient resources for micro-bial growth (Rathnayake et al., 2016). By reviewing previous studies, Alternaria and Epicoccum, which made up 30 % of total fungal sequence reads in all air samples in this study, have been shown to be common saprobes or weak pathogens of leaf surfaces (Andersen et al., 2009). Similarly, Cladospo-rium, which accounted for 32.9 % of total fungal genera in all air samples, has also been shown to be a common sapro-trophic fungus, inhabiting decayed tree or plant debris (Wei et al., 2019b). The high relative abundance of Sphingomonas
and Massilia, accounting for 28.4 % of total bacterial genera in all air samples, is also noticeable. These two phyllosphere-inhabiting bacterial genera are well-known for their plant protective potential against phytopathogens (Aydogan et al., 2018; Rastogi et al., 2013).
Altogether, these observations support our interpretation that leaves are the major direct source of airborne fungi and bacteria during the summer months at this site of high agri-cultural activity. Endophytes and epiphytes can be dispersed in the air and transported vertically as particles by air cur-rents, much faster and more widely than by other mecha-nisms, such as direct dissemination from surface soil, which is generally controlled by soil moisture (Jocteur Monrozier et al., 1993). The most wind-dispersible soil constituents are indeed the smallest soil particles (i.e., clay-size fraction), which contain the largest number of microorganisms (Joc-teur Monrozier et al., 1993) and can only be released into the atmosphere under conditions of prolonged drought. This in-terpretation is also consistent with previous studies (Bowers et al., 2011; Liu et al., 2019; Lymperopoulou et al., 2016; Mhuireach et al., 2016), which also show the extent to which endophytes and epiphytes can serve as quantitatively impor-tant sources of airborne microbes during summertime when vegetation density is highest. For example, Lymperopoulou et al. (2016) observed that bacteria and fungi suspended in the air are generally 2 to more than 10 times more abundant in air that passed over 50 m of a vegetative surface than in air that is immediately upwind of the same vegetative surface. However, the relative abundance of taxa associated with SCs in surface soils in this study could also be indicative of a feedback loop, in which the soil may serve as a source of mi-crobial endophytes and epiphytes for plants, while the local vegetation in turn may serve as a source and sink of microbes for local soils during leaf senescence.
5 Conclusions
Primary biogenic organic aerosols (PBOAs) affect human health, climate, agriculture, etc. However, the details of mi-crobial communities associated with the temporal and spatial variations in atmospheric concentrations of SC, which are tracers of PBOAs, remain unknown. The present study aimed at identifying the airborne fungi and bacteria associated with SC species in PM10and their major sources in the
surround-ing environment (soils and vegetation). To that end, we com-bined high-throughput sequencing of bacteria and fungi with detailed physicochemical characterizations of PM10soil and
leaf samples collected at a continental rural background site located in a large agricultural area in France.
The main results demonstrate that the identified SC species are a major contributor of OM in summer, accounting to-gether for 0.8 % to 13.5 % of OM mass in air. The atmo-spheric concentration peaks of SC coincide with the daily harvest activities around the sampling site, pointing towards direct resuspension of biological materials, i.e., crop residues and associated microbiota as an important source of SC in our PM10series. Furthermore, we have also discovered that
the temporal evolutions of SC in PM10 are associated with
the abundance of only a few specific airborne fungal and bac-terial taxa. These microbial taxa are significantly enhanced in the surrounding environmental samples of leaves over sur-face soils. Finally, the excellent correlation of SC species and cellulose, a marker of plant materials, implies that local veg-etation is likely the most important source of fungal and bac-terial taxa associated with SC in PM10at rural locations
di-rectly influenced by agricultural activities in France. Our findings are a first step in the understanding of the processes leading to the emission of these important chem-ical species and the large OM fraction of PM in the atmo-sphere, and in the parametrization of these processes for their introduction in CTMs. They could also be used for planning efforts to reduce both the PBOA source strengths and the spreading of airborne microbial and derivative allergens such as endotoxins and mycotoxins. However, it remains to be in-vestigated how well different climate patterns and sampling site specificities, in terms of land use and vegetation cover, could affect our main conclusions.
Data availability. The sequencing data files are available from the DRYAD repository (https://doi.org/10.5061/dryad.2fqz612m4, Samaké et al., 2020). All relevant chemical and environmental data sets are archived at the IGE (Institut des Géosciences de l’Environnement) and are available upon request from the co-author (Jean-Luc Jaffrezo).
Supplement. The supplement related to this article is available on-line at: https://doi.org/10.5194/acp-20-5609-2020-supplement.
Author contributions. JLJ, JMFM, and GU supervised the thesis of AS, and JLJ, JMFM, GU, and AS designed the research project. PT gave advice for soil and leaf sampling. SC supervised the sample collections and provided the agricultural activity records. VJ devel-oped the analytical techniques for SC species and cellulose mea-surements. AS and AB performed the experiments. AB performed the bioinformatic analyses. AS performed statistical analyses and wrote the original draft. SW produced the circular phylogenetic trees. All authors reviewed and edited the final paper.
Competing interests. The authors declare that they have no conflict of interest.
Acknowledgements. We acknowledge the work of many engineers in the lab at the Institut des Géosciences de l’Environnement for the analyses (Anthony Vella, Vincent Lucaire). The authors would like to kindly thank the dedicated efforts of many other people at the sampling site and in the laboratories for collecting and analyzing the samples.
The PhD of Abdoulaye Samaké is funded by the government of Mali. We gratefully acknowledge the LEFE-CHAT and EC2CO programs of the CNRS for financial supports of the CAREM-BIOS multidisciplinary project, with ADEME funding. Chemical and microbiological analytical aspects were supported at IGE by the Air-O-Sol and MOME platforms, respectively, within Labex OSUG@2020 (ANR10 LABX56).
Review statement. This paper was edited by Alex Huffman and re-viewed by two anonymous referees.
References
Amato, P., Brisebois, E., Draghi, M., Duchaine, C., Fröhlich-Nowoisky, J., Huffman, J. A., Mainelis, G., Robine, E., and Thibaudon, M.: Main biological aerosols, specificities, abun-dance, and diversity, in Microbiology of Aerosols, pp. 1–21, John Wiley & Sons, Ltd., https://doi.org/10.1002/9781119132318, 2017.
Andersen, G. L., Frisch, A. S., Kellogg, C. A., Levetin, E., Lighthart, B., and Paterno, D.: Aeromicrobiology/air quality, in Encyclopedia of Microbiology (Third Edition), pp. 11–26, Aca-demic Press, Oxford., https://doi.org/10.1016/B978-012373944-5.00166-8, 2009.
Arndt, J., Sciare, J., Mallet, M., Roberts, G. C., Marchand, N., Sartelet, K., Sellegri, K., Dulac, F., Healy, R. M., and Wenger, J. C.: Sources and mixing state of summertime back-ground aerosol in the north-western Mediterranean basin, At-mos. Chem. Phys., 17, 6975–7001, https://doi.org/10.5194/acp-17-6975-2017, 2017.
Aydogan, E. L., Moser, G., Müller, C., Kämpfer, P., and Glaeser, S. P.: Long-term warming shifts the composition of bacterial communities in the phyllosphere of galium album in a per-manent grassland field-experiment, Front. Microbiol., 9, 144, https://doi.org/10.3389/fmicb.2018.00144, 2018.
Barbaro, E., Kirchgeorg, T., Zangrando, R., Vecchiato, M., Piazza, R., Barbante, C., and Gambaro, A.: Sug-ars in Antarctic aerosol, Atmos. Environ., 118, 135–144, https://doi.org/10.1016/j.atmosenv.2015.07.047, 2015.
Bauer, H., Claeys, M., Vermeylen, R., Schueller, E., Weinke, G., Berger, A., and Puxbaum, H.: Arabitol and mannitol as tracers for the quantification of airborne fungal spores, Atmos. Environ., 42, 588–593, https://doi.org/10.1016/j.atmosenv.2007.10.013, 2008. Boucher, O., Randall, D., Artaxo, P., Bretherton, C., Feingold, G., Forster, P., Kerminen, V.-M., Kondo, Y., Liao, H., and Lohmann, U.: Clouds and aerosols, in: Climate change 2013: the physical science basis, Contribution of Working Group I to the Fifth Assessment Report of the Intergovernmental Panel on Climate Change, 571–657, Cambridge University Press, https://doi.org/10.1017/CBO9781107415324.016, 2013.
Bougouffa, S., Radovanovic, A., Essack, M., and Bajic, V. B.: DEOP: a database on osmoprotectants and associated pathways, Database, 2014, https://doi.org/10.1093/database/bau100, 2014. Bowers, R. M., Sullivan, A. P., Costello, E. K., Collett, J. L., Knight,
R., and Fiereri, N.: Sources of bacteria in outdoor air across cities in the Midwestern United States, Appl. Environ. Microbiol., 77, 6350–6356, https://doi.org/10.1128/AEM.05498-11, 2011. Boyer, F., Mercier, C., Bonin, A., Le Bras, Y., Taberlet, P., and
Coissac, E.: OBITOOLS: a UNIX-inspired software package for DNA metabarcoding, Mol. Ecol. Resour., 16, 176–182, https://doi.org/10.1111/1755-0998.12428, 2016.
Bozzetti, C., Daellenbach, K. R., Hueglin, C., Fermo, P., Sciare, J., Kasper-Giebl, A., Mazar, Y., Abbaszade, G., El Kazzi, M., Gonzalez, R., Shuster-Meiseles, T., Flasch, M., Wolf, R., Kˇre-pelová, A., Canonaco, F., Schnelle-Kreis, J., Slowik, J. G., Zim-mermann, R., Rudich, Y., Baltensperger, U., El Haddad, I., and Prévôt, A. S. H.: Size-resolved identification, characteriza-tion, and quantification of primary biological organic aerosol at a European rural site, Environ. Sci. Technol., 50, 3425–3434, https://doi.org/10.1021/acs.est.5b05960, 2016.
Cáliz, J., Triadó-Margarit, X., Camarero, L., and Casamayor, E. O.: A long-term survey unveils strong seasonal patterns in the airborne microbiome coupled to general and regional atmospheric circulations, P. Natl. Acad. Sci., 115, 12229, https://doi.org/10.1073/pnas.1812826115, 2018.
Cao, C., Jiang, W., Wang, B., Fang, J., Lang, J., Tian, G., Jiang, J., and Zhu, T. F.: Inhalable microorganisms in Beijing’s PM2.5and
PM10pollutants during a severe smog event, Environ. Sci. Tech-nol., 48, 1499–1507, https://doi.org/10.1021/es4048472, 2014. Cavalli, F., Viana, M., Yttri, K. E., Genberg, J., and Putaud, J.-P.:
Toward a standardised thermal-optical protocol for measuring at-mospheric organic and elemental carbon: the EUSAAR protocol, Atmos. Meas. Tech., 3, 79–89, https://doi.org/10.5194/amt-3-79-2010, 2010.
China, S., Burrows, S. M., Wang, B., Harder, T. H., Weis, J., Tanarhte, M., Rizzo, L. V., Brito, J., Cirino, G. G., Ma, P.-L., Cliff, J., Artaxo, P., Gilles, M. K., and Laskin, A.: Fungal spores as a source of sodium salt particles in the Amazon basin, Nat. Commun., 9, 4793, https://doi.org/10.1038/s41467-018-07066-4, 2018.
Ciarelli, G., Aksoyoglu, S., Crippa, M., Jimenez, J.-L., Nemitz, E., Sellegri, K., Äijälä, M., Carbone, S., Mohr, C., O’Dowd, C., Poulain, L., Baltensperger, U., and Prévôt, A. S. H.: Evaluation of European air quality modelled by CAMx including the volatil-ity basis set scheme, Atmos. Chem. Phys., 16, 10313–10332, https://doi.org/10.5194/acp-16-10313-2016, 2016.
Coz, E., Artíñano, B., Clark, L. M., Hernandez, M., Robinson, A. L., Casuccio, G. S., Lersch, T. L., and Pandis, S. N.: Characteri-zation of fine primary biogenic organic aerosol in an urban area in the northeastern United States, Atmos. Environ., 44, 3952– 3962, https://doi.org/10.1016/j.atmosenv.2010.07.007, 2010. Dommergue, A., Amato, P., Tignat-Perrier, R., Magand, O.,
Thol-lot, A., Joly, M., Bouvier, L., Sellegri, K., Vogel, T., Sonke, J. E., Jaffrezo, J.-L., Andrade, M., Moreno, I., Labuschagne, C., Martin, L., Zhang, Q., and Larose, C.: Methods to investigate the global atmospheric microbiome, Front. Microbiol., 10, 243, https://doi.org/10.3389/fmicb.2019.00243, 2019.
Elbert, W., Taylor, P. E., Andreae, M. O., and Pöschl, U.: Contribu-tion of fungi to primary biogenic aerosols in the atmosphere: wet