Activity and stability trends of perovskite oxides
for oxygen evolution catalysis at neutral pH
The MIT Faculty has made this article openly available.
Please share
how this access benefits you. Your story matters.
Citation
Han, Binghong, Marcel Risch, Yueh-Lin Lee, Chen Ling, Hongfei Jia,
and Yang Shao-Horn. “Activity and Stability Trends of Perovskite
Oxides for Oxygen Evolution Catalysis at Neutral pH.” Phys. Chem.
Chem. Phys. 17, no. 35 (2015): 22576–22580.
As Published
http://dx.doi.org/10.1039/c5cp04248h
Publisher
Royal Society of Chemistry, The
Version
Author's final manuscript
Citable link
http://hdl.handle.net/1721.1/109591
Terms of Use
Creative Commons Attribution-Noncommercial-Share Alike
Journal Name
COMMUNICATION
This journal is © The Royal Society of Chemistry 20xx J. Name., 2013, 00, 1-3 | 1
Please do not adjust margins
Please do not adjust margins
Received 00th January 20xx, Accepted 00th January 20xx DOI: 10.1039/x0xx00000x www.rsc.org/Activity and Stability Trends of Perovskite Oxides for Oxygen
Evolution Catalysis at Neutral pH
Binghong Han,a,c‡ Marcel Risch,b,c‡ Yueh-Lin Lee,b,c Chen Ling,d Hongfei Jia,d Yang Shao-Horn a,b,c*
Perovskite oxides (ABO3) have been studied extensively to promote the
kinetics of oxygen evolution reaction (OER) in alkaline electrolytes. However, developing highly active catalysts for OER at near-neutral pH is desirable for many photoelectrochemical/electrochemical devices. In this paper, we systematically studied the activity and stability of well-known perovskite oxides for OER at pH 7. Previous activity descriptors established for perovskite oxides at pH 13, such as having an eg occupancy close to
unity or having an O p-band center close to Fermi level, were shown to scale with OER activity at pH 7. Stability was a greater challenge at pH 7 than at pH 13, where two different modes of instability were identified from combined transmission electron microscopy and density functional theory analyses. Perovskites with O p-band close to Fermi level showed leaching of A-site atoms and surface amorphization under all overpotentials examined at pH 7, while those with O p-band far from Fermi level were stable under low OER current/potential but became unstable at high current/potential accompanied by leaching of B-site atoms. Therefore, efforts are needed to enhance the activity and stability of perovskites against A-site or B-site loss if used at neutral pH. Developing highly active electrocatalysts with fast kinetics for the oxygen evolution reaction (OER) near room temperature is critical to improve the efficiency of many electrochemical technologies in pursuit of sustainable energy, such as water splitting using light or electricity,1-3 and rechargeable metal-air batteries.4, 5 Recently,
many perovskite transition-metal oxides (ABO3) have been
developed with comparable activities to precious-metal-based catalysts in high-pH alkaline solution with lower cost.6-12 In addition,
by changing A- and B-site cations, perovskite oxides could also serve as a model system to find the activity and stability descriptors for developing new catalysts. In alkaline electrolyte, the perovskites with an eg occupancy close to unity9 or an O p-band center close to
Fermi level8 exhibited the highest specific OER activity. However, as we previously reported, perovskites with an O p-band too close to the Fermi level (> -1.75 eV relative to the Fermi level) such as Ba0.5Sr0.5Co0.8Fe0.2O3-δ (BSCF) showed surface amorphization during
OER at pH 13 with the surface converting to a layered (hydr)oxide due to A-site loss (i.e. Ba and Sr),8, 13, 14 while PrBaCo2O5+δ (PBCO) is
just inside the stable region.8 At the same time, a systematic investigation of stability and activity of perovskite oxides at neutral pH is still missing; the insights are important for the knowledge-guided design of non-precious-metal oxides catalysts for many electrochemical devices that benefit from neutral or slightly acidic operation conditions, including cocatalysts for photoanodes,3, 15, 16 water-oxidation-coupled CO2 reduction17 and rechargeable Zn-air
batteries18 to avoid carbonate formation. In this paper, we report the O p-band dependency of activity and stability of perovskite electrocatalysts for OER at pH 7. We identify two origins of corrosion and their effect on longevity and activity of the electrocatalysts, which separates perovskites at pH 7 into two classes, requiring separate strategies for optimization.
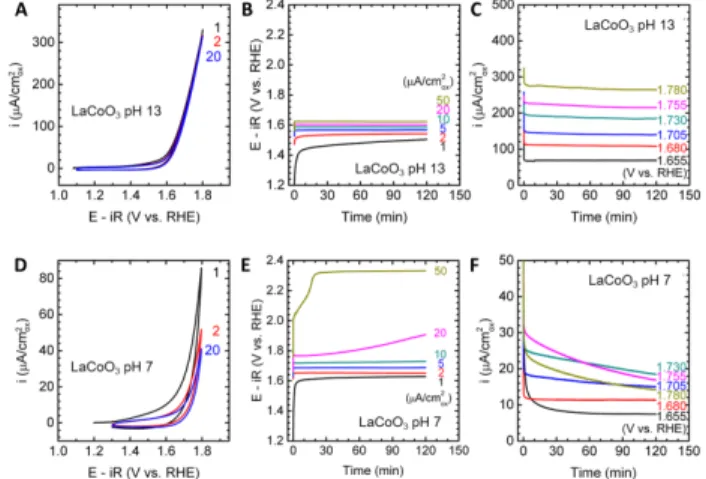
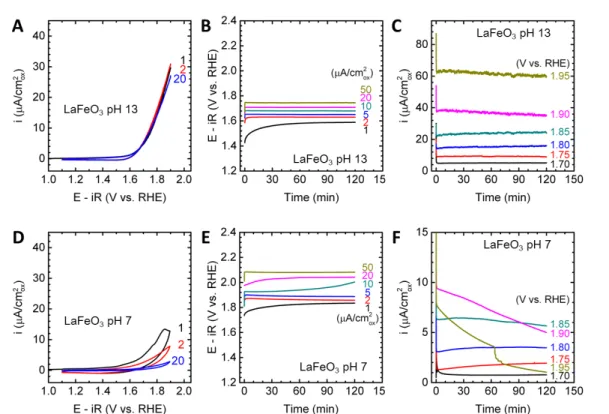
Figure 1. Electrochemical measurements of the LaCoO3 OER
activity. (A)(D) Cyclic voltammetry. Numbers indicate cycles. (B)(E) Galvanostatic experiments at various current densities. (C)(F) Potentiostatic experiments at various voltages. (A)-(C) was measured in pH 13 electrolyte prepared with 0.1 M KOH, while (D)-(E) was measured in pH 7 electrolyte prepared with 0.4 M NaH2PO4,
COMMUNICATION Journal Name 2 | J. Name., 2012, 00, 1-3 This journal is © The Royal Society of Chemistry 20xx
Please do not adjust margins
Please do not adjust margins
We used micron-sized LaCoO3 as a starting point to explore thestability window of the perovskites in pH 7 electrolyte prepared with 0.4 M NaH2PO4, 0.6 M Na2SO4 and proper amount of NaOH.
LaCoO3 has long been known as a stable and active electrocatalyst
in alkaline media,9, 10, 19 which we also verify here by cyclic voltammetry (CV; Figure 1A) from 1.1 to 1.8 V vs. reversible hydrogen electrode (RHE), galvanostatic measurements up to 50 μA/cm2ox (Figure 1B), and potentiostatic measurements up to 1.78
V vs. RHE (Figure 1C). A clear OER current reduction (i.e. overpotential increase at fixed current or vice versa) was noted from pH 13 (Figures 1A-C) to pH 7 (Figures 1D-F). Moreover, in contrast to stable CV in 0.1 M KOH at pH 13, LaCoO3 showed a
considerable OER current decrease with CV cycling at pH 7 (Figure 1D), which is in good agreement with activity loss above 10 μA/cm2ox (Figure 1E) or above 1.7 V vs. RHE (Figure 1F). A similar
instability under high OER current/potential at pH 7 can also be found in LaNiO3, LaMnO3 and LaFeO3 (Figure S1-S3). The origin of
this instability will be discussed in detail below.
Figure 2. (A) Tafel plots of LaNiO3, LaCoO3, BSCF and PBCO at pH 7
and 13, obtained from galvanostatic measurements. (B) The p-band center trend at pH 7 of selected oxides at 5 μA/cm2ox. (C) The
p-band center trend at pH 13 at 5 μA/cm2ox. The horizontal lines in (B)
and (C) represent the activity of IrO2 at 5 μA/cm2ox. Here O p-band
positions were calculated using DTF. All activities were obtained from galvanostatic measurements after 2 hours. The error bars in above figures represent the standard deviation of multiple measurements. Raw activity curves can be found in Figures S5 and S6 in the SI. All the perovskites examined in this study showed reduced OER activities at pH 7 relative to pH 13 (Figure 2), with comparable Tafel slopes at low overpotentials (~100 mV/dec) to those found at pH 13 (~70 mV/dec)8 but much greater slopes (~300 mV/dec) at high
current/potential (Figure 2A). The increased Tafel slope at high current/potential might be related to the loss of A-site or B-site atoms, and these degradation processes will be discussed in detail in a later section. The reduced OER activity at pH 7 might be caused by poisoning of active sites by phosphate. It is interesting to note that commercial IrO2 had a higher OER activity than all of the
perovskites at pH 7 but not at pH 13, maybe due to its high resistance to surface poisoning and extreme chemical stability across a wide pH range.20-23
Here we also examine if OER activity descriptors established for perovskites at pH 138, 9 can scale with the activities found at pH 7 (Figure 2A). As none of these perovskites exhibited constant potential responses above 20 μA/cm2ox at pH 7 (e.g. Figure 1E), a
specific current of 5 μA/cm2ox was used to compare the OER activity
at pH 7 (Figure 2B) and pH 13 (Figure 2C) as compared to 50 or 500 μA/cm2ox at pH 13 in our previous works.8, 9 Both OER activities at
pH 7 and pH 13 were found to increase with moving the DFT-computed O p-band center closer to the Fermi level. Moreover, the eg occupancy (taken from our previous study9) can serve as an
activity descriptor at pH 7 (Figure S4A). These observations suggest that OER activity descriptors previously established for perovskites at pH 13 such as eg occupancy close to unity9 and O p-band center
closer to Fermi level8 can be extended for the OER activity of perovskites at pH 7.
Perovskites with the O p-band far from Fermi level such as LaCoO3 and LaNiO3 were more stable than those closer to the Fermi
level such as SrCoO3 and BSCF. The stability of these perovskites
before and after OER at pH 7 was analyzed using transmission electron microscopy (TEM) and energy dispersive spectroscopy (EDS). TEM and EDS data of LaCoO3 and PBCO are shown in Figures
3 and 4, respectively. It is worth noting several different trends of the stability between pH 7 and pH 13. Firstly, the amorphization of perovskites (shaded region in Figure 2) after OER shifted to a lower O p-band threshold at pH 7. For example, PBCO remained stable after OER at pH 13 while it became amorphous after OER at pH 7 (Figure 4). Secondly, the perovskites in the stable region (unshaded region in Figures 2B and 2C), like LaCoO3, could be stable at 50
μA/cm2ox at pH 138 while a ten-fold reduction in the current density
was necessary at pH 7 to avoid surface amorphization within operation of 2 hours. When exposed to higher current such as 50 μA/cm2ox at pH 7, surface amorphization was clearly visible in
LaCoO3 (Figure 3A), accompanied by the leaching of B-site elements
(which is Co in LaCoO3 shown in Figure 3B). This was also observed
in other perovskites with O p-band away from the Fermi level including LaNiO3 (Figure S7), LaMnO3 (Figure S8) and LaFeO3 (Figure
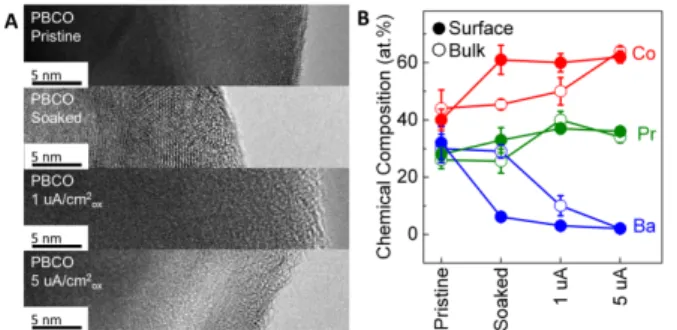
S9). Thirdly, the perovskites with the O p-band closer to the Fermi level like PBCO became surface amorphized (Figure 4A), which was associated with loss of A-site elements, i.e. Pr, Ba, La…, (Figure 4B) at current densities as low as 1 μA/cm2ox. Similar surface changes
were also observed after soaking at pH 7 for 2 h without applying any current/potential for PBCO (Figure 4B), BSCF (Figure S10) and
SrCoO3 (Figure S11). In fact, calculated Pourbaix diagrams of
perovskites from conditions giving rise to both stable and amorphization perovksites in Figure 2 predict the thermodynamic instability of A-site ions at pH 7 in the OER region (Figures S12-S14), indicative thermodynamic driving force for leaching of A-site ions at lower pH. However, A-site leaching was only observed for oxides
Journal Name COMMUNICATION
This journal is © The Royal Society of Chemistry 20xx J. Name., 2013, 00, 1-3 | 3
Please do not adjust margins
Please do not adjust margins
undergoing amorphization. This suggests that the kinetics of A-site leaching and hence amorphization were sluggish for those oxides with O p-bands far from the Fermi level. In previous study at pH 13, the loss of A-site cations led to increased access of the electrolyte to active transition metal sites and thus to an enhancement of the electrochemically active surface area.13, 14 In contrast, the oxides with p-band center far from the Fermi level tended to leach more B-site cations such as Co and Ni than A-with p-band center far from the Fermi level tended to leach more B-site La under high current/potential at pH 7, which are proposed as active sites for the OER.8, 9 However in this study, due to the potential poisoning effect that has great suppression influence on OER activity at pH 7, it is hard to isolate the consequence of A-site and B-site leaching to the OER activity. It is also worth noting that the stability trends observed in this work are based on rotation-disk electrochemical stability test, which might be different from other stability tests such as scanning flow cell/ inductively coupled plasma mass spectrometry (SFC/ICP-MS)24 and real-device tests.
Figure 3. (A) TEM images and (B) EDS-determined chemical compositions of LaCoO3 in pristine state and operated at 0
(soaking), 5 and 50 μA/cm2ox for 2 h at pH 7. The error bars in (B)
represent the standard deviation of multiple spots.
Figure 4. (A) TEM images and (B) EDS-determined chemical compositions of PBCO in pristine state and operated at 0 (soaking), 1 and 5 μA/cm2ox for 2 h at pH 7. The error bars in (B) represent the
standard deviation of multiple spots.
For oxides with O p-bands far from the Fermi level, such as LaCoO3, the consistent lower OER activity at neutral pH vs. pH=13
and the greater surface adsorption energies of the OER intermediates vs. the oxides with higher O p-band21 result in a need of much higher over-potential condition at neutral pH to reach the high OER current. Consequently, the high potential/current condition enhances the thermodynamic driving force of the oxidation of B-site ions that is associated with amorphization and thus phase separation (such as a CoOz phase, see SI for more
details), rather than the leaching of La3+, suggesting an oxidation-related degradation process. To test this hypothesis, we performed
density functional theory (DFT) calculations on LaCoO3 to estimate
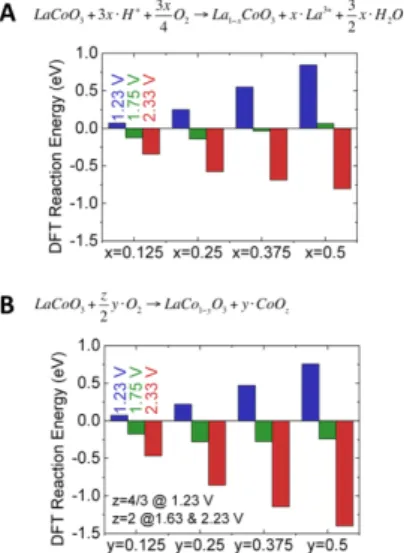
the thermodynamic driving force of La (A-site) leaching into the electrolyte (negative energies in Figure 5A):
LaCoO!+ 3𝑥 ∙ 𝐻!+!!!O!→ La!!!CoO!+ 𝑥 ∙ 𝐿𝑎!"!!+!!!H!𝑂
Eq. 1 and of Co (B-site) phase separation (negative energies in Figure 5B)
LaCoO!+!"!O!→ LaCo!!!O!+ 𝑦 ∙ Co𝑂! Eq. 2
The electrochemical expressions of the above reactions and other DFT details can be found in SI. We selected the potentials of 1.23, 1.75 and 2.33 V vs. RHE to illustrate trends in a range slightly larger than the potentials used in the experimental measurements (Figure 2B). The formation of a Co(IV) phase is justified by the large overpotentials relative to the Co(III)/Co(IV) redox couple at ~ 1.6 V vs. RHE in cobalt (hydr)oxides.25, 26 Based on the computational standard hydrogen electrode method20, 21, 27 and the assessed stability of the solvated La3+, in Figure 5 we showed that both A-site and B-site leaching reactions were energetically favorable to occur at high potential of 2.33 V vs. RHE with reaction energy exhibiting a monotonically downhill trend when the cation vacancy (x or y) increased (-0.8 and -1.4 eV for the reactions in Eq. 1 and 2 at x or y = 0.5, respectively). This result supports the B-site leaching and surface amorphization of LaCoO3 observed by TEM after high
current/potential treatment (Figure 3). On the other hand, the thermodynamic driving force for surface changes is very low at this potential considering that the reaction energies of Eq. 1 and 2 were within 0 to -0.3 eV at 1.75 V vs. RHE and an inherent error of the adopted DFT methods was assumed to be ±0.2 eV per formula unit.28. Moreover, for both A-site and B-site cations, the existence of convex hulls (minimum leaching energy around x or y = 0.25) at 1.75 V vs. RHE in Figure 5 indicate the thermodynamic driving forces of cation leaching can be balanced by the repulsion interaction between cation defects at the concentrations around 0.25 (Figure 5). These DFT results are consistent with TEM observations (Figure 3A), where at low current/potential the surface amorphization and B-site loss predicted by Pourbaix diagram were not observed. On the other hand, at the investigated maximal cation vacancy concentration of 0.5, the reaction free energy of Co leaching is -0.6 eV more stable than that of La leaching, suggesting the higher thermodynamic tendency of the Co leaching vs. La leaching near the surface of LaCoO3 under high potential of 2.33 V, which is in
agreement with surface composition of LaCoO3 from EDS (Figure
3B). Here the enlarged driving force for Co leaching could be from the oxidation of Co into more soluble species at higher potential. Furthermore, previous DFT study29 shown that the missing of less than half B-site atoms on the BO2 terminations (the stable
termination by calculation) can stabilize the layers underneath rather than accelerate the leaching. Therefore the cation point defects at 1.23 and 1.75 V (less than 0.375, see Figure 5) will not cause cation leaching and surface amorphization, in consistent with experimental observations at low potentials. However, at higher potentials, it is noted that the cation vacancy concentration could surpass 0.5 and is likely to lead to point defect-stimulated amorphization.30 Finally, it is conceivable that the catalytic mechanism at pH 7 involves divalent metal cations (e.g. Co2+) that can leach into solution where they might be complexed by
COMMUNICATION Journal Name
4 | J. Name., 2012, 00, 1-3 This journal is © The Royal Society of Chemistry 20xx
Please do not adjust margins
Please do not adjust margins
phosphate to form insoluble salts such as Co2(PO4)3. Therefore, it
will be critical for the development of more stable electrocatalysts to stabilize the electroactive B-site of oxides with an O p-band away from the Fermi level (e.g. LaCoO3) against degradation of the active
site, especially at higher current densities.
Figure 5. The computed DFT leaching reaction energies of (a) La leaching and (b) Co leaching in LaCoO3 at various La vacancy
concentration (x) and Co vacancy concentration (y), at applied potential of 1.23 V (blue), 1.75 V (red), and 2.33 V (green) vs. RHE at pH 7.
In summary, we systematically studied the activity and stability of perovskite catalysts for OER at pH 7. We found that both an eg
occupancy close to unity or an O p-band close to Fermi level satisfactorily trended with activity at pH 7. New insight was gained into the causes of electrocatalyst instability with the discovery of two different dissolution mechanisms at pH 7. Perovskites with O p-band close to Fermi level showed leaching of A-site cations and surface amorphization at any condition in pH 7 electrolyte, while the perovskites with O p-band far from Fermi level were stable under low current/potential but suffered from phase separation of B-site cations at high current/potential. The joint experimental and DFT modeling results suggest cation leaching due to formation of point defects along with stable corrosion products under applied potentials. Cation leaching plays a more important role for instability at pH 7 as compared to pH 13 because of the much higher OER overpotential under the same current at neutral pH. It is necessary to clearly identify the key material challenges faced in the design of efficient and stable non-precious-metal oxides catalysts for electrochemical devices at neutral pH, such as the A-site vs. B-site instability in different perovskites; optimized design strategies need to be devised to address both challenges separately.
Acknowledgements
The research made use of the Shared Experimental Facilities supported by the MRSEC Program of the National Science Foundation under award number DMR 08-019762. The author wants to thank Mr. Ryan Jacobs from University of Wisconsin-Madison for the Pourbaix diagram of Ba-Sr-Co-Fe-Co-O system.
Notes and references
1.
H. B. Gray, Nat. Chem., 2009, 1, 112-112.
2. N. S. Lewis and D. G. Nocera, Proc. Natl. Acad. Sci., 2006, 103, 15729-15735.
3. M. W. Kanan and D. G. Nocera, Science, 2008, 321, 1072-1075.
4. Y.-C. Lu, Z. Xu, H. A. Gasteiger, S. Chen, K. Hamad-Schifferli and Y. Shao-Horn, J. Am. Chem. Soc., 2010, 132, 12170-12171. 5. M. Armand and J. M. Tarascon, Nature, 2008, 451, 652-657. 6. M. Risch, K. A. Stoerzinger, S. Maruyama, W. T. Hong, I. Takeuchi and Y. Shao-Horn, J. Am. Chem. Soc., 2014, 136, 5229-5232. 7. K. A. Stoerzinger, M. Risch, J. Suntivich, W. M. Lu, J. Zhou, M. D. Biegalski, H. M. Christen, Ariando, T. Venkatesan and Y. Shao-Horn, Energy Environ. Sci., 2013, 6, 1582-1588. 8. A. Grimaud, K. J. May, C. E. Carlton, Y.-L. Lee, M. Risch, W. T. Hong, J. Zhou and Y. Shao-Horn, Nat. Commun., 2013, 4, 2439 2431-2437. 9. J. Suntivich, K. J. May, H. A. Gasteiger, J. B. Goodenough and Y. Shao-Horn, Science, 2011, 334, 1383-1385. 10. D. B. Meadowcroft, Nature, 1970, 226, 847-848. 11. J. Suntivich, H. A. Gasteiger, N. Yabuuchi and Y. Shao-Horn, J. Electrochem. Soc., 2010, 157, B1263-B1268.
12. R. A. Rincón, E. Ventosa, F. Tietz, J. Masa, S. Seisel, V. Kuznetsov and W. Schuhmann, Chem. Phys. Chem., 2014, 15, 2810-2816.
13. K. J. May, C. E. Carlton, K. A. Stoerzinger, M. Risch, J. Suntivich, Y.-L. Lee, A. Grimaud and Y. Shao-Horn, J. Phys. Chem.
Lett, 2012, 3, 3264-3270.
14. M. Risch, A. Grimaud, K. J. May, K. A. Stoerzinger, T. J. Chen, A. N. Mansour and Y. Shao-Horn, J. Phys. Chem. C, 2013, 117, 8628-8635.
15. D. G. Nocera, Accounts of Chemical Research, 2012, 45, 767-776.
16. A. Kudo and Y. Miseki, Chemical Society Reviews, 2009, 38, 253-278. 17. K. P. Kuhl, T. Hatsukade, E. R. Cave, D. N. Abram, J. Kibsgaard and T. F. Jaramillo, J. Am. Chem. Soc., 2014, 136, 14107-14113. 18. P. Pei, K. Wang and Z. Ma, Appl. Energy, 2014, 128, 315-324. 19. J. O. M. Bockris and T. Otagawa, J. Electrochem. Soc., 1984, 131, 290-302. 20. J. Rossmeisl, Z. W. Qu, H. Zhu, G. J. Kroes and J. K. Nørskov, J. Electroanal. Chem., 2007, 607, 83-89.
21. I. C. Man, H.-Y. Su, F. Calle-Vallejo, H. A. Hansen, J. I. Martínez, N. G. Inoglu, J. Kitchin, T. F. Jaramillo, J. K. Nørskov and J. Rossmeisl, Chem. Catal. Chem., 2011, 3, 1159-1165.
22. K. E. Ayers, L. T. Dalton and E. B. Anderson, ECS Trans., 2012, 41, 27-38.
23. C. C. L. McCrory, S. Jung, J. C. Peters and T. F. Jaramillo, J.
Am. Chem. Soc., 2013, 135, 16977-16987.
24. S. Cherevko, A. R. Zeradjanin, A. A. Topalov, N. Kulyk, I. Katsounaros and K. J. J. Mayrhofer, Chem. Catal. Chem., 2014, 6, 2219-2223.
25. J. B. Gerken, J. G. McAlpin, J. Y. C. Chen, M. L. Rigsby, W. H. Casey, R. D. Britt and S. S. Stahl, J. Am. Chem. Soc., 2011, 133, 14431-14442.
26. M. Risch, F. Ringleb, M. Kohlhoff, P. Bogdanoff, P. Chernev, I. Zaharieva and H. Dau, Energy Environ. Sci., 2015, 8, 661-674. 27. J. K. Nørskov, J. Rossmeisl, A. Logadottir, L. Lindqvist, J. R. Kitchin, T. Bligaard and H. Jónsson, J. Phys. Chem. B, 2004, 108, 17886-17892.
28. Y.-L. Lee, J. Kleis, J. Rossmeisl and D. Morgan, Phys. Rev. B, 2009, 80, 224101.
29. X. Rong and A. M. Kolpak, J. Phys. Chem. Lett, 2015, 6, 1785-1789.
30. Y. Zhang, J. Lian, C. M. Wang, W. Jiang, R. C. Ewing and W. J.
Journal Name
COMMUNICATION
This journal is © The Royal Society of Chemistry 20xx J. Name., 2013, 00, 1-3 | 5
Please do not adjust margins
Please do not adjust margins
TOC Graphic/Abstract Art:1
Supplementary Information
Activity and Stability Trends of Perovskite Oxides at Neutral pH for
Oxygen Evolution Catalysis
Binghong Han,
a,c‡Marcel Risch,
b,c‡Yueh-Lin Lee,
b,cChen Ling,
dHongfei Jia,
dYang
Shao-Horn
a,b,c*a
Department of Materials Science and Engineering,
bResearch Laboratory of
Electronics, and
cElectrochemical Energy Lab, Massachusetts Institute of Technology,
Cambridge, Massachusetts 02139, United States
d
Toyota Research Institute of North America, Ann Arbor, Michigan 48105, United
States
Corresponding Author
* Yang Shao-Horn, shaohorn@mit.edu
Index
Page
Detailed Experimental Section
Materials Preparation ... 2
Electrochemical Measurements ... 2
Transmission Electron Microscopy ... 2
Density Function Theory studies. ... 3
Supporting Figures
Figure S1 ... 5
Figure S2 ... 5
Figure S3 ... 7
Figure S4 ... 8
Figure S5 ... 9
Figure S6 ... 10
Figure S7 ... 11
Figure S8 ... 11
Figure S9 ... 12
Figure S10 ... 12
Figure S11 ... 13
Figure S12 ... 14
Figure S13 ... 14
Figure S14 ... 15
UnknownField Code Changed
Unknown
Field Code Changed
Unknown
Field Code Changed
Unknown
Field Code Changed
Unknown
Field Code Changed
Unknown
Field Code Changed
Unknown
Field Code Changed
Unknown
Field Code Changed
Unknown
Field Code Changed
Unknown
Field Code Changed
Unknown
Field Code Changed
Unknown
Field Code Changed
Unknown
Field Code Changed
Unknown
Field Code Changed
Unknown
Field Code Changed
Unknown
Field Code Changed
Unknown
2
Detailed Experimental Section
Materials Preparation. Perovskite catalysts were synthesized using a conventional
solid-state route.
1IrO
2(99.99%) were bought from Alfa Aesar Premion as the
precious-metal oxides reference. The specific surface area of each oxide sample was
determined using BET analysis on a Quantachrome ChemBET Pulsar from a
single-point BET analysis performed after 12 h outgassing at 150 C.
Electrochemical Measurements. The rotating disk electrode (RDE) configuration
was employed for electrochemical measurements, which has a rotatable working
electrode at the rotation speed of 1600 rpm in a three-electrode cell with a Pt wire and
a saturated calomel electrode (Pine Instrument Co.) as the counter and reference
electrodes, respectively. All potentials were calibrated to the reversible hydrogen
electrode (RHE) using H
2/H
+redox. Working electrodes were prepared by
drop-casting oxide ink on a glassy carbon electrode, as described previously
1, with an
oxide loading of 0.25 mg
oxide/cm
2diskand a mass ratio of 5:1:1 of oxide catalyst to
acetylene black carbon to Nafion®. The pH 13 electrolyte was prepared with 0.1 M
KOH (Sigma-Aldrich, 99.99%) and deionized water (18 MΩ). pH 7 electrolyte was
prepared with 0.4 M NaH
2PO
4(Sigma-Aldrich), 0.6 M Na
2SO
4(Sigma-Aldrich),
proper amount of NaOH (Mallinckrodt) and deionized water (18 MΩ). The potential
was controlled using a Biologic SP-300 potentiostat. A scan rate of 10 mV/s and a
scan range between 1.1 and 1.8 V vs. RHE were used for all CV measurements. All
CV, galvanostatic and potentiostatic OER measurements were done in
O
2(99.999%,
Airgas) saturated
and bubbled electrolyte. Error bars in all activity data represent the
standard deviation of multiple independent measurements. Ohmic losses were
corrected by subtracting the ohmic voltage drop from the measured potential, using an
electrolyte resistance determined by high-frequency alternating current impedance,
where iR-corrected potentials are denoted as E-iR (i as the current and R as the
electrolyte resistance). The resistance of the RDE system with pH 7 electrolyte (~15
Ω) is smaller than that with pH 13 electrolyte (~40 Ω), and therefore the Ohmic drop
within the narrow pores
2might not be a reason for the activity reduction observed at
pH 7.
Transmission Electron Microscopy. TEM samples were prepared by dropping the
catalyst ink onto Cu grids or using grids to scratch the working electrode after OER
measurements. TEM images in this work were taken on JEOL 2010F equipped with
ultrahigh resolution polepiece, having a point resolution of 0.19 nm. Bright field
diffraction contrast imaging was used to determine particle size distributions and
general morphology of the catalyst nanoparticles. The digital images were analyzed
using Gatan Digital Micrograph v2.01 (Gatan Inc.) and ImageJ v1.44p (National
Institute of Health, USA). High resolution TEM (HRTEM) images were formed
without an objective aperture and were analyzed using Gatan Digital Micrograph.
Parallel-beam
energy dispersive spectroscopy
(EDS) data were collected and the
3
atomic compositions were determined using INCA (Oxford Instruments) software.
For each oxides sample, three different spots with a diameter of ~ 200 nm were used
to collect the bulk chemical composition, while three different spots with a diameter
of ~ 5 nm at the particle edges were used to collect the surface chemical composition.
Error bars in all EDS data represent the standard deviation of the results on multiple
spots.
Density Function Theory studies. Spin polarized DFT calculations of the oxygen
p-band center were performed with the Vienna Ab-initio Simulation Package
(VASP)
3using a plane wave basis set, the GGA-Perdew-Wang-91
4exchange
correlation function, and the Projector Augmented Wave (PAW) method.
5We used
PAW potentials with electronic configurations La (5s2 5p6 6s2 5d1), Sr (5s2 4p6), O
s(soft oxygen pseudopotential, 2s2 2p4), B = Mn
pv(3p6 3d6 4s1), Fe
pv(3p6 3d7 4s1),
Co (3d8 4s1), and Ni
pv(3p6 3d9 4s1). All calculations were performed with an energy
cut-off of 450 eV. For the GGA+U calculation, we used the standard Dudarev
implementation
6, where the on-site Coulomb interaction for the localized transition
metal d orbitals was parametrized by U
eff= U − J with the Perdew-Wang-91
functional. Optimized U
efffor the transition metal atoms in the investigated perovskite
systems (U
eff= 4.0, 4.0, 3.3, and 6.4 eV for Mn, Fe, Co and Ni, respectively) were
taken from References.
7, 8Full optimization of bulk 2×2×2 perovskite supercell
calculations were performed using the experimental symmetry at low temperature
9based on the ferromagnetic ordering in order to use a consistent and tractable set of
magnetic structures using a (2×2×2) k-point mesh. An effective O p-band center of
each perovskite systems was determined by taking the centroid of the projected
density of states of O 2p states relative to the Fermi level.
The leaching reaction energies of LaCoO
3in Figure 5 of the main text were also
calculated with the same DFT approach described above. The electrochemical
reactions of the dissolution process on working electrode can be written as:
𝐿𝑎𝐶𝑜𝑂
!→ 𝐿𝑎
!!!𝐶𝑜𝑂
!+ 𝑥 ∙ 𝐿𝑎
!"!!+ 3𝑥 ∙ 𝑒
!Eq. S1
and
𝐿𝑎𝐶𝑜𝑂
!+ 𝑦𝑧 ∙ 𝐻
!𝑂 → 𝐿𝑎𝐶𝑜
!!!𝑂
!+ 𝑦 ∙ 𝐶𝑜𝑂
!+ 2𝑦𝑧 ∙ 𝐻
!+ 2𝑦𝑧 ∙ 𝑒
!Eq. S2
for La and Co leaching, respectively. At the same time, there is other half-cell
reaction to balance the chemical reaction in the DFT calculation, which could be
written as:
𝑂
!+ 4𝐻
!+ 4𝑒
!→ 2𝐻
!
𝑂
Eq. S3
It is worth noticing here that the influential factor in A-site and B-site leaching
mechanisms is the competition between Eq. S1 and S2 as well as the OER on the
working electrode, and the compensation half-cell reaction (Eq. S3) has little
influence to the degradation of the perovskite oxides on the working electrodes. Here
Eq. S3 is just used to complete the whole reaction for DFT calculation, altering the
voltage shifts to the oxygen chemical potential change. The real counter electrode
reaction could be other forms of oxygen reduction (such as that in high pH involving
OH
-rather than H
+) or even other redox reactions, but it won’t influence our
conclusion. In the case of Eq. S3, the overall reactions for the DFT calculation can be
4
obtained by combining Eq. S1 and S2 with Eq. S3:
LaCoO
!+ 3𝑥 ∙ 𝐻
!+
!!!
O
!→ La
!!!CoO
!+ 𝑥 ∙ 𝐿𝑎
!" !!+
!!!
H
!𝑂
LaCoO
!+
!"!O
!→ LaCo
!!!O
!+ 𝑦 ∙ Co𝑂
!which are Eq. 1 and Eq. 2 in the main text, respectively.
The simulated LaCoO
3bulk structures with 0.125, 0.25, 0.375, and 0.5 concentration
of A-site or B-site vacancy in the 2×2×2 perovskite supercells are provided in Figure
S14. The corresponding chemical potential of oxygen a given potential relative to the
standard hydrogen electrode (SHE),
, were computed following the
computational SHE method
10, 11and can be defined as:
where
and
are the calculated DFT energy of gas phase
H
2O and H
2,
(
) and
(
) are the zero point energy and
entropy of H
2O (H
2), respectively, T is the room temperature, and
𝜙 is the applied
potential. The stability of solvated La
3+(assumed to be at 10
-6M concentration
12, 13)
was assessed by referencing to the experimental formation enthalpy of La
2O
3(-18.58
eV per formula unit
14) based on the reaction free energy of 1/2La
2O
3+ 3H
+à La
3++3/2H
2O, and the calculated DFT total energy of La
2O
3is used to align with the
experimental La
2O
3formation enthalpy.
The stable degradation product of Co-loss reaction was assumed to be CoO
z(z=4/3,
3/2, and 2, and the most stable compound among the three at the applied potential
condition vs. RHE will be used in the Co-loss reaction) as a sufficient criteria for the
Co-loss reaction. The extreme oxidative condition studied in this paper, especially at
2.33 V vs. RHE, other Co species, such as Co(IV)-oxo and CoO
m(OH)
n, might also be
the direct or second-step product of Co-loss reaction.
15-17, but here we only focus on
the stable CoO
zproduct. We note even if CoO
m(OH)
nor other Co species are more
stable than CoO
z, it will just further increase the actual driving force of the oxide Co
leaching reaction, and has limited influence to the conclusions. Therefore, we hold the
calculation of Co-loss reaction only with CoO
z. Here multiple z values were tried
from 4/3 to 2 to find the most stable Co oxides under different voltage. Our
calculation showed that at 1.23 V vs. RHE, z = 4/3; while at 1.75 and 2.33 V vs. RHE,
z = 2.
Supporting Figures
µ(O)
µ(O) = E
DFT(H
2O
(g)) + ZPE
H2O− TS
H 2O( g ) 0(0.035bar)
"
#
$
%
- E
DFT(H
2 (g)+ ZPE
H2− TS
H 2 ( g ) 0"
#
$
%+ 2 k
(
bT ln a
H+− eφ
)
E
DFTH
2O
(g)(
)
E
DFT(H
2(g))
ZPE
H 2OZPE
H2S
0 H2O( g )S
0 H2( g )5
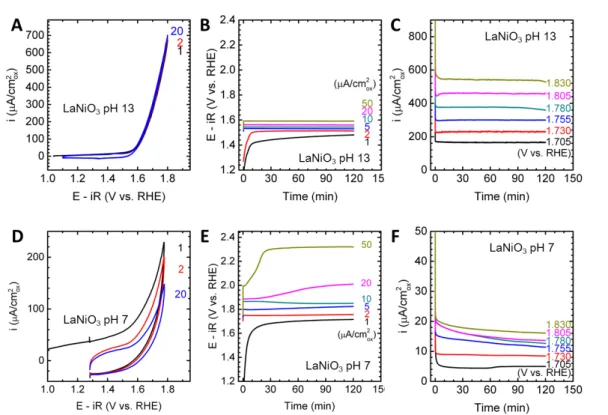
Figure S1. Electrochemical measurements of the LaNiO
3OER activity. (A)(D)
Cyclic voltammetry. Numbers indicate cycles. (B)(E) Galvanostatic experiments at
various current densities. (C)(F) Potentiostatic experiments at various voltages.
(A)-(C) was measured at pH 13, while (D)-(E) was measured at pH 7.
Figure S2. Electrochemical measurements of the LaMnO
3OER activity. (A)(D)
Cyclic voltammetry. Numbers indicate cycles. (B)(E) Galvanostatic experiments at
various current densities. (C)(F) Potentiostatic experiments at various voltages.
6
(A)-(C) was measured at pH 13, while (D)-(E) was measured at pH 7.
7
Figure S3. Electrochemical measurements of the LaFeO
3OER activity. (A)(D)
Cyclic voltammetry. Numbers indicate cycles. (B)(E) Galvanostatic experiments at
various current densities. (C)(F) Potentiostatic experiments at various voltages.
(A)-(C) was measured at pH 13, while (D)-(E) was measured at pH 7.
8
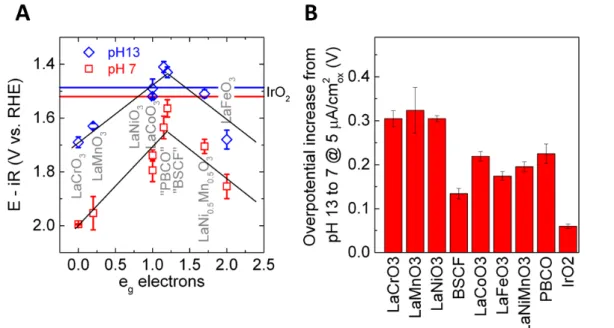
Figure S4. (A) OER activity vs. e
gelectron filling at 5 µA/cm
2oxunder pH 7 and 13.
Two “volcano plots” can be found, with much lower activities at pH 7. Those
materials with quota marks in the names are the catalysts that are not stable at 5
µA/cm
2oxat pH 7. The horizontal lines represent the activity of IrO
2at 5 µA/cm
2ox.
The black lines are only for eye guidance. (B) The OER overpotential increase from
pH 13 to pH 7 at 5 µA/cm
2ox. All error bars represent the standard deviation of
9
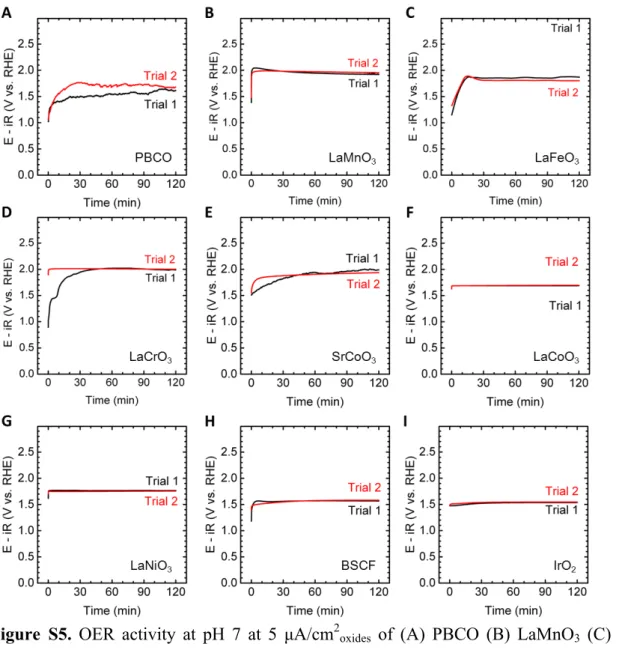
Figure S5. OER activity at pH 7 at 5 µA/cm
2oxidesof (A) PBCO (B) LaMnO
3(C)
10
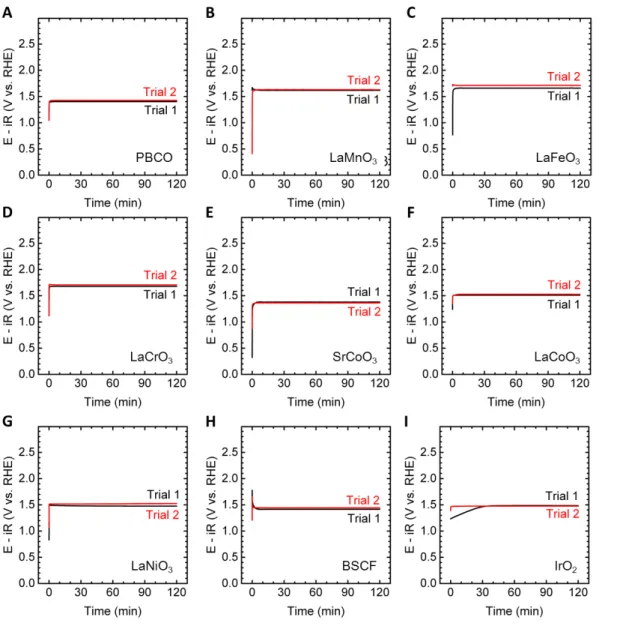
Figure S6. OER activity at pH 13 at 5 µA/cm
2oxidesof (A) PBCO (B) LaMnO
3(C)
11
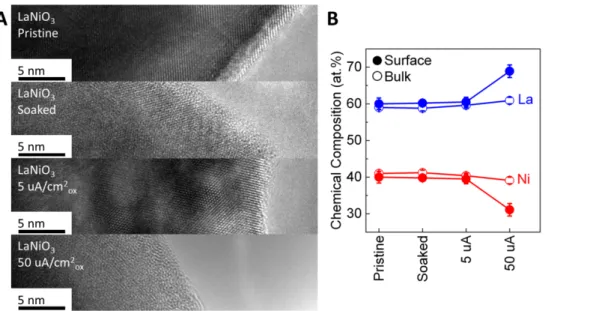
Figure S7. (A) TEM images and (B) EDS-determined chemical compositions of
LaNiO
3in pristine state, operated at 0 (soaking), 5 and 50 µA/cm
2oxfor 2 h at pH 7.
The error bars in (B) represent the standard deviation of multiple spots.
Figure S8. (A) TEM images and (B) EDS-determined chemical compositions of
LaMnO
3in pristine state, operated at 0 (soaking), 5 and 50 µA/cm
2oxfor 2 h at pH 7.
12
Figure S9. (A) TEM images and (B) EDS-determined chemical compositions of
LaFeO
3in pristine state, operated at 0 (soaking), 5 and 50 µA/cm
2oxfor 2 h at pH 7.
The error bars in (B) represent the standard deviation of multiple spots.
Figure S10. (A) TEM images and (B) EDS-determined chemical compositions of
BSCF in pristine state, operated at 0 (soaking), 1, 5 and 50 µA/cm
2oxfor 2 h at pH 7.
13
Figure S11. (A) TEM images and (B) EDS-determined chemical compositions of
SrCoO
3in pristine state, operated at 0 (soaking), 1 and 5 µA/cm
2oxfor 2 h at pH 7.
14
Figure S12. Pourbaix diagram of the Co-La-O(H) system predicted by DFT (data
from materialsproject.org). Dashed lines indicate H
2/H
+and H
2O/O
2. Co and La
cation concentrations were assumed to be 10
-6M in the electrolytes.
Figure S13. Pourbaix diagram of the Pr-Ba-Co-O(H) system predicted by DFT (data
from materialsproject.org). Dashed lines indicate H
2/H
+and H
2O/O
2. Pr, Co and Ba
15
Figure S14. Pourbaix diagram of the Ba-Sr-Co-Fe-Co-O(H) system predicted by DFT
(data from Ryan Jacobs). Dashed lines indicate H
2/H
+and H
2O/O
2. Fe, Sr and Co
16
References
1. A. Grimaud, K. J. May, C. E. Carlton, Y.-L. Lee, M. Risch, W. T. Hong, J. Zhou and Y. Shao-Horn, Nat. Commun., 2013, 4, 2439 2431-2437.
2. L. Bai, L. Gao and B. E. Conway, Journal of the Chemical Society, Faraday Transactions, 1993, 89, 243-249.
3. G. Kresse and J. Furthmuller, Physical Review B, 1996, 54, 11169-11186.
4. J. P. Perdew, K. Burke and M. Ernzerhof, Physical Review Letters, 1996, 77, 3865-3868. 5. G. Kresse and D. Joubert, Physical Review B, 1999, 59, 1758-1775.
6. S. L. Dudarev, G. A. Botton, S. Y. Savrasov, C. J. Humphreys and A. P. Sutton, Physical
Review B, 1998, 57, 1505-1509.
7. Y.-L. Lee, J. Kleis, J. Rossmeisl and D. Morgan, Physical Review B (Condensed Matter and
Materials Physics), 2009, 80, 224101.
8. L. Wang, T. Maxisch and G. Ceder, Physical Review B, 2006, 73, 195107. 9. N. Furuhata, E. Nakamura and E. Sawaguchi, 1969.
10. J. K. Norskov, J. Rossmeisl, A. Logadottir, L. Lindqvist, J. R. Kitchin, T. Bligaard and H. Jonsson, The Journal of Physical Chemistry B, 2004, 108, 17886-17892.
11. I. C. Man, H.-Y. Su, F. Calle-Vallejo, H. A. Hansen, J. I. Martínez, N. G. Inoglu, J. Kitchin, T. F. Jaramillo, J. K. Nørskov and J. Rossmeisl, Chem. Catal. Chem., 2011, 3, 1159-1165. 12. K. A. Persson, B. Waldwick, P. Lazic and G. Ceder, Phys. Rev. B, 2012, 85, 235438. 13. I. Castelli, K. Thygesen and K. Jacobsen, Top. Catal., 2014, 57, 265-272.
14. E. H. P. Cordfunke and R. J. M. Konings, Thermochimica Acta, 2001, 375, 65-79.
15. M. Risch, F. Ringleb, M. Kohlhoff, P. Bogdanoff, P. Chernev, I. Zaharieva and H. Dau,
Energy Environ. Sci., 2015, 8, 661-674.
16. J. B. Gerken, J. G. McAlpin, J. Y. C. Chen, M. L. Rigsby, W. H. Casey, R. D. Britt and S. S. Stahl, J. Am. Chem. Soc., 2011, 133, 14431-14442.
17. J. G. McAlpin, Y. Surendranath, M. Dincǎ, T. A. Stich, S. A. Stoian, W. H. Casey, D. G. Nocera and R. D. Britt, J. Am. Chem. Soc., 2010, 132, 6882-6883.