Active Noise Control in Supersonic Impinging Jets
Using Pulsed Microjets: Actuator Design,
Reduced-Order Modeling
by
Jae Jeen Choi
Submitted to the Mechanical Engineering
in partial fulfillment of the requirements for the degree of
Doctor of Philosophy in Mechanical Engineering
at the
MASSACHUSETTS INSTITUTE OF TECHNOLOGY
September 2006
@ Massachusetts Institute of Technology 2006. All rights reserved.
A uthor ...
.
...
...
Mechanical Engineering
June 6, 2006
Certified by ...
...
.
...
-
Seno
...
r R s
rn..ts..t...
Anuradha M. Annaswamy
Senior Research Scientist
A
Thesis Supervisor
Accepted by
Lallit Anand
Chairman, Department Committee on Graduate Students
ARCHIVES
MASSACHUSETTS INSTIMJTh OFTECHNOLOGY
JAN 2 3 2007
Active Noise Control in Supersonic Impinging Jets Using
Pulsed Microjets: Actuator Design, Reduced-Order
Modeling
by
Jae Jeen Choi
Submitted to the Mechanical Engineering on June 6, 2006, in partial fulfillment of the
requirements for the degree of
Doctor of Philosophy in Mechanical Engineering
Abstract
In recent years, it has been demonstrated that direct microjet injection into the shear layer of the main jet disrupts the feedback loop inherent in high speed impinging jet flows, thereby significantly reduces the adverse effects. The amount of noise reduced by microjet actuation is known to be dependent on nozzle operating conditions. In this paper, two active control strategies using microjets are suggested to maintain a uniform, reliable, and optimal reduction of these tones over the entire range of operating conditions.
In the first method, a quasi-closed loop control strategy is proposed using steady microjet injection and the Proper Orthogonal Decomposition (POD) algorithm. The most energetic spatial mode of the unsteady pressure along the nozzle diameter is captured using the POD, which in turn is used to determine the distribution of mi-crojet intensity along the nozzle exit. Preliminary experimental results from a STOVL supersonic jet facility at Mach 1.5 show that the quasi-closed loop control strategy, in some cases, provides an additional 8,10 dB reduction compared to axisymmetric injection at the desired operating conditions. The second method consists of a pulsed microjet injection, motivated by the need to further improve the noise suppression. It was observed that the pulsed microjet was able to bring about the same noise reduc-tion as steady injecreduc-tion using approximately 40% of the corresponding mass flow rate of the steady microjet case. Moreover, as the duty cycle increased, the performance of pulsed injection was further enhanced and was observed to completely eliminate the impinging tones at all operating conditions.
In order to obtain an optimal performance of the actuator, a new model of the impinging jet flow field is suggested based on a collision model of two identical vortices. In addition to the colliding vortex model, a two-mode feedback model that captures both the low and high-frequency Rossiter mode was suggested to investigate the role of pulsed microjet in the feedback loop. Due to the fact that a low frequency pulsing (16.4 Hz) brought about additional reduction compared to high frequency pulsing, the
presence of low frequency mode is identified. In the context of the analytic model, the effect of pulsing is modeled using a input-shaping controller that accomplishes noise-reduction through a suitable redistribution of the acoustic excitation over the high and low frequencies.
Thesis Supervisor: Anuradha M. Annaswamy Title: Senior Research Scientist
Acknowledgments
Looking back on my past, I can't not but agree that my career was not built for myself. There are so many people to guid me to the right direction in my life way. I wish to show my special thanks to all of them here.
First of all, my father, Mr. Byung Tae Choi brought a big picture of my future plan in mind and encouraged me to study in MIT when I was a very young boy. Moreover, my mother, Mrs. Jung Mi Park also helped me to realize the dream now. Even if they were located in Korea during my Ph.D period, their consistent mental support reinfoced my research ability a lot.
My brother, Jaewoong Choi influenced my life as not only my brother but also a great academic colleague who can discuss many engineering problems. He has always inspired me of creative thinking. The brain storming with him always refreshed me and brought new idea on my research.
I am also very grateful to my advisor, prof. Annaswamy. Her brilliant intuiation and knowledge helped me to resolve long cherished problems in my research area. Moreover, her kind and nice attitude alsway made me very comfortable to work with during whole my Ph.D period.
Another academic advisor, prof. Alvi, in FSU helped me to build up my experi-mental skill. Moreover, he always put my work to the first in the job queue, which makes me easy to finish works related to my research.
My thesis committee members, prof. Ghoniem, Hart raised very critical questions for me to think about thoroughly. Their academic comments made this thesis more
integrated.
Prof. Krothapalli, another advisor in FSU, facilites my lab work and helped me to decide my future career.
I also appreciate to my lab members in MIT Daehyun Wee and Wonyong Lee. Brilliant collegue Daehyun always showed a breakthrough in my reseach. With his kind assistant, especially modeling work, my thesis becomes more integrated. With Wonyong's cheerful attitude, Korean members in our lab. had great chance to avoid
boring MIT life.
Thank you very much my FSU collegues, Dr. Greska, Ning, Issac in FSU fluid mechanics research lab. Especially for Issac who soon to be Dr. right now. Without his assistance in PIV technique, I couldn't get such a nice data attracting many people. As our wish, someday I hope we can do collaborate for great acheivement.
Finally, I wish to my deepest thanks to my lovely wife, Jaeyeon Park. Without her persistent support, I couldn't finish my Ph.D period successfully. In spite of her busy schedule, she always concerned about my physical and mental condition which makes me in very calm and stable mental condition. I dedicate all my successful research result to her.
Contents
1 Introduction
2 Experimental Setup 20
2.1 Test Configuration and Facility . . . . 20
2.2 Pressure Measurements . . . . . . . . . . . . . . . 21
2.3 Particle Image Velocimetry (PIV) . . . .... .. 23
3 Control of Supersonic Impinging Jets 25 3.1 Steady Microjet Actuation . . . .... .. 25
3.1.1 Open-Loop Control Strategy: Cold Jet . . . . 25
3.1.2 Open-Loop Control Strategy: Hot Jet . . . . 27
3.2 Steady Microjet Actuation: POD-based Control . . . . 28
3.2.1 The Proper Orthogonal Decomposition Algorithm . . . . 28
3.2.2 POD-based Control of Impingement Tones . . . . 30
3.2.3 Results Using POD-Based Control . . . .... . 31
3.3 Pulsed Microjet Actuation using a Rotating Cap . . . . 34
3.3.1 Modulated Microjet - High Speed Valve . . . . 35
3.3.2 Pulsing Using a Rotating Cap . . . .. 36
3.3.3 Results Using Pulsed Microjets . . . . 39
4 A Reduced-Order Model of Supersonic Impinging Jets 43 4.1 Prediction of Impingement Frequencies . . . .. 43
4.3 A Reduced-order Feedback Model of the Impinging Jet . . . . 50
4.3.1 Identification of A Low Frequency Mode . . . . 51
4.3.2 A Reduced-Order Model . . . . .. 52
4.3.3 Effect of Pulsed Microjet-Control . . . . .. 53
4.3.4 Low Frequency Mode: A Possible Mechanism . . . . 55
5 Conclusion 58
A Tables 61
List of Figures
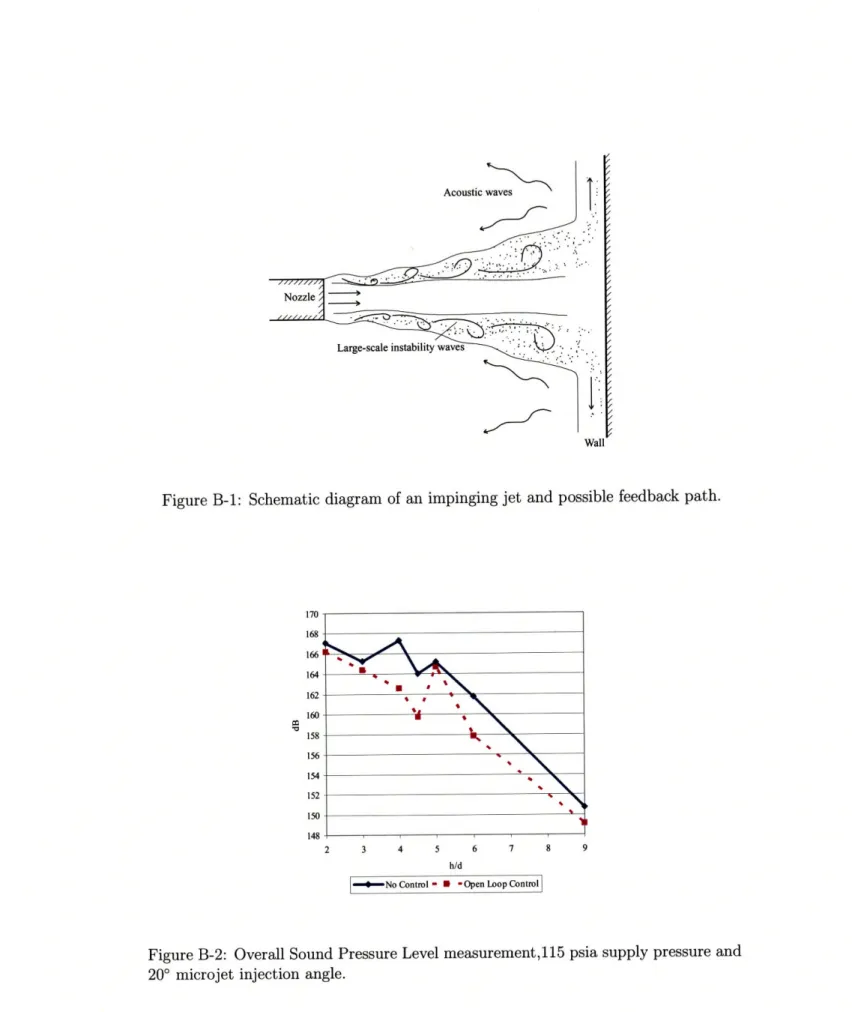
B-1 Schematic diagram of an impinging jet and possible feedback path. 65
B-2 Overall Sound Pressure Level measurement,115 psia supply pressure
and 20' microjet injection angle . . . . . . . ..... . 65
B-3 Test geometry ... . . ... 66
B-4 (a) Lift plate/microjet layout, (b)Microjet feed assembly . . . . . 67
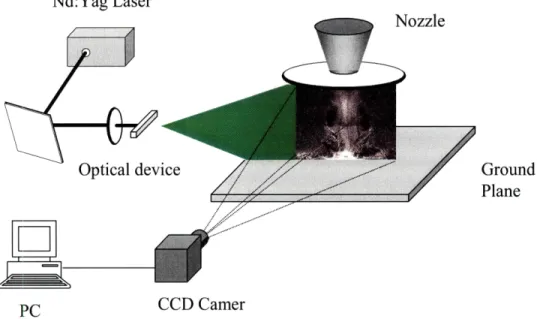
B-5 Schematics of PIV system . . . .... .. 68
B-6 Instantaneous shadowgraph images [2], NPR = 3.7 and h/d = 4.5: (a) no control and (b) with microjet control . . . . .... .. 68
B-7 Unsteady pressure and microphone spectra with and without control
[2]; NPR
=
3.7, h/d
=
4.5. (a) ground plane, (b) lift plate, (c)
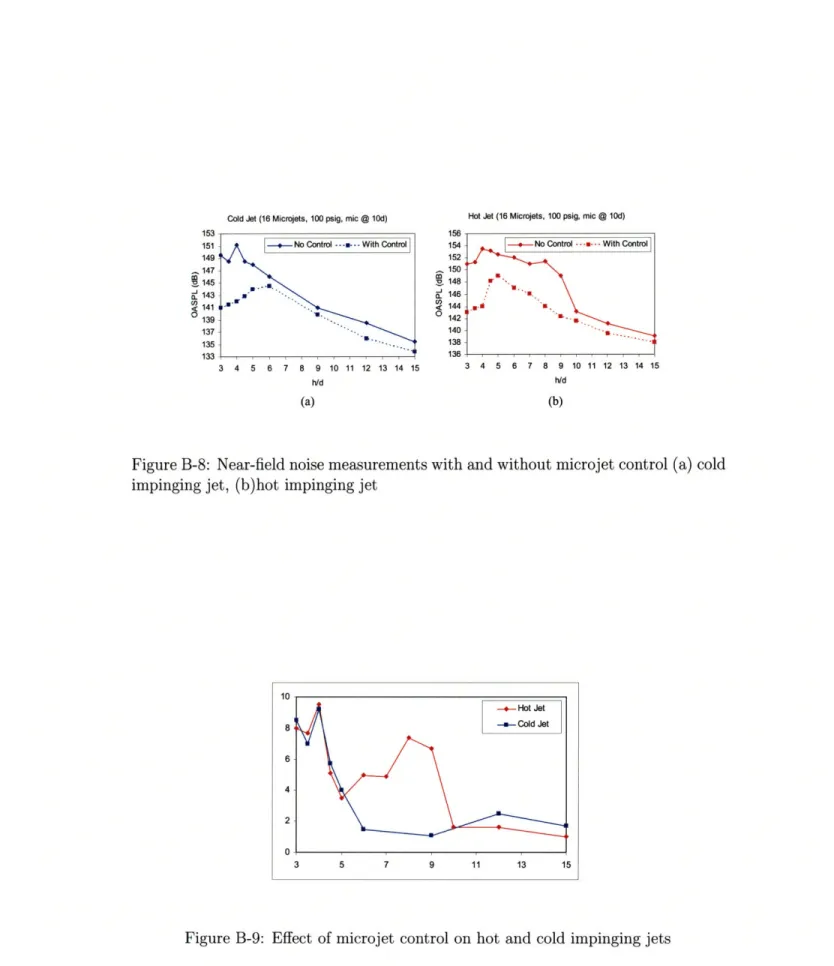
micro-phone . . . . . . . .. 69B-8 Near-field noise measurements with and without microjet control (a) cold impinging jet, (b)hot impinging jet . . . . 70
B-9 Effect of microjet control on hot and cold impinging jets . . . . 70
B-10 Experimental result with 20' microjet injection [31] (a) The first mode shape and suggested microjet pressure distribution for each height. h is the height of the lift plate from ground (b) Overall sound pressure levels (OASPL) for different control (NPR = 3.7) . . . . . . 72
B-11 Experimental result with a 300 microjet injection. Overall sound pres-sure levels (OASPL) for different control (NPR = 3.7) . . . . . 72
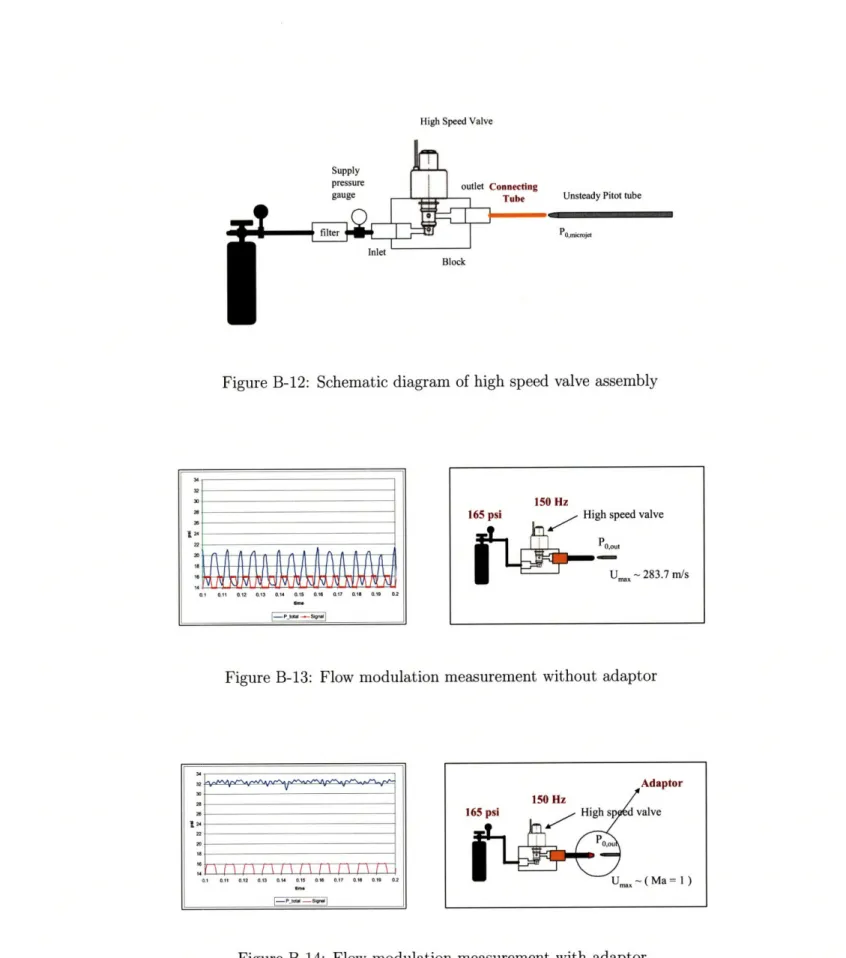
B-12 Schematic diagram of high speed valve assembly . . . . 73
B-13 Flow modulation measurement without adaptor . . . . 73
B-15 Experimental result with a 30' microjet injection. (a) Phase difference between the six kulites corresponding to the dominant frequency (b) The first POD mode for corresponding heights without control El: the
energy content of the first POD mode . . . . . 74
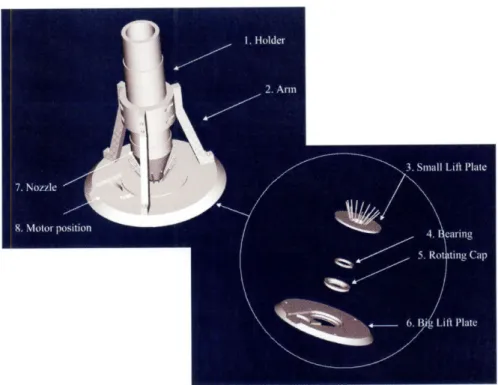
B-16 Conceptual diagram for rotating cap actuator . . . . . 74
B-17 Rotating cap design . ... ... 75
B-18 Assembled feature of lift plate and nozzle . . . . . 76
B-19 Experimental setup installed with lift plate . . . . . 76
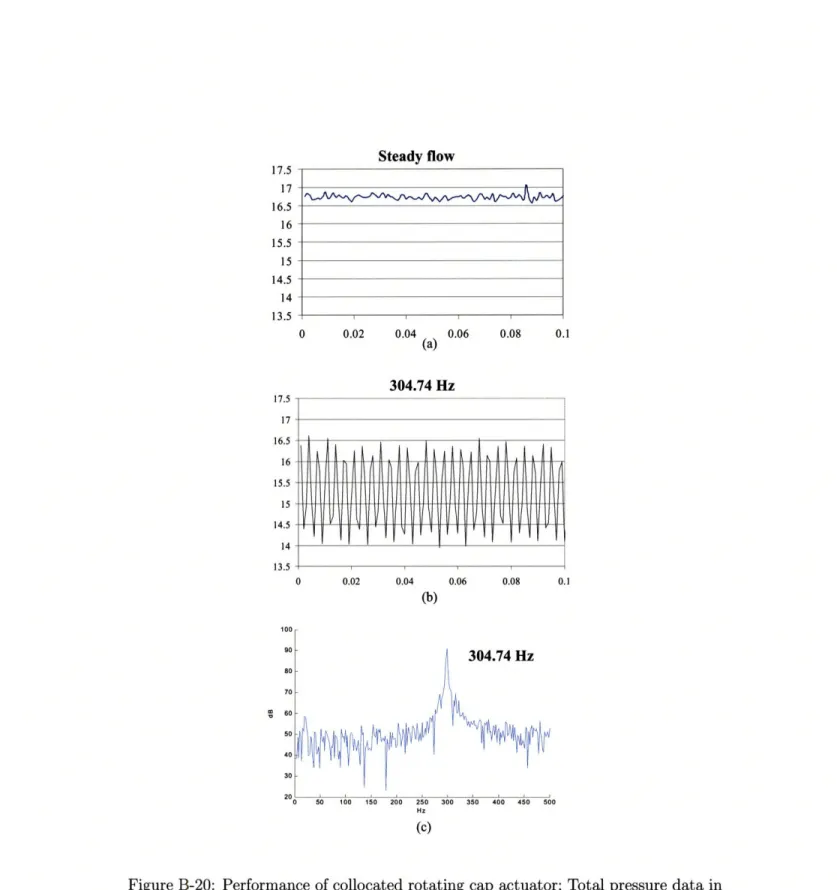
B-20 Performance of collocated rotating cap actuator; Total pressure data in time series (a) Case of steadily injecting microjet (b) Case of pulsing microjet at the speed of 304.74Hz (c) Power Spectra plot of pulsing m icrojet . . . 77
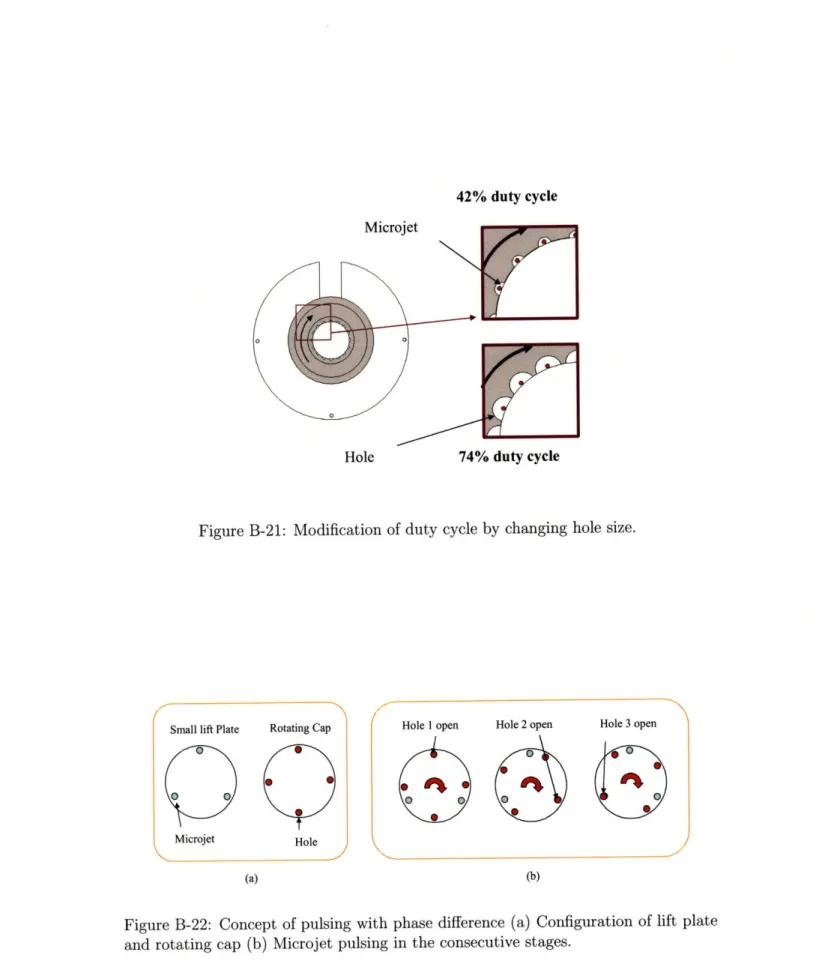
B-21 Modification of duty cycle by changing hole size . . . . . 78
B-22 Concept of pulsing with phase difference (a) Configuration of lift plate and rotating cap (b) Microjet pulsing in the consecutive stages. . . . 78
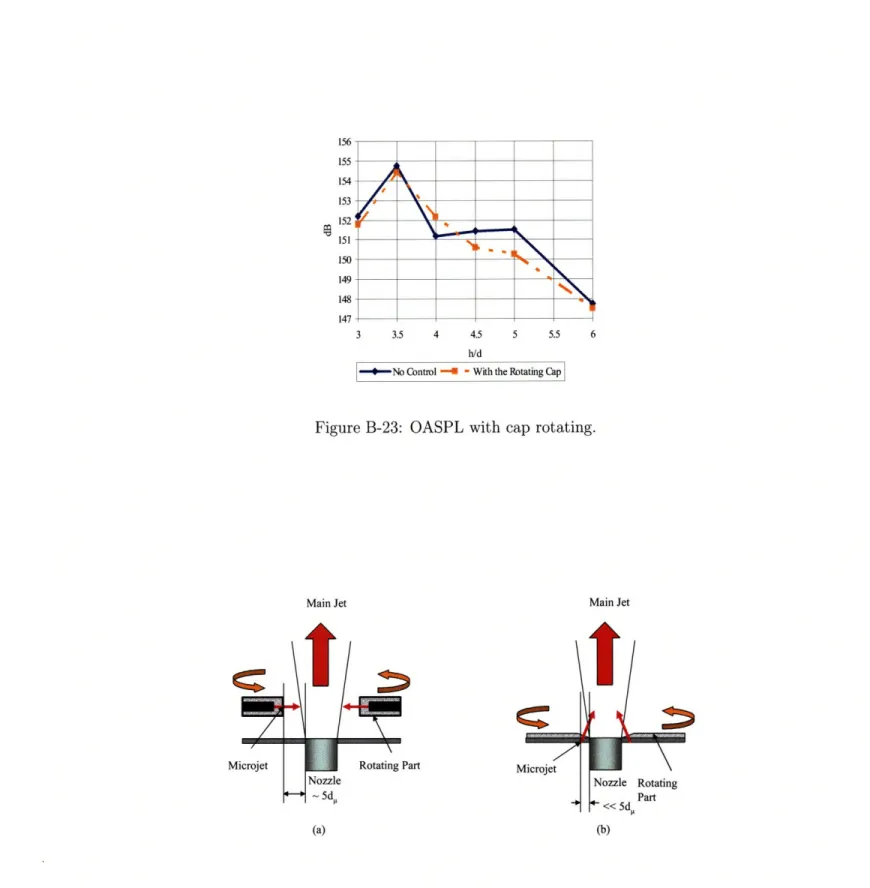
B-23 OASPL with cap rotating ... ... 79
B-24 (a) Rotating cap design in reference [22], (b) Collocated rotating cap used in this paper ... ... 79
B-25 Experimental result using synchronous pulsing scheme (a) Case of d, = 43% (b)Caseofdc = 70% ... ... 80
B-26 Axial mean velocity field, h/d = 3.5, (a) No control, (b) Steady injec-tion with rh = 0.8 rhloo0 and Psppy, = 77 psig, (c) Pulsing at fpulsing = 121.9 Hz, rh = 0.45 rAhloo and Popply = 77 psig, (d) Pulsing at fpulsinsg = 121.9 Hz, rh = 0.76 hloo and Pppl8 , = 140 psig where rhloo is microjet's mass flow rate under Pupply = 100 psig, d, = 56% . . . . 81
B-27 Axial mean velocity field, h/d = 4.0, (a) No control, (b) Steady injec-tion with h = 0.8 1lo00 and Psuppy = 77 psig, (c) Pulsing at fpulsing = 121.9 Hz, nh = 0.45 rhl00oo and Psppy = 77 psig, (d) Pulsing at fpulsing = 121.9 Hz, rh = 0.76 rhloo00 and Pppy = 140 psig where rhloo is microjet's mass flow rate under Pupply = 100 psig, d, = 56% . . . . 82
B-28 Axial turbulence intensity field, h/d = 3.5, (a) No control, (b) Steady injection with rh = 0.8 7hloo and Pppy = 77 psig, (c) Pulsing at
fpuaing = 121.9 Hz, rh = 0.45
rhloo
00 and P 1pply = 77 psig, (d) Pulsingat fpulsing = 121.9 Hz, rh = 0.76 rhloo and Pupply = 140 psig where
rhloo is microjet's mass flow rate under Pspply = 100 psig, d, = 56% . 83 B-29 Axial turbulence intensity field, h/d = 4.0, (a) No control, (b) Steady
injection with rh = 0.8 rloo0 and Pspply = 77 psig, (c) Pulsing at
fpulsing = 121.9 Hz, rh = 0.45 1nloo and Ppply = 77 psig, (d) Pulsing at fpuising = 121.9 Hz, rh = 0.76 rhloo00 and Pupply = 140 psig where
7h100 is microjet's mass flow rate under Puppvy = 100 psig, d, = 56% . 84 B-30 Noise reduction for different mass flow rate rh, rhioo: steady mass flow
rate under 100 psig supply pressure (x axis represents normalized mass flow rate (rh/rhloo00), y axis denotes noise reduction in dB scale) . . . . 85
B-31 Noise reduction for different duty cycles, Thloo00: steady mass flow rate
under 100 psig supply pressure (x axis represents h/d, y axis denotes
noise reduction in dB scale) ... ... 85
B-32 Noise reduction for different pulsing frequencies, d, = 43 % (x axis represents pulsing frequency, y axis denotes noise reduction in dB scale) 86 B-33 (a) Flow of pulsing with different phase (b) Implementation of pulsing
with phase difference. Supply pressure to microjet: 115 psia . . . . . 87 B-34 Frequency content at h/d = 6.0, measured by pressure transducer near
the nozzle exit using STOVL facility of FRML in FSU . . . . 87 B-35 Experimental schematics of reference [19] . . . . 88 B-36 Acoustic field generated by (a) Head-on collision of two identical
vor-tices and (b) Vortex impinging on the wall . . . . 88 B-37 Diagram of colliding vortices . . . .. 89 B-38 The time series of the acoustic pressure (a) Produced by head-on
colli-sion of two identical vortices Pcye, (b) Reconstructed repeating head-on
collision data, preconst ... .. ... 89
B-40 Noise reduction for different pulsing frequencies, d, = 56%, h/d = 3.5 (x axis represents pulsing frequency, y axis denotes noise reduction in dB scale) ...
B-41 (a) Spectral plot (low frequency regaion) (b) Spectral plot (High fre-quency region) of uncontrolled flow, h/d = 3.5, NPR = 3.7 ... B-42 Spectral plot of unsteady pressure and acoustic signal measured at
different sampling rate ...
B-43 Comparison between unsteady pressure measurement on the ground plane and pure noise ...
B-44 Spectral plot of (a) Unsteady pressure on the ground plane (b) Un-steady pressure on the lift plate (c) Acoustic noise of microphone. (d) Acoustic noise reduction (AdB) by pulsing actuation ...
B-45 Block diagram of feedback loop for uncontrolled impinging jet ... B-46 Comparison of experimental data with analytic model (a) No Control
case (b) Steady injection case (c) Low speed pulsing (16.4 Hz). Input signal to plant (d) No Control case (e) Steady injection case (f) Low speed pulsing (16.4 Hz). ...
B-47 Block diagram of feedback loop for controlled impinging jet by low
speed pulsing ... . . .. ...
Analytical investigation of resonance frequency . . . . . Im pact test . . . . . . .. . Schematics of impinging region.[1] . . . . Axial mean velocity, h/d = 3.5 . . . . Axial mean velocity in the impinging region, h/d = 3.5 Radial mean velocity, h/d = 3.5 . . . . Vorticity field, h/d = 3.5 ...
Axial turbulence intensity field, h/d = 3.5 . . . . Radial turbulence intensity field, h/d = 3.5 . .. . . . . Turbulent kinetic energy, h/d = 3.5 . . . . Reynolds stress, h/d = 3.5 ... . . . . 94 . . . . . 95 . . . . 95 . . . . . 96 . . . . . 96 . . . . . 97 . . . . . 98 . . . . 99 . . . . 100 . . . . . 101 . . . . . 102 . . . . 103 B-48 B-49 B-50 B-51 B-52 B-53 B-54 B-55 B-56 B-57 B-58
List of Tables
A.1 The energy content of the first four modes at each height (NPR=3.7, 20' injection). Experiment of the reference
[31].
. . . ... . .61 A.2 The energy content of the first four modes at each height (NPR=3.7,300 injection) . ... . 62
A.3 The formation number (Nf) corresponding M at each height (h/d)
condition ... ... ... 62
A.4 The frequency (f) corresponding formation number(Nf) at each height
(h/d) condition. * denotes the value closest to experimental data . . 62
Chapter 1
Introduction
For many years, flow control has been an important research topic in needs of many industrial applications such as aerospace, automobile and energy. Stimulated by mil-itary needs, during the second World War, flow control techniques were investigated to make it possible to develop highly maneuverable and efficient aircraft, missile, ship and submarine. More recently, the energy crisis and severe environmental restriction also accelerated flow control schemes to enhance fuel efficiency, and improve noise reduction.
In order to achieve performance objectives such as drag reduction, separation control, noise control, and thrust recovery, several flow control methods have been proposed over the past twenty years [18]. Since drag is the key ingredient of thrust loss, drag reduction is the primary method for increasing energy efficiency. In general, drag is composed of two major components, pressure drag and surface drag. Various kind of eddy breakup devices such as riblets, compliant surfaces, wavy walls were introduced to recover pressure drag [7, 9, 27]. It is also possible to produce additional thrust recovery by delaying laminar-to-turbulence transition point because the skin friction in laminar state is as much less than that in the turbulent condition [44, 45, 15]. On the other hand, because turbulence is very effective in mixing and enhancing heat transfer, early transition is also needed when rapid mixing and effective heat transfer is required [35]. Control of separation in external flows, such as over airfoils, can lead to substantial gains in lift, increase lift-to-drag ratios, decrease buffeting andor delay
stall, all of which enhance the system performance, while also potentially expanding the operation envelope of future. Using various actuators such as piezoelectric flaps actuator[38], acoustic excitation[57] and periodic tangential blowing, the boundary layer of airfoil can be forced to stay on the surface and ensure stable maneuvering[18]. Aside from performance efficiency, flow induced noise is regarded as one of the major problems in flow control. Compared to others, noise control is relatively young field of research. Needs to maintain stealth, overall quiet, and the associated performance metrics of reduced unsteadiness have spurred intense investigations in the flow noise control area. Flow induced noise study was firmly established using a very powerful theory by Lighthill[29], and enriched by aircraft jet noise studies. This thesis concerns a specific problem in the area of jet noise control.
In general, aircraft jet noise is produced by two noise sources; the large turbu-lence structures waves and the fine-scale turbuturbu-lence. In the case of the Short Take off and Vertical Landing aircraft, it experiences additional discrete and high ampli-tude acoustic tones that are produced via a feedback process while hovering in close proximity to the ground. These feedback interactions occur thus: Instability waves are generated by the acoustic excitation of the shear layer near the nozzle exit, which then convect down and evolve into spatially coherent structures. Upon impinging on the ground, these structures generate acoustic waves, which in turn excite the shear layer at the nozzle exit, thereby closing the feedback loop (see Fig. B-1 and [2, 28]). The high amplitude impingement tones are undesirable not only due to the associated high ambient noise, but also due to the accompanied unsteady pressure loads on the ground plane and the nearby surfaces. While the high noise levels can lead to struc-tural fatigue of the aircraft surfaces in the vicinity of the nozzles, the dynamic loads on the impingement surface can lead to an increased erosion of the landing surface as well as a dramatic lift loss during hover.
In an effort to reduce or eliminate these tones, several passive [16, 20, 40] and active control methods [2, 51, 52] have been attempted over the years to modify the feedback loop. Of these, the technique in [2] appears most promising from the point of view of efficiency, flexibility, and robustness. The method in [2] introduces
microjets along the periphery of the nozzle exit which modify the shear layer at its most receptive location thereby efficiently attenuating the impingement tones. Due to their small size, these microjets can be optimally distributed along the circumference and can also be introduced on-demand.
In [2], the microjets were injected with a steady-flow along the nozzle periphery, with the value maintained at a constant, independent of the impinging flow-field. This open-loop control strategy led, at certain heights, to the distinct tones either getting diminished or completely removed. There was an overall decline in the unsteadiness of the flow as well. Fig. B-2 shows the OASPL plot for different heights condition obtained using a 200 microjet injection with respect to the nozzle axis. It is also observed in Fig. B-2, that the magnitude of suppression is dependent to a large extent on the operating conditions and that the magnitude of reduction varies with the height of the lift plate from the ground as well as with the flow conditions. Since in practice, the operating conditions are expected to change significantly during take-off and landing, a more attractive control strategy is 'closed-loop control,' where the microjet effect is modified using suitable measurement of the impinging flow field, thereby maintaining a uniform noise reduction over a large range of operating conditions. In fact, it is well-known that for flows governed by a feedback loop, such as the present flow, screeching jets and others, the flowfield properties can change measurably even when the nominal operating conditions are the same. This is due the inherently high sensitivity of the feedback loop to very small changes in inlet and boundary conditions which can lead to changes in aeroacoustic properties (e.g. tonal frequencies and thier magnitudes, [31]). This further emphasizes the need for an adaptive control approach for such flows. In this paper, we explore such a closed-loop control strategy for reducing the impingement tones.
A traditional approach for designing a closed-loop controller is to begin with a model that describes the impinging flow-field, and carry out a model-based control design. There are, however, two difficulties in employing such an approach for the cur-rent problem. One is that the changing boundary conditions, compressibility effects, and the feedback interactions between acoustics and the shear make the modeling
significantly more complicated. The other is that the traditional feedback control paradigm typically requires the control input to be modulated at the natural fre-quencies of the system and mandate that the external actuator have the necessary bandwidth for operating at the natural frequencies [4]. In the problem under consider-ation, the impinging tones associated with the flow field are typically a few kilohertz. Given the current technology, modulating the microjets at the system frequencies while producing a microjets with significant momentum is extremely difficult, if not impossible. We note that, as discussed in [8], the development of high-frequency and high output actuators that can operate over a large range of frequencies is much needed. Although this is an active area of research, at present such actuators are not yet available in an usable platform.
To overcome these hurdles, two different control strategies were suggested in this paper. The first approach presented modulates the control input, p,, at a slow time-scale, so that it behaves like a parameter. Here, the control input, the azimuthal distribution of microjet pressure, is chosen from 'Proper Orthogonal Decomposition (POD)' which calculates the most energetic spatial mode from given experimental data. If this control input is chosen judiciously, then even small and slow changes in this 'parameter' can lead to large changes in the process dynamics.
The POD method is a tool used to extract the most energetic modes from a set of realizations from an underlying system [21]. These modes can be used as basis func-tions for Galerkin projecfunc-tions of the model in order to reduce the solution space being considered to the smallest linear subspace that is sufficient to describe the system. The decomposition is 'optimal' in that the energy contained in an Nh-ordered POD base is greater than any other N-ordered base in a mean-squared sense. Over the years, it has been applied in several disciplines including turbulence, stochastic pro-cesses, image processing, signal analysis, data compression, process identification and control in chemical engineering, and oceanography, and has been referred to by various names including Karhunen-Loeve decomposition, principal component analysis, and singular value decomposition. In fluid mechanical systems, the POD technique has been applied in the analysis of coherent structures in turbulent flows and in
obtain-ing reduced order models to describe the dominant characteristics of the phenomena. One of the earliest studies was conducting by [6] on a fully developed pipe flow. Since then, POD models have been used to model the one-dimensional Ginzburg-Landau equation [54], the laminar-turbulent transitional flow in a flat plate boundary layer [46], pressure fluctuations surrounding a turbulent jet [5], turbulent plane mixing layer [14], velocity field for an axisymmetric jet [13], low-dimensionality of a turbu-lent flow near wake [33], low-dimensional leading-edge vortices in the unsteady flow past a delta wing [12], and flow over a rectangular cavity [48]. The eigenfunctions were developed using both experimental and numerical database. In this paper, we use the POD method to extract information about the mode shapes from pressure measurements which, in return, is used for control input strategy.
In the second control method, a pulsed microjet is introduced as an actuator. The rationale for doing this is that for a given mass flow rate, pulsed injection can generate larger momentum than steady continuous microjet injection, which is consequently expected to have a stronger impact on the noise reduction mechanism.
Pulsing of jet flows has been attempted in reference [25, 53, 55, 56, 62]. Wiltse and Glezer introduced an open-loop control strategy in [62] via high frequency forcing in the inertial subrange of a free shear layer on a low speed flow. They found that broadband velocity fluctuations were reduced at low frequency but increased at high frequencies. [55, 56] and [53] adopted the high frequency forcing technology for control of the cavity flows and [43] reported results applied for control of impinging tones. More recently, [25] reported reducing a resonant peak using HTFA (Hartmann Tube Fluidic Acutator), a very high speed actuator for controlling the impinging jet noise. This actuator primarily worked in a blowing-mode, required fairly large mass-flow rates, and worked over a fairly narrow range of frequencies whose selection required considerable tuning. Here, we pursue a low speed pulsing strategy which is far below the natural frequency (-5 kHz) of the system. The actuator used modulates the flow at the exit of the microjet using a rotating cap. Saw-tooth structures placed in the inner race of the rotating cap block and unblock the microjet holes as the cap rotates and simulates an on-off micorjet action. A similar pulsing actuator design was used
to control a free jet in reference [22]. However, as demonstrated in section 3.3.2, the design proposed here in significantly more efficient due to the location of the actuator. Noise reduction using pulsed microjet injection is dependent on several control parameters such as duty cycle, mass flow rate, and phase difference between adjacent microjets and pulsing frequency. Among these parameters, the duty cycle and pulsing frequency play a major role in suppressing impinging tone. A change in the duty cycle from 43% to 70 % was shown in ref [10] to result in an additional reduction of 6 db. Pulsing at low frequency - 16 Hz results in an additional noise reduction of 1 ~- 2
dB.
Moreover, to ensure the optimal performance of the pulsed microjet actuator, a closed-loop control strategy based on the analytic model of impinging tone system is proposed. The overall impinging tone model is composed of two loops: (1) A feedfor-ward mechanism: noise generation by impingement of large scale vortical structure, (2) A feedback mechanism: formation of instability in the shear layer of the primary jet. The feedforward mechanism is modeled as a head-on collision between two vortex rings of identical strength because the main source for generating noise is the impinge-ment of a large scale vortical structure whose intensity is proportional to the vortex strength. It is well known that unsteady motion of vortices emits acoustic waves called "vortex sound" [24]. In his classical paper in reference [42], Powell showed that an acoustic wave is excited by the vortex acceleration term (w x v). The theory of vortex sound was further expanded in references. (Mdhring [34], Obermeier [39], and Kambe [23]). Of particular interest to the topic under consideration in this paper is reference [24] (Kambe and Minota, 1983) since their analytic model takes into con-sideration the compressibility and viscous effects. These two effects play a major role in our problem due to the fact that the flow is supersonic, and in an impinging jet, vortices formed are sufficiently close to the ground, respectively. Using this collision mechanism, we develop a new model in this paper that explains the acoustics due to impinging jets. The impinging tone frequencies are determined in a manner similar to that in reference [36], and are shown to capture the staging phenomena quite well. Then, the model is derived using the wave equation, colliding vortices of a certain
strength, and Green's function. This model is compared with experimental results obtained in the FMRL, FSU, and is shown to match the data quite well. In partic-ular, it is shown that the noise intensity is found to be increasingly proportional to the vortex strength.
To understand the role of pulsed microjet actuation, a two-mode lumped param-eter model is proposed in this thesis that captures both the dominant impinging tone and the low-frequency mode discussed above. Here, the effect of pulsing is modeled through an input-shaping controller which suitably redistributes the acoustic excita-tion over the high and low frequencies. In addiexcita-tion, stagnaexcita-tion bubble formed on the impinging area is investigated as a source of the low frequency mode.
The thesis begins with an explanation of the experimental setup in section 2, followed by open-loop control test for hot/cold jet in section 3.1. In section 3, two major control strategies, the POD-based control (section 3.2) and pulsed control (section 3.3), are presented. In this section, experimental results using POD based conrol strategy are presented, compared with an open-loop control strategy, and the dependency of noise reduction on pulsed microjet control parameters such as duty cycle, mass flow rate, phase difference and pulsing speed are studied in detail. Finally, analytical study of impinging tone is suggested in the following section 4.2 (colliding vortex model) and 4.3 (two-mode lumped parameter model).
Chapter 2
Experimental Setup
2.1
Test Configuration and Facility
The following experiments were carried out at the supersonic STOVL jet facility of the Fluid Mechanics Research Laboratory located at the Florida State University. A schematic of experimental setup with a single impinging jet is shown in Fig. B-3. This facility is used primarily to study jet induced phenomenon on STOVL aircraft hovering in and out of the ground effect [2, 28]. A circular plate of diameter D (25.4 cm - 10d) was flush mounted with the nozzle exit and, henceforth referred to as the
'lift plate', represents a aircraft planform. A 1 m x 1 m x 25 mm aluminum plate is mounted under the nozzle, which serves as the ground plane simulating the hovering situation by fixing it to the desired position. Further facility details can be found in [28].
The supersonic impinging jet was produced by an axisymmetric, convergent-divergent (C-D) nozzle with a design Mach number of 1.5. The throat and exit diameters (d, d,) of the nozzle are 2.54 cm and 2.75 cm (see Fig. B-3 & B-4). The divergent part of the nozzle is a straight-walled conic section with a 30 divergence angle from the throat to the nozzle exit. A high-pressure blow-down compressed air facility was used to supply air to the nozzles. A high-displacement reciprocating air compressor drives the facility, which is capable of supplying air at a maximum storage pressure of 160 bars. Large storage tanks provides a total capacity of 10m3, which
makes it possible to drive the Mach 1.5 jet continuously up to 40 min.
A Validyne pressure transducer measures the stagnation pressure in the settling chamber just upstream of the nozzle. Although tests were conducted over a range of Nozzle Pressure Ratios (NPR,where NPR = stagnation pressure/ambient pressure), the results discussed in the present paper are limited to NPR = 3.7 that corresponds to an ideally expanded Mach 1.5 jet. The nozzle total pressure was maintained within ± 0.2 psi of the desired conditions.
Sixteen microjets fabricated using 400 pm diameter stainless tubes were used as actuators for active flow control. These are flush mounted circumferentially around the main jet as shown in Fig. B-4(a). While the orientation of the jets can be varied between 0 and 90', most of the experiments reported in this paper correspond to the microjets at either 200 or 30' with respect to the nozzle axis. The supply for the microjets was provided by compressed nitrogen cylinders through a main and four secondary plenum chambers. In this manner, the supply pressures to each bank of microjets could be independently controlled. The microjets were operated over a range of NPR = 5 to 7 where the combined mass flow rate from all the microjets was less than 0.5% of the primary jet mass flux.
2.2
Pressure Measurements
Near-field noise was measured using B&KTM microphones placed approximately 25 cm away from the jet. The microphone signal was measured with an estimated uncer-tainty of
+
1 dB. The distribution of unsteady loads on the lift plate was measured by six high frequency response miniature KuliteTM pressure transducers (model: XCS-062), placed axisymmetrically around the nozzle periphery plate, at r/d =1.3 from the nozzle centerline (Fig. B-4). The Kulites were frequently calibrated throughout the experiments (almost every day) where the sensitivity was found to be very close to the values quoted by the vendor -between 24-26 mV/psi. The use of such trans-ducers for measuring dynamic pressures is a standard, well-established practice for low speed and high speed flows for more than a decade [17, 60, 61]. According tothe manufacturer's specifications, these transducers have a flat frequency response up to 20% of their natural frequency. The transducers have a combined non-linearity and hysteresis(max) of ±0.5%. The noise floor for these transducers was about 60 dB below the measured dynamic pressures, i.e. the signal to noise ratio was roughly 1000. Note that lift plate Kulites were only used for the steady microjet experiments. They were not used for the pulsed jet studies due to the vibration of the lift plate as a result of the pulsing hardware.
The transducer output were measured using National Instruments digital data acquisition cards (PC-MIO-16E-1 card coupled with SC 2040 Sample and Hold card) and LabViewTM software at a sampling rate of 70 kHz. The signal was low-pass filtered at 33 kHz, using Stanford Research Systems, SR640(8 pole-elliptic) Low Pass filters. These filters are phase-matched to better than +0.750. between channels. The phase lags between the various channels was checked by processing known signals through the entire chain of data acquisition and conditioning hardware, e.g. Filters, amplifiers and data acquisition cards. This was done using test signals over the range of frequencies of interest in the present study. The phases between the various chan-nels matched within +5'. Similar Kulite transducers have also been calibrated by
Ukeiley (Ref: Private communication, March 2006) where the phase between differ-ent transducers was found to be within 20. The results discussed in section 3.2.3 indicate a phase difference of about 150 which is well above the random error in phase introduced due to the hardware. 100k points were recorded for each signal. Standard statistical analysis techniques were used to obtain the spectral content and the Overall Sound Pressure Level (OASPL) from these measurements. For the spec-tral analysis, the Fast Fourier Transform (FFT) block size was 1024 points, with the resulting frequency resolution of 68.4 Hz. Consequently, the spectra shown in this paper represent an ensemble average of 100 'instantaneous' or short-time-duration spectra with an associated random error of 10%. The uncertainty associated with the unsteady pressure Prms, is ± 0.02 psi.
2.3
Particle Image Velocimetry (PIV)
The flow field and noise characteristics of impinging jet is investigated using Particle Image Velocimetry (PIV). The main feature of PIV is to record two consecutive images in quick succession. From a series of two images, the velocity field is derived using a cross-correlation algorithm. PIV system is composed of two hardware: high speed camera and laser illumination system. The images were recorded by a cross correlation CCD camera (Kodak ES 1.0 digital video camera). Its resolution is 1 k x 1 k, and is operated in double pulsed mode. In this mode of operation, with proper synchronization with laser pulses, the camera can acquire double images at a rate of 15 images pairs per second. The image is the oil or smoke particles illuminated by a double pulsed digitally sequenced Nd:YAG laser (Spectra-Physics, 400 mJ) which is a light sheet about 1.5 mm thickness created by suitable combination of spherical cylindrical lenses. The laser sheet is placed parallel to the jet direction and intersects the centerline of the nozzle. The jet was seeded with small (- 1 Am) oil droplets generated using a modified Laskin nozzle. The ambient air was seeded with smoke particle (- 5 Am) produced by a Rosco fog generator. A schematic of the experimental arrangement of the PIV system is shown in Fig. B-5.
The double pulsed images were acquired through an Imaging Technologies ICPCI board, which resides on a single slot of the PCI bus of a personal computer. The time between pulses was optimized at 1.2 /s. An image matching approach was used for the digital processing of the image pairs to produce the displacement field. To achieve velocity data with high spatial resolution, a novel processing scheme was developed in Lourenco and Krothapalli [32]. The flow field at any points is described by an analytical function using a least-squares-fitting algorithm.
u
= ax2+
bx + cy2+
dy+
exy+
f (2.1)The marked advantage of this approach is that the velocity field is described at any point with second-order accuracy and thus computation of derivatives is accomplished with higher precision. In the absence of shock cells, the mean velocity data using PIV
is in very good agreement (± 1 %) with the exit velocity calculated from isentropic relation. Moreover, instantaneous velocity field can capture the presence of large scale vortical structures in the primary jet and the wall jet. For further technology about the PIV, the reader can refer to a reference by A.Krothapalli et al. [28].
Chapter 3
Control of Supersonic Impinging
Jets
3.1
Steady Microjet Actuation
3.1.1
Open-Loop Control Strategy: Cold Jet
The microjet has been used for a noble actuator in suppressing the impinging tones for a long time. The very small size of the sensor/actuator hardware and the minimal mass flow rates requires minimal power consumption and is expected to result in negligible thrust loss of the primary jet. In contrast to the traditional passive control methods, the proposed actuator can be switched on and off strategically. Therefore, it will not degrade the operational performance of the aircraft when it is not needed. In the present experiments, microjets were made using 400 mm diameter stainless tubes. 16 microjets were located in the circumference of nozzle exit. For the open-loop control, the supply pressure of secondary plenum which determines the intensity of microjet strength was kept constant (100 psia) during the test.
In reference [2], supersonic impinging jets produce a very unsteady flow field, with high noise levels and discrete frequency acoustic tones. The instantaneous shadow-graph in Fig. B-6 (a) show the representative image for an uncontrolled -microjet off - impinging jet. We can see the distinct wave propagating up to the nozzle exit and
bounded wave from the lift plate. A large-scale structure are also conspicuous near the ground plane. This structure is thought to play a major role in flow entrainment and consequent cause of a large amount of lift loss suffered by STOVL aircraft during the hovering mode. On the other hand, the effect of microjet is visible from the shadowgraph image in Fig. B-6(b). The image is completely changed from the un-controlled one in some features that totally different dynamics seem to be dominant at the controlled case. The ambient air becomes free from the acoustic wave and a distinct large-scale structure in the middle of the jet disappeared.
Fig. B-7 shows the narrowband spectra of the unsteady pressure signal on the lift plate for NPR = 3.7, h/d = 4.5. The presence on multiple tones is apparent by the discrete peaks in the spectra. By activating the microjet, distinct peaks are significantly diminished or entirely eliminated. Along with the narrow band noise reduction, the broadband noise amplitude was diminished to a certain extent. Such overall amplitude reduction patterns are seen in other data captured on the ground plane and near-field acoustic measurement collected by microphone.
Fig. B-2 are the overall reduction in the unsteady pressure levels on the lift plate for NPR = 3.7. From the graph, we can easily notice that the microjet did reduce the overall sound pressure level to a certain degree under any circumstance. But, the most noteworthy fact is the reduction is non-uniform with respect to the height and is not repeatable. It is well-known that the properties of feedback loop of the uncontrolled jet, such as the amplitude and frequency of the impingement tones and the dominant instability modes in the flow, are highly sensitive to operating condi-tions. It is also worth noting due to the sensitivity of the feedback loop on the exact operating conditions, the effect of microjet control can vary even if the conditions are kept constant. As an example, although the height at which the microjets are minimally effective is h/d = 4.5 for the conditions, it can on occasion shift to h/d =
4 or 5 during a particular test. Hence, an efficient control scheme should be able to adapt to the changes in the local flow conditions, on-line to provide optimal control over the entire operating range.
3.1.2
Open-Loop Control Strategy: Hot Jet
Having demonstrated the efficacy of microjets in controlling the highly unsteady flowfield generated by cold impinging jets; we next examined the potential of microjet control for impinging hot jets. This brings us closer to flow conditions that occur in practical applications while allowing us to reevaluate some of the physical mechanisms developed and proposed during the study of cold impinging jets. Accordingly, the STOVL/Impinging Jet facility was modified via the addition of a 200 kW resistive heater. This allows the main jet to be operated at temperatures between 600'F and 800'F depending on the mass flow rate through the system.
Fig. B-8 shows near-field noise measurements, in terms of OASPL for hot and cold impinging jets, where the hot jet was operated at a stagnation temperature of approximately 240'F and the cold jet at about 85°F. These measurements were made using a B&KTM microphone placed 10 diameters from the jet centerline. A few points regarding these plots are worth noting. First, a comparison of the no control cases between the hot and cold jets shows that for all the cases (in terms of h/d) shown here, the overall noise levels for the hot jet are notably higher, as one would expect. Second, the elevated noise levels decay much more gradually with increasing ground plane distance - h/d, for the hot jet case. In fact, the noise levels for the hot impinging
jet remain roughly constant up to h/d = 8 after which noise decreases with increasing
h/d. In contrast, the OASPL for the cold jet begins to decrease monotonically after h/d = 4. This indicates that the feedback loop, which is responsible for the increased noise levels, is stronger and persists longer for hot impinging jets.
Microjet control for both these jets was implemented using sixteen, 60' microjets operated at ,- 100 psi. The effect of microjet control can be observed by comparing the solid lines (no control) with the dashed lines (control) in each of plots in Fig. B-8. For ease of comparison, this difference in OASPL for the hot and cold jets is shown in Fig. B-9. As seen in this plot, microjets are almost equally effective in weakening the resonance loop, and hence reducing the impinging jet noise, for both hot and cold jets up to about h/d = 5. However, beyond this distance, microjet control is rather
ineffective for cold jets. In contrast, microjets are significantly more effective for the hot jet up to h/d = 9. Recalling the fact that elevated noise levels are measured up to h/d = 9 for the hot jet (see Fig. B-8 (a), this behavior is expected.
3.2
Steady Microjet Actuation: POD-based
Con-trol
To maintain a uniform reduction of the unsteady pressure over a wide range of op-erating conditions, a quasi closed-loop control method was investigated. The details of this control strategy, the analytical basis, and the results obtained are reported in this section.
3.2.1
The Proper Orthogonal Decomposition Algorithm
As mentioned earlier, the POD method is a tool used to extract the most energetic modes from a set of realizations from an underlying system, a brief description of which is provided below. Given a flow defined on a domain Q over a time interval T, the flow-field variables such as velocity, pressure, and density, can be predicted using the governing equation. To ensure better accuracy, the flow is treated as a random process with parameter of time and space. We shall denote the flow variable as the sum of orthonormal basis a(t) and O(x), or
00
u(x, t) = E a,(t)¢0,(x), (3.1)
n=1
with the complexity of the model reduced by truncating the series at a suitable value. While a large number of basis functions O(x) can be used, the simplest, yet most powerful, basis function is that which is obtained using the Karhunen-Loeve expansion (3.1) [37].
Using the Karhunen-Loeve expansion, the unsteady pressure is expressed as 00
p(t, O) =
E
A-an(t)00n(9)(3.2)
n=1
where the temporal terms are uncorrelated and are given as
an(t)
=(
A)
J
¢(M)p(t, O)dO
(3.3)
E[am(t)an(t)] = 6. (3.4)
j
m(0)On(0)dx = 6n (3.5)and the orthonormal basis functions { ,} are calculated from integral equations based on a covariance function Rp(01, 92) as
f
Rp(1,09
2)¢n(0
2)dO
2 = A•nn(0 1), 81, 02E
Q
(3.6)
Rp(01, 92) = E [(Pe, - [t01))(Po2 - P(02))] (3.7)
where p(01), p(02) are mean values of variable Po, Po2, respectively and 6n = 0 (if
m 4 n), 1 (if m = n) . The derivation of the temporal term, the uncorrelated prop-erty and rigorous proofs can be found in Newman's paper [37]. The spatial mode n(01) can be calculated using 'method of snap shot' as follows [59]. Let the pn(j) be the pressure variable at a spatial point n at some time
j
where n = 1,2,. - .,N andj
= 1,2,... - ,J, with n much smaller than J. Now the matrixQ
can be expressed from singular value decomposition asp (1) p1 (1) ... p'(J)
p
2(1) p2(1) ... p2(J) p3(1) p3(1) ... p3(J) = UEVT QP
N(j)
N (1)
...
N (j)
where U(N x 1) and V(J x 1) are unitary matrix
[U]
T[U]
=[V]T[V]
=[I]1x1
and
0"l _ 0"2 "3Ž> '' a"l
The matrix V and a are the eigenvector and the square-root of the eigenvalue, respectively of the correlation matrix QTQ.
[Q]
T
[Q]
=
[V][y]'[U]T[U][E] [V]T
=[V][]T[] [V]T
(3.10)
The mode-shape can be computed by normalizing each column of the following matrix (.
4 _ QV
=
[U][E][V]
T
[V]
= [U][r]
=
[¢
1
2
... 01].
(3.11)In short, the spatial ith POD mode can be obtained as given below:
•( ) • V(jii)Q(xnJ),i 1,..., n 1,...,N
j=1
(3.12)
3.2.2
POD-based Control of Impingement Tones
In order to find the POD modes of the system, the measurements of pressure at all flow points and a real time calculation scheme are needed. However, this is not feasible either experimentally or computationally due to obvious constraints. Fortunately, the
(3.8)
(3.9)
[]lixt =
feedback loop is most sensitive to the conditions in the immediate vicinity of the jet nozzle. Therefore we analyze the flow field by focussing only to the nozzle exit. That is, we derive the control strategy using the expansion:
p(O,t) A p+(r = Rs,0, z = Znozzle,t)
L
= E XW(t)0i(0) (3.13)
i=1
where R8 is the radial position of the sensors on the lift plate and p+ is the pressure outside of main jet. Note that Oi's in Equation (3.13) are the spatial modes of the flow field confined to nozzle exit. Once the mode shapes are determined, we simply choose the control strategy as:
p,(O) = kq1(0) (3.14)
where q1 is the most energetic mode in Equation (3.13) and k is a calibration gain. The complete quasi closed-loop procedure therefore consists of collecting pressure measurements p(O, t), expanding them using POD modes as in Equation (3.13), de-termining the dominant mode q1, and matching the control input - which is the
microjet pressure distribution along the nozzle - to this dominant mode as in Equa-tion (3.14), and is denoted as a 'mode-matched' control strategy.
3.2.3
Results Using POD-Based Control
The mode-matched control strategy described above was implemented at the STOVL supersonic jet facility of the Fluid Mechanics Research Laboratory, FSU (see [31] for details). Four banks of microjets were distributed around the nozzle exit, while pres-sure fluctuations were sensed using six KuliteTM transducers flush mounted around the nozzle periphery on the lift plate, at r/d = 1.3, from the nozzle centerline (d is the nozzle throat diameter).
The control experiment was performed for a range of heights (of the nozzle above ground). At each height, in addition to the 'mode-matched' control, the open-loop
control strategy described earlier where the microjet pressure around the nozzle exit was maintained at a uniform value was also implemented. To ensure a fair comparison between the two control methods, the main nozzle was operated under the same conditions while implementing these two different control strategies. The calibration constant k in Equation (3.14) was chosen such that the minimum and maximum values of the POD mode over 0 correspond to 70 psia and 120 psia, respectively, which ensured maximum effectiveness of the actuator. The value of 70 psia was chosen since it was the lowest pressure at which any measurable control effect could be observed and 120 psia was chosen since it was the pressure that the steady control(with 200 inclination) effect is almost saturating. Fig. B-10 (a) shows the shape of the first mode and the suggested microjet bank pressure distribution for several heights.
Fig. B-10 (b) shows the results for the "POD-based" control strategy, which in-dicates a better performance compared to the open-loop controller throughout all operational conditions, with a large improvement at heights h/d = 4, 4.5 and 5. The reason for this increased noise reduction can be attributed to the percentage of en-ergy contained in the dominant mode, which is used in the control strategy. Seen in the Tbl. A.1, at heights 4 to 5, the energy content of the first mode is almost 90%.
In contrast, at heights 2 and 3, the energy level drops to about 50% and hence the corresponding improvement in the closed-loop strategy also drops to about half the dB-value at heights 2 and 3 compared to at heights 4 and 5.
As noted in the introduction, flows governed by a feedback loop are highly sensi-tive to very small changes in the local conditions, displaying different behavior under the same nominal conditions. This is illustrated in Fig. B-11 which shows the effect of control using microjets inclined at 300 with respect to the nozzle axis. A comparison of the OASPL of the uncontrolled cases in Fig. B-10 and B-11 shows that the noise characteristics in these two experiments are quite different, though major character-istics of the flow-field such as a monotonically decreasing OASPL as h/d increases and the overall noise level are the same. The distinct feature of this case is that the open-loop control with 300 injection led to a large amount of noise reduction without any feedback action. The POD-based control was observed to be slightly better with
an additional 1 2 dB reduction over open-loop control at heights 4.5 and 6 and denoted in Fig. B-11. From the energy content view (seen Fig. B-11 and Tbl. A.2 ), the microjet should have reduced the noise level further but the result was not as dramatic as before.
A possible reason for the occasional lack of impact from the microjets is discussed below. It has been observed in [28] that the flow characteristics evolve from a helical mode to a axisymmetric mode and return to a helical mode as the nozzle to ground distance becomes larger. Fig. B-15(a) shows the phase difference measured by Kulites mounted on the lift plate at the most dominant frequency, at h/d = 3.5, 4.0, and 4.5. A small deviation in the phase difference between the signals implies that the flow characteristics are axisymmetric.
From Fig. B-11 and Fig. B-15 (a)(b), we note that there is a correlation between the amount of noise reduction and the flow mode. It can be seen that at heights h/d = 3.5 and 4.5, the dominant mode is helical with the helicity being stronger at h/d = 3.5, while at h/d = 4.0, the dominant mode is axisymmetric. Correspondingly, we note that the OASPL reduction is the least at h/d = 3.5, maximum at h/d = 4.0, and medium at h/d = 4.5. That is, the lack of noise reduction appears to be correlated with the presence of a helical mode in the 300-injection case. This is also consistent
with the results of the 20o-injection case reported in Fig. B-10, where the dominant mode was predominantly axisymmetric at most heights. A low OASPL reduction of 1 dB occurring at h/d = 3.0 for the 20°-injection case could therefore be due to the fact that the component of the axisymmetric mode at this height was 55% which was less than the amount of axisymmetric mode present at other h/d. One could argue that the specific case of h/d = 4.5 with 30o-injection shown in Fig. B-11 is somewhat of an exception to the above hypothesis, which links lack of reduction to the presence of a helical mode. At this h/d, an OASPL reduction of 7 dB occurs despite the presence of a helical mode. This anomalous behavior could be due to the fact that the helical effect at the nozzle becomes less important as h/d increases.
A final observation is a comparison between the amount of noise reduction achieved in Fig. B-10 and Fig. B-11 which corresponds to a microjet injection of 200 and 300,
respectively. We note that larger reductions occur in the latter case, which is most likely due to the fact that with a larger injection angle, a greater penetration depth of the microjet streak into the shear-layer of the primary jet is achieved, as shown in [30]. At a given angle of injection, a larger penetration depth is always achievable by raising the mass-flux. However, increasing the mass-flux may not often be desirable due to practical constraints. Therefore, any actuation method that leads to a larger penetration depth at reduced mass-flux rates has a good chance of assuring a larger and more consistent noise reduction at all operating conditions. In the next section, we present the results of a different actuation method that has the above desirable property.
3.3
Pulsed Microjet Actuation using a Rotating
Cap
The results in section 3.2 show that a 'quasi-closed loop control' method produced additional noise reduction compared to the open-loop control strategy. To obtain a more consistent noise reduction over a larger range of jet operating conditions, we examined a different control strategy, which consists of a technique that pulses the microjet flow. The rationale for introducing pulsing is discussed below.
For a given mass flow rate ri = pAU,.0, the force induced by steady microjet
injection is given by the rate of momentum change in time. Using the same mass flow rate, an unsteady injection can exert more force on the primary jet shear layer of the flow than steady injection, in an average sense. Equation (3.15) described below shows that, if as an example, the unsteady flow through the microjets is represented in sinusoidal form, the additional force increase is realized by pA (B2/2):
F,.steady = rhU.o = pAU2,.0
Ul.unsteady
=U,.
0+ B sin(wt)
F11
t) = -
ru Ounsteaydt27r
o
= pA (U2.0 +
(
2(3.15)
2
That is, for a given mass flow rate, a pulsed injection can generate more momentum than steady continuous microjet injection, and hence can perhaps have a stronger impact on the jet shear layer, thus disrupting the feedback mechanism more effectively and hence reducing the noise more significantly.
3.3.1
Modulated Microjet
-
High Speed Valve
The easiest way to generate pulsing is using a high speed valve. The traditional feedback control paradigm requires the control input to be modulated at the natural frequencies of the system (for example, see Rowley et al. [50]). This, in turn, man-dates that the external actuator have the necessary bandwidth for operating at the natural frequencies. In the problem under consideration, the edge tones associated with the flow-field are typically of a few kilohertz. Given the current valve technology, modulating the microjets at the system frequencies is nearly impossible. It follows that the first approach, as presented above, is reduced to pulsing microjet injection at the frequency of sub harmonics of the resonance frequencies. The specification of the relevant high speed valve is listed in Tbl. A.5. Fig. B-12 shows the schematic diagram of the high speed valve assembly. Highly pressurized flow is passing through a filter, supplied to the inlet of the block and drained out of the connecting tube. The high speed valve inside the assembly block modulates the exit flow. Unsteady pressure transducer by KuliteTM , located at the end of the connecting tube measures the total pressure fluctuation.
To verify the correct function of the valve, an experiment was conducted under the condition of 50 % duty cycle and at 165 psi supply pressure. The result shown in Fig. B-13 indicates noticeable flow modulation issuing out of the connecting tube at the 150 Hz valve speed. The next step was to size down the diameter of the connecting tube so as to match the microjet size at the other end. Because the
![Figure B-7: Unsteady pressure and microphone spectra with and without control [2];](https://thumb-eu.123doks.com/thumbv2/123doknet/13845611.444374/69.918.313.632.198.1014/figure-b-unsteady-pressure-microphone-spectra-control.webp)
![Figure B-10: Experimental result with 20' microjet injection [31] (a) The first mode shape and suggested microjet pressure distribution for each height](https://thumb-eu.123doks.com/thumbv2/123doknet/13845611.444374/72.918.30.901.62.1057/figure-experimental-microjet-injection-suggested-microjet-pressure-distribution.webp)