HAL Id: hal-00772188
https://hal.archives-ouvertes.fr/hal-00772188
Submitted on 10 Jan 2013HAL is a multi-disciplinary open access archive for the deposit and dissemination of sci-entific research documents, whether they are pub-lished or not. The documents may come from teaching and research institutions in France or abroad, or from public or private research centers.
L’archive ouverte pluridisciplinaire HAL, est destinée au dépôt et à la diffusion de documents scientifiques de niveau recherche, publiés ou non, émanant des établissements d’enseignement et de recherche français ou étrangers, des laboratoires publics ou privés.
Influence of the U3O7 domain structure on cracking
during the oxidation of UO2
Lionel Desgranges, Hervé Palancher, M. Gamaléri, Jean-Sébastien Micha,
Virgil Optasanu, Laura Raceanu, Tony Montesin, Nicolas Creton
To cite this version:
Lionel Desgranges, Hervé Palancher, M. Gamaléri, Jean-Sébastien Micha, Virgil Optasanu, et al.. Influence of the U3O7 domain structure on cracking during the oxidation of UO2. Journal of Nuclear Materials, Elsevier, 2010, 402 (2-3), pp.167-172. �10.1016/j.jnucmat.2010.05.014�. �hal-00772188�
Final version of the paper and citation:
Desgranges et al., Journal of Nuclear Materials 402 (2010) 167–172 DOI : 10.1016/j.jnucmat.2010.05.014
Influence of the U
3O
7domain structure on cracking during the
oxidation of UO
2L.Desgranges, H. Palancher, M. Gamaléri CEA/DEN/DEC Bat 130 C.E. Cadarache 13108 Saint Paul lez Durance FRANCE
J.S. Micha, CNRS,DSM/INAC/SPrAM,C.E. Grenoble, 17 rue des Martyrs, 38054Grenoble cedex 9FRANCE
Virgil Optasanu, Laura Raceanu, Tony Montesin, Nicolas Creton, ICB, UMR 5209 CNRS Av. Alain Savary, 21078 Dijon Cedex FRANCE
Abstract
Cracking is observed when a UO2 single crystal is oxidised in air. Previous studies led to the hypothesis thatcracking occurs once a critical depth of U3O7 oxidised layer is reached. We present some µLaue X-Ray diffraction results, which evidence that the U3O7 layer, grown by topotaxy on UO2, is made of domains with different crystalline orientations. This observation was used to perform a modelling of oxidation coupling chemical and mechanical parameters, which showed that the domain patterning induces stress localisation. This result is discussed in comparison with stress localisation observed in thin layer deposited on a substrateand used to propose an interpretation of UO2 oxidation and cracking.
Introduction
The oxidation of uranium dioxide is a key process involved at least in two important steps of nuclear industry: fuel fabrication and safety of spent fuel dry storage [1]. Oxidation induces cracking and spalling of the initial UO2 material, which might lead to rod cracking in case of defective fuel in dry storage conditions. The morphological evolution of a UO2 pellet during oxidation was studied by Bae [2], who evidenced two stages: first macro-cracking occurs when U4O9 and U3O7 are formed, then micro-cracking is associated with the formation of U3O8. This description is consistent with the one previously proposed by Tempest et al. [3] in which cracks appear in the uniform layer of U3O7formed on the surface of a UO2 sample. In situ Environmental Scanning Electron Microscope experiments showed that a UO2 single crystal is transformed in a powder during oxidation by the formation of series of macro-cracks [4]. The formation of these macrocracks had been observed as soon as the oxidised layer formed on the initial UO2 sample reached a critical depth of about 0.4µm. This experimental result was used to propose a criterion for the safe handling of oxidized defective fuel rods [5]. This criterion assumes that the nuclear fuel will be safe as long as no macro-crack is formed. A numerical evaluation of this safe duration was also recently proposed by calculating the time needed to form a critical thickness of the oxidised layer [6].
Cracking of thin films has been widely studied both theoretically and experimentallybecause of its relevance for the semi-conductor industry. Although large elastic strains can be tolerated in very thin films, above some critical thickness the film will act to relieve the strains by generating dislocations, micro-twins, surface instabilities and cracks. The formation of cracks in oxidised UO2shares many similarities with cracking of thin film. Macrocracking of UO2 is equivalent to the 2D periodic cracking of thin film witha regularspacing of similar cracks [see for example7,8].In [4] it was shown that the crack which splits the oxidised layer also penetrates in the UO2 substrate, which was observed on thin film deposited on brittle substrate [9]. But some discrepancies exist between UO2 oxidation, which proceeds by topotaxy (growth of a new crystalline phase within the substrate by chemical reaction) and thin film growthwhich proceeds by epitaxy (growth of an external phase on a substrate by deposit).First the interface between a film and its substrate is defined by a sharp change of crystalline lattice at a monolayer scale; in the UO2 on the contrary this interface rather corresponds to an interdiffusion layer whose thickness is at least 5 nm [10].Second, UO2 oxidation proceeds at temperatures less than 400°C (in dry storage condition) by oxygen diffusion only [11], thus the formation of dislocations, which are usually invoked to describe thin film formation, is not likely to exist in UO2 oxidation.
In order to achieve a better description of UO2 oxidation, a new model was developed in which mechanical stresses are coupled to diffusion processes.The first results obtained with a one dimension version of this model [12] showed that the oxidation mechanism was better described with an oxidised layer with tensile stress, i.e. a lattice mismatch due to a smaller unit cell volume in the oxidised layer than in the bulk UO2.This model is only valid for isotropic crystalline phase, which is not the case for U3O7.
To better describe UO2 oxidation a 3D model is needed. In this paper we describe how such a model was built.
Because UO2 oxidation is a complex phenomenon involving several crystalline phases, which change as a function of temperature, oxidation conditions were fixed to get a simple system. The oxidation of a UO2 single crystal in air at 300°C was then chosen, because only UO2 and U3O7 phases are observed when cracking occurs [4]. Even in this case, oxidation modelling is still a complex problem because U3O7 phase has a tetragonal crystalline symmetry and several crystalline orientations of U3O7 on UO2 are possible. In literature the existence of orientation relationships between UO2 and its oxidation layer is reported [13],but the topotaxy relationships at the UO2-U3O7 interface, at which cracking occurs, still needs to be determined.That is why we first studied them experimentally using X-Ray diffraction. Then our mechanical modelling of UO2 oxidation was modified to take them into account. This modified modelling is then used to discuss whether the existence of a critical depth of U3O7 is needed for cracking to occur.
characterisation of UO2-U3O7 interface by X-Ray diffraction
Several X-Ray diffraction studies of UO2 oxidation are reported in literature [see for example 14
,15]. But no decisive information were gained on the topotaxy relationships at the UO2-U3O7 interface, because U3O7 appears as very broad peaks on the diffraction pattern as long as UO2 can be observed. This can be explained by a continuous change of U3O7 c/a ratio from 1 to 1.03, and also by the existence of micro-strains induced by the mismatch between UO2 and U3O7 unit cells. Therefore a new experimental approach is needed to get a more in depth characterisation of UO2-U3O7 interface.
We used X-ray diffraction with synchrotron radiation in Laue mode on a UO2 single crystal, because this method allows an exploration of the reciprocal space with a better accuracy than conventional X-Ray diffraction.
Sample preparation
The 5*5*1mm UO2 single crystal analysed here, was also used for a study of cracking [4] in which it was oxidised in air at 300°C and characterised at different oxidation times. This single crystal has only (111) oriented natural faces, on which characterisation was performed. After 1+1/2 hours of oxidation, a U3O7 layer was observedby X-Ray diffraction; taking into account the penetration depth of X-Rays, its thickness was estimated around a few tenths of a µm. Its diffraction peaks in (111) direction were characterised by conventional Bragg-Brentano diffraction, and its (111) peak was recorded in a 2D (, 2) diffraction pattern. The spot corresponding to the (111) U3O7 diffractionplan is 10 times wider than the UO2 spot in the direction. This suggests some disorientation of the U3O7 crystallites grown on the UO2 single crystal. In order to better characterise this disorientation, the single crystal was brought to ESRF to perform µ-XRD in Laue mode.
µ-XRD in Laue mode
µ-XRD has been performed at the BM32 beamline at the ESRF (Grenoble, France). There, a dedicated set-up enables a 2D XRD -mapping with micrometer spatial resolution [16]. Before the experiment, the incoming polychromatic X-ray beam has been carefully characterised: its energy band pass ranges from 5 to 27 keV and its size was 1*2µm² (horizontal and vertical full width at half maximum). During the measurement, the X-ray beam incidence angle has been kept fixed to 40°.
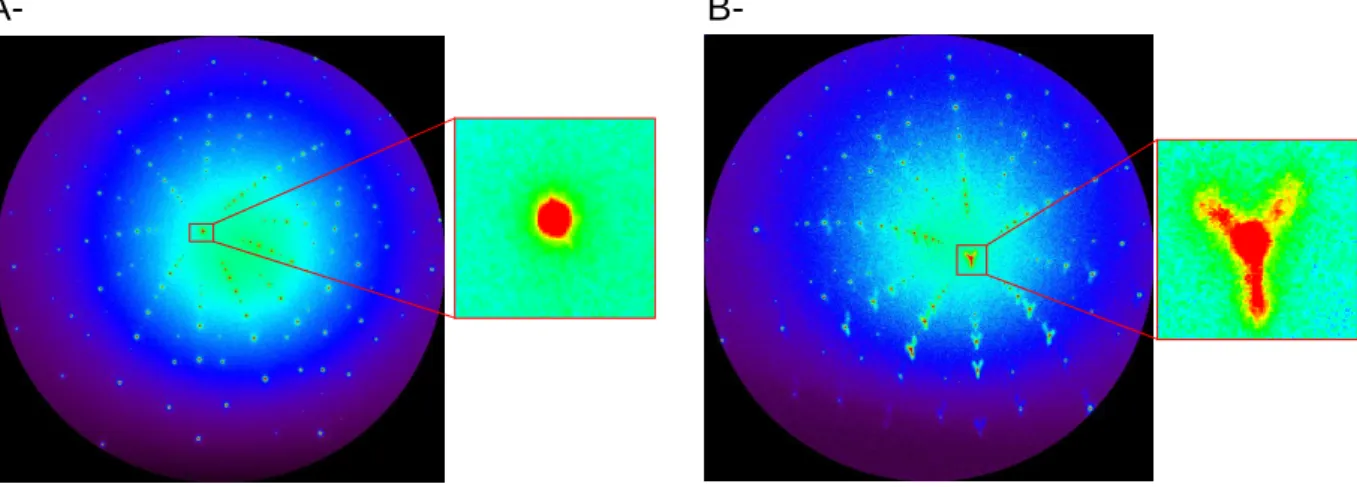
XRD data have been collected with a two-dimensional MAR165 CCD camera at several locations on the oxidised surface. A typical image is shown on Figure 1;it is compared to that collected on a UO2 single crystal previously annealed at 1700°C during 24hours, considered as a strain free reference sample.
Figure 1.Comparison of the µ-XRD Laue images collected on a strain free (A-) UO2 and on an
oxidised (B-) UO2 single crystals
The shape of the Bragg spot,initially round on the reference UO2, became elongated along three different directions. These elongations were interpreted considering the crystalline orientations of the U3O7 crystallites on UO2 substrate.
B-Data analysis
Considering the X-ray penetration depth of X-ray beams into UO2 in the available X-Ray range (5 to 27 keV), both the oxidised layer and the preserved substrate are always probed. The collected image can thus be considered as the sum of two diagrams, the first representative of unstrained UO2 (central round part of the Bragg spot) and the second of the oxidised layer (elongations).
At a first step, using the XMAS software [17], the peak search parameters were set to only take into account the central part of the Bragg peak (i.e. the unstrained one). Based on the obtained peak list, an indexation was performed and the orientation matrix calculated. This indexation confirmed that the UO2 [111] axis was perpendicular to the single crystal surface within several degrees. The position of the (-7,7,7) diffraction spot at the centre of the diffraction pattern in Figure 2 confirms this orientation.
- 7, 7, 7
- 4, 2, 4
-4, 4, 8
- 8, 4, 4
-2, 6, 10
0, 4, 4
- 6, 6, 4
-3, 3, 5
-8, 12, 8
Figure 2 : Analysis of the image collected on the oxidised UO2 single crystals. Indexation (A-)
and simulations of images implying a strained UO2 structure
At a second step, the elongations were simulated as strained UO2using the Laue tool software[18]. These simulations allowed determining the directions and intensities of the measured strain.
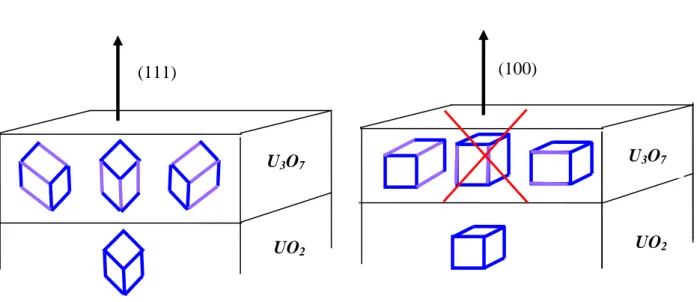
Each elongation on Figure 2was successfully attributed to a distorted UO2 lattice. The relationships between UO2 and U3O7 unit cell used in order to describe the U3O7 as a distorted UO2are presented in Figure 3. Both phases share the same crystalline axis. Going for UO2 to U3O7 leads to a relative increase of 3% along one axis, the elongated axis becomes c axis of U3O7 structure. Three choices for the U3O7 c axis are possible, corresponding to the three elongations observed around the UO2 round spot on Figure 2.
The measured distortion is consistent with the U3O7 crystalline structure, whose c/a ratio is reported to be 1.03 [1].Moreover UO2 and U3O7 unit cell axis sharing the same orientation is consistent with the topotactic growth of U3O7 on UO2. However the intensity of the three elongations shows some fluctuations that can not be explained if the three types of domains were given the same weight. These intensity fluctuations could be interpreted as the U3O7 domain distribution within the sampling surface of the X-Ray beam, equal to 2 µm². Local variations of the domain microstructure due to crystal surface defects could also lead to intensity fluctuations.
.
Figure 3 : Schematic description of the crystalline relationships between UO2 and
U3O7experimentally observed and modelled.
Modelling U3O7layer on UO2substrate
U3O7
UO2
(111) (100)
Experimental result Modelled geometry
U3O7
In the experimental part it has been shown that U3O7 is formed with crystallites having different crystalline orientations on the (111) oriented natural face of a UO2 crystal, related to the choice of the c axis when transforming the cubic UO2 unit cell in the tetragonal U3O7 unit cell. The choice of (111) surface for UO2 implies three different orientations of U3O7 crystallites. For the modelling purpose, these three different orientations would have led to a complicated geometry. So we decided to describe UO2 oxidation on a (100) surface, because it leads to a simpler geometry.
hypothesis
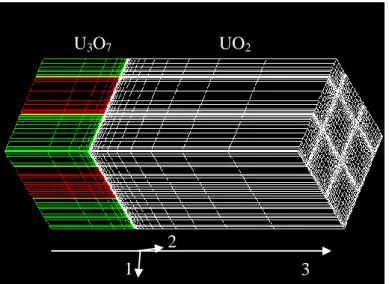
We consider multi-domains of U3O7lying on a UO2substrate. The direction (001) inUO2is parallel to the direction (010) inU3O7. Thus, the c(U3O7) direction lies in the plane of the interface. We excluded the case in which c(U3O7) direction is perpendicular to interface because it corresponds to the highest mismatch between UO2 and U3O7(Figure 3). This assumption is consistent with some previous X-Ray diffraction results [15]. TheU3O7domains have two possible directions for the axis c. The U3O7 layer is made of alternate domains in which a and c axis contained in the interface permute. The boundaries between these domains are located on (101) planes for energy minimisation. In Figure 4we show the mesh of our FEM model. The U3O7domains are in red and green; the white mesh represents UO2substrate.
Figure 4 : An example of mesh. Multi-domain of U3O7 on UO2 substrate
This geometry was implemented in the Finite Element Model (FEM) code CASTEM, we used for our calculations.The U3O7 domains were not modified during the calculations: no mobility of the interfaces was simulated. For a given thickness of U3O7 layer, the stress distribution and the oxygen diffusion fluxes are successively computed.
3
U3O7 UO2
1 2
The first calculation step computes the stress distribution induced by the connection of differentU3O7domains and UO2substrate.The second step computes theoxygen chemical diffusioncoupled to the previously calculated mechanical state. The background theoryfor coupling chemical diffusion to mechanical statewas widely exposed in [19], [20], [21],and is based on previous works [22]. The diffusion coefficient we used depends onboth the mechanical stress and the stress gradient:
D=D0 1-M0hijc RT sij c + ¶sij ¶c æ è ç ö ø ÷ é ë ê ù û ú
whereM0 is the molar mass of the UO2, ij is the chemical expansion coefficient, c is the
oxygen concentration which is dissolved in UO2 lattice, is the mechanical stress, T is the temperature and R is the universal constant of gases.
Table 1 shows the parameters used in our simulations.
D0
[cm3/s]
h
ij1
[m3/kg] T °C E GPa Lattice parameters Å
a b c Ref. 23 24 25 26,13 UO2 0.0055 exp -26.3 RT æ èç öø÷ -1.248.10-5 300 200 0,32 5,47 (cubic) U3O7 5,363 (tetragonal) 5,531
Table 1 : parameters used for computations
U3O7 material exists mainly in powder form for which mechanical parameters are difficult to obtain. Thus we assumed that the U3O7 Young modulus and Poisson’sratiowere the same as those of UO2. Chemical expansion coefficientwas not considered in U3O7.
The lateral size of each domain of U3O7 is 100 nm. Their thickness was fixed at 50 nm, 100 nm, 200 nm, 400 nm successively while the thickness of UO2is considered as infinite.
Results
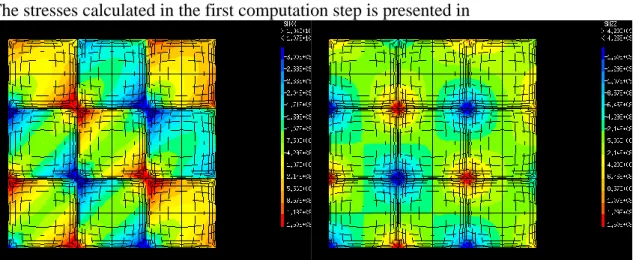
The stresses calculated in the first computation step is presented in
Figure 5 :11and 33 stresseson a section parallel to the UO2/U3O7 interface at 1 nm depth
inside UO2.
The second step computation evidenced that heterogeneities in stress led to different oxygen fluxes in UO2. This produces a transversal oxygen concentration gradient. Moreover, differences in concentration induce differences in chemical expansion, which generates additional mechanical stresses, from -70 MPa to 220 MPa, having a strong feedback on the diffusion. The oxygen concentration distribution is shown in Figure 6in a transversal section parallel to the UO2/U3O7 interface at 10 nm depth in UO2. Thisoxygen concentration leads to changes of chemical composition in the UO2+x phase with x varying 0.01 to 0.11.
Figure 6 : Concentration after diffusion in a transversal section UO2-side.
Discussion
Our experimental results evidenced that the formation of a U3O7 layer on a UO2 single crystal is associated with the formation of U3O7 domains having different crystalline orientations related to the choice of U3O7 c axis. Moreover our model evidenced that the existence of periodical U3O7 domains induces variations in stresses and oxygen concentration at the
microstructure, and how this microstructure can justify the existence of a critical depth needed for the formation of cracks in the oxidised layer.
U3O7 is a metastable phase: in thermodynamic equilibrium conditions without stresses, it is transformed in a mixture of U4O9 and U3O8. One reason for the stabilisation of U3O7 can be the stress state generated by the formation of an oxidised layer on the UO2 substrate.
U4O9 has a cubic crystalline structure related to the one of UO2; their unit cell parameter differs from 5.47 for UO2 to 5.44 for U4O9. As U4O9 is formed by topotaxy on UO2, this difference in cell parameter induces stresses that can be accommodated by an elastic deformation in which U4O9 would be stretched in the interface plane and compressed perpendicular to it (assuming a Poisson coefficient =0.3).
U3O8 derives from UO2 by a ~ 1/3 expansion along one UO2 (111) axis [11]. In a uniformly oxidised layer, the formation of U3O8 is likely to induce an expansion in a direction perpendicular to the surface,which minimises the strain state at the interface with the substrate. But the compression stress in U4O9 makes the structural transformation in U3O8 more energetically costly.
The minimisation of the mechanical energy of an oxidised layer on a substrate can also be achieved by stress localisation, as in the case of thin layer deposited on a substrate.In this case, Asaro & Tiller [27], and Grinfeld' [28] showed that a sinusoidal deformation of the surface may decrease the mechanical energy of the system. This sinusoidal deformation creates hills and valleys with different mechanical states, stress relieved at the top of the hills and stress increased at the bottom of the valleys. In the case of UO2 oxidation, stress localisation would be achieved by the formation a patterned U3O7 layer, which minimises the mechanical energy by a reorganisation of crystalline structure rather than by surface deformation.
Thus the formation U3O7 domains with different crystalline orientations on a UO2 substrate should be understood as a consequence of the minimisation of mechanical energy. Domain formation is a known energy minimisation phenomenon, also for example in magnetism [29].
In the case of thin layer deposited on a substrate, stress localisation leads to periodical cracking of the sample at a critical depth because the stress level increases with increasing depth of the layer. In the case of UO2 oxidation we performedcalculations with several thickness of U3O7 layer in order to check the stress intensity as a function of U3O7 thickness. In .Figure 711 stress is shown as a function of the distance to the UO2/U3O7 interface. The maximal value of the stress increases as a function of the U3O7thickness.
.Figure 711 stress for several thickness of U3O7 layer.
The increase of traction stress with U3O7 layer depth justifies that this layer cracks when its thickness reaches a critical value. No exact value of the critical thickness can be derived from our calculation, because the numerical values we used are, for some them, crude approximations. The formation of cracks changes the mechanical state of the layer and would allow the formation of U3O8, as it is observed experimentally. Considering a martinsitic type formation of U3O8 on UO2 as proposed by Allen [13], these U3O8 crystallites should have a size smaller or equal to the one of the U3O7 grain, they were formed from.
The mechanism described here is consistent with all reported results on UO2 at temperature less than 400°C. It could also be applicable to a wider class of materials which are submitted to cracking during a chemical reaction, a phenomenon sometimes named chemical fragmentation [30].
Conclusion :
UO2 oxidation in air at temperature less that 400°C shares some common features with thin film deposited on substrate. The topotactic formation of U3O7 oxidised layer can indeed be compared to the epitaxial formation of a thin layer. In both case the mismatch in unit cell parameter between the layer and the substrate drives the mechanical evolution of the system. Because uranium oxide does not allow surface deformation, stress localisation, which minimises mechanical energy, is achieved because of the formation of domains of the metastable U3O7 phase. This original mechanism can explain the existence of a critical depth for crack formation and could be applied to materials subject to “chemical fragmentation”.
Acknowledgements:The authors would like to acknowledge the financial support from Electricité de France.
REFERENCES
[1] McEachern R.J. and Taylor P., J. Nucl. Mat. 254, (1998), 87-121
[2] K.K.Bae, B.G.Kim, Y.W.Lee, Yang, H.S.Park, J. Nucl. Mat. 209 (1994) 274-279 [3]P.A.Tempest, P.M.Tucker, J.W.Tyler, J. Nucl. Mat. 151 (1998) 251-268
[4] L. Quémard, L. Desgranges, V. Bouineau, M. Pijolat, G. Baldinozzi, N. Millot, J.C. Nièpce and A. Poulesquen, J. Eur. Ceram. Soc. 29 (2009)2791-2798
[5] L. Desgranges, F. Charollais, I. Felines, C. Ferry, J. Radwan, Scientific Basis for Nuclear Waste Management XXXII Meeting, MRS Proceeding, vol. 1124, 2008.
[6]J. Rouyer, A. Poulesquen, L. Desgranges, C. Ferry J. Nucl. Mat. (2009), doi:10.1016/j.jnucmat.2009.09.023
[7] Tong-Yi Zhang , Ming-Hao Zhao, Eng. Fracture Mech. 69 (2002) 589–596 [8]M.-H. Zhao, R. Fu, D. Lu, T.-Y. Zhang Acta Materialia 50 (2002) 4241–4254 [9]Tong-Yi Zhang *, Ming-Hao Zhao, Eng. Fracture Mech. 69 (2002) 589–596 [10] Thomas L.E., Einziger R.E. and Buchanan H.C., J. Nucl. Mater. 201 (1993) 310. [11] L. Desgranges, G. Baldinozzi, G. Rousseau, J.C. Niepce and G. Calvarin, Inorg Chem, 48 (2009) 7585–7592
[12] N. Creton, V. Optasanu, T. Montesin, S. Garruchet, L. Desgranges, Defect and Diffusion Forum, Vol. 289-292 (2009) pp. 447-454.
[13]Allen G.C., Holmes N.R. J. Nucl. Mat. 223 (1995) 231
[14]G. Rousseau, L. Desgranges, J. C. Niepce, G. Baldinozzi, J. Phys.IV France 2004 vol 118 pp 127-134
[15] P. Taylor, E.A. Burgess, SD.G. Owen J. Nucl. Mat. 88 (1980) 153
[16] O.Ulrich, J.S. Micha, X.Biquard, O.Robach, F. Rieutord, personal communication [17]N. Tamura, A.A. MacDowell, R. Spolenak, B.C. Valek, J.C. Bravman, W.L. Brown, R.S. Celestre, H.A. Padmore, B.W. Batterman and J.R. Patel, J. Synchrotron Radiat.10(2003), 137. [18] J.S. Micha, personal communication 2009.http://sourceforge.net/projects/lauetools/ [19]S. Garruchet, Ph. D. Thesis, Université de Bourgogne, France (2005).
[20]J. Favergeon, Ph. D. Thesis, Université de Bourgogne, France (2001).
[21] I. Salles-Desvignes, T. Montesin, C. Valot, J.Favergeon, G. Bertrand, A. Vadon, Acta Mater., 38 (2000) 1505-1515.
[22] F.C. Larché and J.W. Cahn, Acta Metall., 30 (1982) 1835-1845 [23] W. Breitung, J. Nucl. Mat. 74 (1978) 10-18.0
[24] M. Dodé, B. Touzelin, R.Chimie Minérale 9 (1972) 139-152
[25] V. Retel-Guicheret, F. Trivaudey, M.L. Boubakar, Ph. Thevenin, Nucl. Eng. And Design, 232 (2004) 249-262.
[26] H.R. Hoekstra, A. Santoro, S. Siegel, J. Inorg. Nucl. Chem. 18 (1961) 166 [27]R.J. ASaro, W.A. TillerMetall. Trans., 3 (1972) 1789
[28]M.A. Grinfeld', Sov. Phys. Dokl. 31 (11) (Nov. 1986) [29]Y. F. Ma, J. Y. Li Appl. Phys. Lett. 90 (2007)172504