HAL Id: cea-00307571
https://hal-cea.archives-ouvertes.fr/cea-00307571
Submitted on 29 Jul 2008
HAL is a multi-disciplinary open access
archive for the deposit and dissemination of
sci-entific research documents, whether they are
pub-lished or not. The documents may come from
teaching and research institutions in France or
abroad, or from public or private research centers.
L’archive ouverte pluridisciplinaire HAL, est
destinée au dépôt et à la diffusion de documents
scientifiques de niveau recherche, publiés ou non,
émanant des établissements d’enseignement et de
recherche français ou étrangers, des laboratoires
publics ou privés.
A pig multi-tissue normalised cDNA library: large-scale
sequencing, cluster analysis and 9K micro-array resource
generation.
Agnès Bonnet, Eddie Iannuccelli, Karine Hugot, Francis Benne, Maria F
Bonaldo, Marcelo B Soares, François Hatey, Gwenola Tosser-Klopp
To cite this version:
Agnès Bonnet, Eddie Iannuccelli, Karine Hugot, Francis Benne, Maria F Bonaldo, et al.. A pig
multi-tissue normalised cDNA library: large-scale sequencing, cluster analysis and 9K micro-array
resource generation.. BMC Genomics, BioMed Central, 2008, 9, pp.17. �10.1186/1471-2164-9-17�.
�cea-00307571�
BioMedCentral
Page 1 of 13
(page number not for citation purposes)
BMC Genomics
Open Access
Research article
A pig multi-tissue normalised cDNA library: large-scale sequencing,
cluster analysis and 9K micro-array resource generation
Agnès Bonnet
1, Eddie Iannuccelli
2, Karine Hugot
3,4, Francis Benne
1,
Maria F Bonaldo
5, Marcelo B Soares
5, François Hatey
1and Gwenola
Tosser-Klopp*
1Address: 1Laboratoire de Génétique Cellulaire, INRA, UMR444, Institut National de la Recherche Agronomique, F-31326 Castanet-Tolosan,
France, 2Sigenae, INRA, Institut National de la Recherche Agronomique, F-31326 Castanet-Tolosan, France, 3Laboratoire de Radiobiologie et
d'Etude du Génome, UMR314, INRA, CRB GADIE, Institut National de la Recherche Agronomique, F-78352 Jouy-en-Josas, France, 4Laboratoire
de Radiobiologie et d'Etude du Génome, CEA, DSV, IRCM, Commissariat à l'Energie Atomique, F-78352 Jouy-en-Josas, France and 5Children's
Memorial Research Center, Northwestern University's Feinberg School of Medicine, Chicago, IL, USA Email: Agnès Bonnet - [email protected]; Eddie Iannuccelli - [email protected]; Karine Hugot - [email protected]; Francis Benne - [email protected];
Maria F Bonaldo - [email protected]; Marcelo B Soares - [email protected]; François Hatey - [email protected]; Gwenola Tosser-Klopp* - [email protected] * Corresponding author
Abstract
Background: Domestic animal breeding and product quality improvement require the control of
reproduction, nutrition, health and welfare in these animals. It is thus necessary to improve our knowledge of the major physiological functions and their interactions. This would be greatly enhanced by the availability of expressed gene sequences in the databases and by cDNA arrays allowing the transcriptome analysis of any function.
The objective within the AGENAE French program was to initiate a high-throughput cDNA sequencing program of a 38-tissue normalised library and generate a diverse microarray for transcriptome analysis in pig species.
Results: We constructed a multi-tissue cDNA library, which was normalised and subtracted to
reduce the redundancy of the clones. Expressed Sequence Tags were produced and 24449 high-quality sequences were released in EMBL database. The assembly of all the public ESTs (available through SIGENAE website) resulted in 40786 contigs and 54653 singletons. At least one Agenae sequence is present in 11969 contigs (12.5%) and in 9291 of the deeper-than-one-contigs (22.8%). Sequence analysis showed that both normalisation and subtraction processes were successful and that the initial tissue complexity was maintained in the final libraries. A 9K nylon cDNA microarray was produced and is available through CRB-GADIE. It will allow high sensitivity transcriptome analyses in pigs.
Conclusion: In the present work, a pig multi-tissue cDNA library was constructed and a 9K cDNA
microarray designed. It contributes to the Expressed Sequence Tags pig data, and offers a valuable tool for transcriptome analysis.
Published: 14 January 2008
BMC Genomics 2008, 9:17 doi:10.1186/1471-2164-9-17
Received: 23 August 2007 Accepted: 14 January 2008 This article is available from: http://www.biomedcentral.com/1471-2164/9/17
© 2008 Bonnet et al; licensee BioMed Central Ltd.
This is an Open Access article distributed under the terms of the Creative Commons Attribution License (http://creativecommons.org/licenses/by/2.0), which permits unrestricted use, distribution, and reproduction in any medium, provided the original work is properly cited.
BMC Genomics 2008, 9:17 http://www.biomedcentral.com/1471-2164/9/17
Page 2 of 13
(page number not for citation purposes)
Background
In pigs, like in other domestic animals, breeding and product quality improvement require the control of sev-eral different traits (reproduction, nutrition, health and welfare). It is thus necessary to improve our knowledge of the major physiological functions and their interactions. For this purpose, the French National Institute for Agricul-tural Research (INRA) [1] has launched a genomic research program, AGENAE (Analyse du GENome des Animaux d'Elevage) [2] for the identification and the functional and genetic characterisation of a large number of genes in cattle, pigs, chicken and trout [3].
With the shift from map-based towards sequence-based gene discovery, the prevailing approach for creating tran-scription maps has become the generation of Expressed Sequence Tags [4]. In pigs, the first EST project [5] and first large-scale EST project were reported [6] about ten years ago. Subsequently, several research groups have generated ESTs from cDNA libraries constructed from either a single porcine tissue or a limited number of tissues related to a stage of development or a function, such as anterior pitu-itary [7,8], backfat [9], brain [10], liver [11], skeletal mus-cle [12-14], immune system tissues [15], reproductive tissues [8,16,17] and embryo [17-19]. The construction of full-length cDNA libraries was reported more recently [20-22].
To date, the construction of several pig arrays have been reported. Some of them, with various supports, contain 1 to 4000 cDNA from specific libraries: brain tissue[10] (GEO database accession number GPL336), muscle [23] (GPL518)[24] (GPL2731), embryo [25] (GPL1209), immune system cells [26,27] (GPL1624), but others aim at a generic analysis (10 to 20000 genes) of pig transcrip-tome with glass slides of in situ-synthesised oligonucle-otides (Affymetrix, GPL3533), spotted oligonucleoligonucle-otides (Operon-Qiagen set) (GPL 1881, GPL3461, GPL3707) or cDNAs (GPL3585, GPL3608).
We report here the construction of a pig multi-tissue cDNA library, its sequencing and analysis, and the gener-ation of a 9K nylon micro-array public tool for large scale expression profiling experiments.
Results and Discussion
cDNA libraries construction and characterisation
Starting from 38 tissues, six initial libraries containing 780 000 to 1800 000 recombinant clones were generated (Table 1). Their average insert size was 1.2 kb. The pooling and normalisation led to a 6.4 million-clone library and the sub-library of abundant clones contained 700000 clones. The average insert length of the normalised library was 1 kb and and the proportion of empty clones was low (2%).
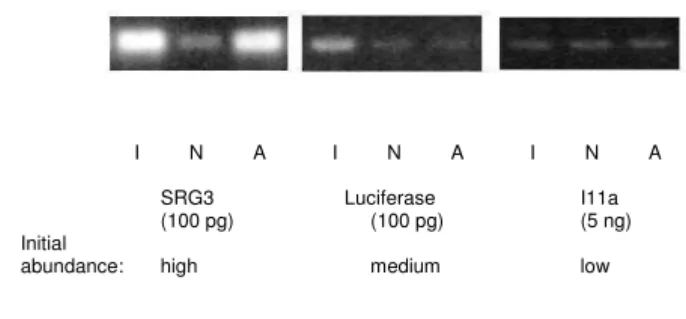
PCR amplification with specific primers for the external control genes SRG3, luciferase and I11a (abundant, medium and low-frequency) was used to check the nor-malisation process (Figure 1). Southern blot experiments demonstrated that the abundance of actin gene and of the abundant spike mRNA SRG3 have been greatly reduced by the normalisation process (data not shown). In addi-tion, quantitative PCR experiments (data not shown) demonstrated that the representation of SRG3 had been reduced 5800 times, the representation of luciferase reduced 4 times and the representation of I11a increased 1.5 times. In the normalised library, the representation of the external controls was estimated as follows: SRG3 = 0.0009%, luciferase = 0.0125%, I11a = 0.0008% as com-pared to the initial frequencies of 10%, 0.1% and 0.001% respectively.
After a first round of sequencing, the library was tracted with the 8736 already-sequenced clones. The sub-tracted library contained 60 000 clones. The quality of the subtraction was assessed by the sequencing of 384 clones (see below).
Sequencing
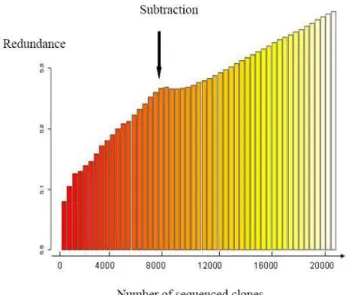
High-throughput sequencing was carried out on the nor-malised library. Sequencing was performed from both ends for 5664 clones. The sequencing effort was contin-ued from 5'-end only for the next 3072 clones. A total of 14400 sequences were generated from the multi-tissue normalised library and 11671 valid sequences (81.7%) were submitted to EMBL-EBI nucleotide database (Table 2, Additional file 1) [28]. PolyA was detected in 19.7% of the 5'-end sequences and 67.6% of the 3'-end sequences. Polyadenylation signal was detected in 59.6% of the polyA-containing sequences with 51.4% of AAUAAA sig-nal, which is consistent with previous estimations in humans [29]. The sequence of the medium-frequency external control (luciferase) was present 7 times (0.06%), which is higher than the estimated representation of the luciferase control (0.0125%) in the normalised library. The other two external control sequences were not detected (<0.0085%), which is consistent with the esti-mated frequencies of these 2 controls (0.0008 and 0.0009%). The proportion of fully-sequenced clones was 36.8% for both-ends sequenced clones and 12.9% for 5'-end sequenced clones. At this stage, the redundancy rate of the sequences had reached 25.5% (Figure 2). One con-tig, corresponding to 367 clones out of 8736 (4.2%) was obviously responsible for a high proportion of redun-dancy. It corresponded to a 28S RNA contamination, which was over-representated (10%) by 4 members of the 28S RNA contig in the driver, during subtraction of the normalised library.
BMC Genomics 2008, 9:17 http://www.biomedcentral.com/1471-2164/9/17
Page 3 of 13
(page number not for citation purposes) In the first 384-sequences from the subtracted library, the proportion of 28S RNA sequences had decreased towards 0.52% and 95.1% sequences were new, in comparison with the normalised library. The proportion of empty clones was still about 2%. A total of 14976 clones were then 5'-end sequenced and 12778 (85.3%) sequences were released in the EMBL-EBI nucleotide database (Table 2) [28]. Sequencing was then stopped: the redundancy had reached 39% (Figure 2). The EMBL accession num-bers are listed in supplemental data 1. PolyA was detected in 41.5% of the sequences. Polyadenylation signal was detected in 52.9% of the polyA-containing sequences. The sequence of the medium-frequency external control (luci-ferase) was present 5 times. The other two external control sequences were still not detected.
The library construction method (through the excess of oligo(dT) during the first reverse transcription) led to short polyA 3'-end stretches, allowing almost the same Control of the normalisation procedure
Figure 1
Control of the normalisation procedure. Normalisation
process efficiency was tested by using specific amplification of the control genes SRG3, Luciferase and I11a. Thirty cycles of amplification have been performed, using indicated amounts of plasmid DNA from the initial library (I), the normalised library (N), or the library of abundant clones (A). The fre-quency of the controls in the initial library is indicated.
I N A I N A I N A
SRG3 Luciferase I11a
(100 pg) (100 pg) (5 ng)
Initial
abundance: high medium low
Table 1: Description of the different libraries
N° library Tissues
Adult (A), young (Y) or fetal (F) animal
Number of recombinant clones
1-Brain Hippocampus (A) 800 000
Hypothalamus (A) Pituitary gland (A) Cerebral trunk (A) Brain (F)
2-Digestive function Stomach (A + F) 822 500
Small intestine (A + F) Large intestine (A + F) Gall-bladder (A)
3-Glands Adrenals (A) 800 000
Kidney (A) Liver (A + F) Thymus (A + Y) Spleen (A) Pancreas (A)
4-Heart and muscle Heart (A + F) 1 800 000
Muscle (A + F) Skin (A) Melanocytes (A) Adipose tissue (A)
5-Male reproductive organs Gonads (F) 780 000
Epididymis (A) Seminal vesicle (A) Bulbourethral gland (A) Testis (A)
6-Female reproductive organs Gonads (F) 1 325 000
Ovary (A + F) Uterus (A) Placenta
Mammary gland (A)
Normalized (N) Mix of libraries 1 to 6 6 400 000
Tissue samples from Meishan and Large White pigs at different stages of development or in different physiological conditions (fetus (F), young (Y) or adult animal (A), pregnant, stressed or control animals) were taken and 6 libraries were constructed.
BMC Genomics 2008, 9:17 http://www.biomedcentral.com/1471-2164/9/17
Page 4 of 13
(page number not for citation purposes) validity rate of the sequences either from 5' (82.2%) or 3'
(80.9%)-end. Thus, even if 3'-end sequencing is useful to distinguish genes in a closely related family as the 3'-end non coding regions are more divergent, the 5'-end sequencing strategy was favoured to provide better anno-tated clones.
Sequence assembly and analysis
Agenae contribution to public sequence data
Clustering of the 437,656 public pig sequences, including ours, resulted in 40,786 contigs and 54,653 singletons (psc3 clustering version [30]). Agenae sequences represent 4.9% of the published sequences. At least one Agenae sequence is present in 11,969 contigs (12.5%) and in 9,291 of the deeper-than-one-contigs (22.8%). The assembly shows that 3574 contigs are specific of the AGE-NAE library. A high proportion of these contigs are single-tons (75%), which is higher than the proportion of
singletons in the whole-data porcine assembly (52%). This observation and the absence of high-depth specific contigs are evidence of the good normalisation and sub-traction processes (Figure 3). Although Agenae sequences are a relatively small contribution to the international sequencing effort, they offered a very good tool to design cDNA microarrays, since they represented 22.8% of the deeper-than-one contigs. The cDNA clones are also a val-uable tool for gene expression studies.
The number of contigs highly depends on the parameters used when assembling the sequences. The TIGR pig clus-tering[31], with nearly the same amount of data, lead to 64,746 contigs and 88,274 singletons. Careful annotation of the contigs and the next completion of the pig genome sequence may show that paralogous genes are sometimes clustered and that, on the contrary, overlapping contigs may have been split up. UniGene clustering [32] lead to 32,711 contigs and 7,230 singletons. The low number of singletons in UniGene assembly is probably due to the fact UniGene does not use part of the available singletons, as was already noticed with trout data [3].
Quality of the libraries
The analysis of the twenty deepest contigs (Table 3) shows a high representation of ribosomal proteins, serum pro-teins, translation factor, that are often over-represented in cDNA libraries [33,34]. Eighteen of these twenty contigs are represented by at least one AGENAE EST. However, the average frequency of AGENAE ESTs for these 18 contigs is 0.5%, which is about ten times less than the frequency of AGENAE EST in the public databases (4.9%). This shows, again, that the normalisation and subtraction processes were efficient.
The analysis of the sequences obtained from the normal-ised library revealed a contamination by 28S ribosomal RNA This type of contamination has already been described in cDNA libraries [35]. This sequence has been over-represented in the subtraction driver and the analysis of the sequences from the subtracted library reveals the presence of 127 out of 14,976 28S ribosomal clones (0.85%). The proportion of this contamination has then been reduced by about 5.
Evolution of redundancy rate
Figure 2
Evolution of redundancy rate. Redundancy of the library
was calculated as follows: redundance = 1 - (number of genes/number of clones). The number of genes is estimated by the number of contigs obtained at the end of the SIGE-NAE processing chain.
Table 2: Number of sequenced and released ESTs from the two Agenae libraries
Libraries Normalised Subtracted Total
Number of sequenced clones 8736 14976 23712
Number of 5' sequences 8736 14976 23712
Number of 3' sequences 5664 0 5664
Number of sequences 14400 14976 29376
BMC Genomics 2008, 9:17 http://www.biomedcentral.com/1471-2164/9/17
Page 5 of 13
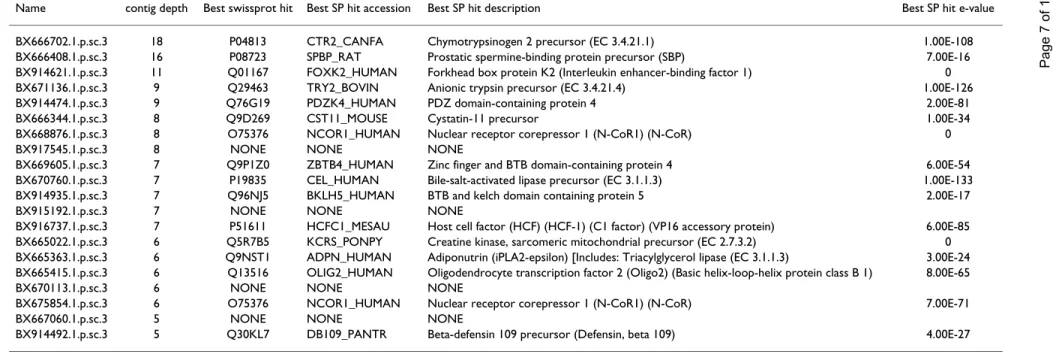
(page number not for citation purposes) The twenty deepest AGENAE-specific-contigs are listed in
Table 4. No hit is found with pig proteins. The best swiss-prot hit of 16 contigs are with either primates (human, or chimpanzee) rodent (mouse, rat) or other mammals (dog, bovine). Four contigs do not have any swissprot hit. As many tissues were mixed to construct the libraries, without tagging of the cDNAs, specific-tissue sequences were searched. The results are listed in Table 5. The TrainA protein, which is only expressed in epididymis is found [36]. So are GDF9, which is specific to ovary and over-expressed in oocytes [37] and specific mRNA for heart, pituitary gland, muscle or stomach, demonstrating that the multi-tissue library strategy was efficient to get low-redundancy information from a large set of tissues.
Microarray design and production
Design
Among the 95439 SIGENAE pig contigs, 8931 different contigs were chosen. For 7749 of them, at least one repre-senting clone belonged to the multi-tissue library and had an insert size compatible with PCR amplification (data not shown). Other contigs were either represented by a USDA clone (835) [17] or a subtractive suppression library clone (188) (Agnès Bonnet, personal communica-tion). Other clones come from different home-made libraries (159) and 285 controls were also included (78 empty controls, 12 empty-vector controls and 195 spikes).
Microarray quality control
The successive steps in the microarrays production have been checked for quality. Firstly, the rearraying of the 9216 selected clones or controls has been checked by sequencing 4 clones from each plate corner. A conformity
of 97.5% has been observed between the obtained and the expected sequences. The analysis of the results showed that the errors preexisted the rearraying. Using robots for clone handling and bare-codes for microplate tracking during the rearraying procedure allowed us to keep a low error rate. Secondly, the quality control of the PCR ampli-fication showed 6% empty wells and 0.3% double bands. The spots corresponding to the double bands samples were flagged and eliminated in the subsequent microarray data analysis. Finally, the microarrays were controlled by oligonucleotide hybridisation. One negative control was positioned at the end of each block to check the absence of cross-contamination during the spotting (Figure 4). The median signal of these negative spots was used to cal-culate the general background and was compared to the signal of each spot. A spot was stated as present if its signal was superior to a threshold of 3 times background signal. A microarray batch was validated if 95% of expected spots were present and 100% of negative control spots were absent. In a previous analysis (data not shown), we have observed that the membrane position in the robot has a slight effect on the spotting quality. Then, we systemati-cally proceeded to a hybridisation control on 2 extreme microarrays of each robot's tray. The microarrays batch was validated if all controlled micromembranes of this batch were validated. To date, about 1000 valid micro-membranes were produced.
This nylon array is a valuable tool for transcriptome anal-ysis. The use of radiolabelled complex probes allows to detect low-expressed mRNAs using small total RNA amounts (about 100 ng of total RNA) [38]. Such arrays have been used in several studies on human cancer [39] trout reproduction [40] and pig transcriptome [24], Rigaldie, E and Liaubet, L personal communications).
Microarray Gene Ontology
Gene Ontology annotation was performed through a blastx strategy, against Swissprot protein database. The recovery of a GO annotation was better for the pig generic microarray (70.6%) than for the all assembly contigs (34.4%). This can be explained by the poorer GO annota-tion of the 54653 singletons of the all assembly (21%), that were not chosen in the microarray design. The fre-quencies of the major GO categories were about the same for the generic array versus the all assembly: 32.6% (vs 33%) for biological process, 29.8% (vs 29.8%) for cellular component and 37.6% (vs 37.2%) for molecular func-tion. The frequencies of the subcategories were calculated and are displayed in Figure 5. Chi-square test, performed on the subcategory GO frequencies showed that the 9K-microarray was a good representation of the available pig public sequences. It can therefore be used without bias to undertake transcriptome analysis on any model or func-tion.
Histogram of contig depths
Figure 3
Histogram of contig depths. The proportion of
Agenae-specific contigs (purple squares) and public porcine contigs (blue squares) is represented in the different contig size classes. 0 10 20 30 40 50 60 70 80 1 2 3 4-9 10-27 28-81 82-243 >244 contig depth pe rc e n ta ge of c o nt igs All contigs AGENAE specific contigs
BMC G e n o mi cs 2 0 0 8 , 9: 1 7 h tt p :/ /w w w .b io m e d ce n tra l. co m/ 1 4 7 1 -2 1 6 4 /9 /1 7 Pa g e 6 o f 1 3 (p a g e n u mb e r n o t fo r ci ta ti o n p u rp o se s)
Table 3: 20 deepest contigs
Name contig depth %AGENAE EST
Best swissp rot hit
Best SP hit accession
Best SP hit description Best SP hit evalue
BM658630.1.p.sc.3 2448 0.1 P68363 TBAK_HUMAN Tubulin alpha-ubiquitous chain (Alpha-tubulin ubiquitous) (Tubulin K-alpha-1) 0
BM194705.1.p.sc.3 1945 0.1 P68105 EF1A1_RABIT Elongation factor 1-alpha 1 (EF-1-alpha-1) 0
BM658885.1.p.sc.3 1656 0.2 Q6QRN9 ADT3_PIG ADP/ATP translocase 3 (Adenine nucleotide translocator 2) (ANT 3) 1.00E-161
BM484007.1.p.sc.3 1533 0.1 Q5R536 AACT_PONPY Alpha-1-antichymotrypsin precursor (ACT) 1.00E-126
C94874.1.p.sc.3 1408 0.2 P48819 VTNC_PIG Vitronectin precursor (Serum spreading factor) (S-protein) 0
AJ275280.1.p.sc.3 1278 0.5 O46415 FRIL_BOVIN Ferritin light chain (Ferritin L subunit) 4.00E-86
BM658563.1.p.sc.3 1257 0.4 P63245 GBLP_RAT Guanine nucleotide-binding protein beta subunit 2-like 1 0
BM083203.1.p.sc.3 1246 0.8 P61288 TCTP_PIG Translationally-controlled tumor protein (TCTP) 5.00E-96
BQ598787.1.p.sc.3 1147 0.1 P63221 RS21_PIG 40S ribosomal protein S21 2.00E-41
BM658711.1.p.sc.3 1096 0.3 P05388 RLA0_HUMAN 60S acidic ribosomal protein P0 (L10E) 1.00E-145
BM190112.1.p.sc.3 1045 0.2 P08267 FRIH_CHICK Ferritin heavy chain (EC 1.16.3.1) (Ferritin H subunit) 4.00E-95
BM659089.1.p.sc.3 1035 0.2 P02672 FIBA_BOVIN Fibrinogen alpha chain [Contains: Fibrinopeptide A] (Fragment) 0
BM190048.1.p.sc.3 1021 2.4 P01965 HBA_PIG Hemoglobin alpha subunit (Hemoglobin alpha chain) (Alpha-globin) 4.00E-77
BM659181.1.p.sc.3 838 0.6 Q8SPS7 HPT_PIG Haptoglobin precursor [Contains: Haptoglobin alpha chain; Haptoglobin beta chain] 0
BM659099.1.p.sc.3 825 1.6 P08835 ALBU_PIG Serum albumin precursor 0
CF360997.1.p.sc.3 779 0.5 O46658 CP2DP_PIG Cytochrome P450 2D25 (EC 1.14.14.-) (CYPIID25) (Vitamin D(3) 25-hydroxylase) 0
BQ598755.1.p.sc.3 769 0.4 Q29387 EF1G_PIG Elongation factor 1-gamma (EF-1-gamma) (eEF-1B gamma) (Fragment) 0
CF359328.1.p.sc.3 711 0.8 Q8WNV7 DHRS4_PIG Dehydrogenase/reductase SDR family member 4 (EC 1.1.1.184) 1.00E-129
BQ598401.1.p.sc.3 672 0.0 P39872 RL3_BOVIN 60S ribosomal protein L3 0
BQ604206.1.p.sc.3 660 0.0 P01903 2DRA_HUMAN HLA class II histocompatibility antigen, DR alpha chain precursor 1.00E-103
The 20 deepest contigs from all public pig cDNA libraries were listed with their Sigenae contig name, depth, % of Agenae ESTs, Best Swissprot hit, hit accession, hit description and evalue, as annotated in the Sigenae web interface [30].
BMC G e n o mi cs 2 0 0 8 , 9: 1 7 h tt p :/ /w w w .b io m e d ce n tra l. co m/ 1 4 7 1 -2 1 6 4 /9 /1 7 Pa g e 7 o f 1 3 (p a g e n u mb e r n o t fo r ci ta ti o n p u rp o se s)
Table 5: tissue-specific contigs
Library number Tissue Best swissprot hit e-value Species Reference Clone Genbank accession number Sigenae contig name Contig depth 1 pituitary gland FSHB_PIG (P01228) 5.00E-78 Pig scan0030.f.01 BX916158 BQ597499.1.p.sc.3 26 2 stomach MUC5A_HUMAN (P98088) 0.00E+00 Human [46] scac0042.l.09 BX674468 BX674468.1.p.sc.3 3 3–4 muscle/liver MYOZ1_PIG (Q4PS85) 1.00E-132 Pig [47] scac0038.p.22 BX673406 CF179827.1.p.sc.3 23 4 heart DNJA4_HUMAN (Q8WW22) 0 Human [48] scan0007.c.04 BX919910 BM190198.1.p.sc.3 11 4 muscle/heart MYOZ2_PONPY (Q5R6I2) 1.00E-121 Orangutan [47] scac0043.l.05 BX676752 BM189987.1.p.sc.3 12 4 muscle CAV3_HUMAN (P56539) 1.00E-81 Human [49] scac0041.p.13 BX672700 BX672700.1.p.sc.3 5 5 epididymis RNAS1_RAT (P00684) 1.00E-08 rat [36] scan0009.m.06 BX919901 BX664890.1.p.sc.3 23 5 epididymis GPX5_PIG (O18994) 1.00E-129 Pig [50] scan0028.l.11 BX914773 BX914773.1.p.sc.3 6 6 ovary GDF9_SHEEP (O77681) 0 sheep [37] scac0039.l.15 BX675058 BX671944.1.p.sc.3 13 For each initial libray, at least one mammalian sequence of tissue-specific mRNAs (identified in the literature) was blasted against sigenae contigs. The Sigenae contig name with a significant blast e-value is in the table, with its depth and one Agenae clone and sequence.
Table 4: 20 deepest Agenae specific contigs
Name contig depth Best swissprot hit Best SP hit accession Best SP hit description Best SP hit e-value
BX666702.1.p.sc.3 18 P04813 CTR2_CANFA Chymotrypsinogen 2 precursor (EC 3.4.21.1) 1.00E-108 BX666408.1.p.sc.3 16 P08723 SPBP_RAT Prostatic spermine-binding protein precursor (SBP) 7.00E-16 BX914621.1.p.sc.3 11 Q01167 FOXK2_HUMAN Forkhead box protein K2 (Interleukin enhancer-binding factor 1) 0 BX671136.1.p.sc.3 9 Q29463 TRY2_BOVIN Anionic trypsin precursor (EC 3.4.21.4) 1.00E-126 BX914474.1.p.sc.3 9 Q76G19 PDZK4_HUMAN PDZ domain-containing protein 4 2.00E-81
BX666344.1.p.sc.3 8 Q9D269 CST11_MOUSE Cystatin-11 precursor 1.00E-34
BX668876.1.p.sc.3 8 O75376 NCOR1_HUMAN Nuclear receptor corepressor 1 (N-CoR1) (N-CoR) 0
BX917545.1.p.sc.3 8 NONE NONE NONE
BX669605.1.p.sc.3 7 Q9P1Z0 ZBTB4_HUMAN Zinc finger and BTB domain-containing protein 4 6.00E-54 BX670760.1.p.sc.3 7 P19835 CEL_HUMAN Bile-salt-activated lipase precursor (EC 3.1.1.3) 1.00E-133 BX914935.1.p.sc.3 7 Q96NJ5 BKLH5_HUMAN BTB and kelch domain containing protein 5 2.00E-17
BX915192.1.p.sc.3 7 NONE NONE NONE
BX916737.1.p.sc.3 7 P51611 HCFC1_MESAU Host cell factor (HCF) (HCF-1) (C1 factor) (VP16 accessory protein) 6.00E-85 BX665022.1.p.sc.3 6 Q5R7B5 KCRS_PONPY Creatine kinase, sarcomeric mitochondrial precursor (EC 2.7.3.2) 0 BX665363.1.p.sc.3 6 Q9NST1 ADPN_HUMAN Adiponutrin (iPLA2-epsilon) [Includes: Triacylglycerol lipase (EC 3.1.1.3) 3.00E-24 BX665415.1.p.sc.3 6 Q13516 OLIG2_HUMAN Oligodendrocyte transcription factor 2 (Oligo2) (Basic helix-loop-helix protein class B 1) 8.00E-65
BX670113.1.p.sc.3 6 NONE NONE NONE
BX675854.1.p.sc.3 6 O75376 NCOR1_HUMAN Nuclear receptor corepressor 1 (N-CoR1) (N-CoR) 7.00E-71
BX667060.1.p.sc.3 5 NONE NONE NONE
BX914492.1.p.sc.3 5 Q30KL7 DB109_PANTR Beta-defensin 109 precursor (Defensin, beta 109) 4.00E-27
The 20 deepest contigs containing only Agenae pig ESTs were listed with their Sigenae contig name, depth, Best Swissprot hit, hit accession, hit description and e-value, as annotated in the Sigenae web interface [30].
BMC Genomics 2008, 9:17 http://www.biomedcentral.com/1471-2164/9/17
Page 8 of 13
(page number not for citation purposes) We constructed a pig multi-tissue cDNA library which has
been successfully normalised and subtracted. This library is derived from the most diverse tissue representation to date. It provides a large set of clones, with limited redun-dancy but good representation of the complex set of ini-tial tissues. The 24,449 sequences allowed a precise characterisation of the library and contributed to interna-tional cDNA sequencing effort.
The 9K nylon cDNA microarray is now used in several gene expression profiling projects, in pig health, repro-duction and meat quality.
Methods
Tissue collection and RNA preparation
Research involving animal experimentation is approved and controlled by INRA (Institut National de la Recherche Agronomique) (authorisation B-35-275-32 and A37801). Animals were either reared at UE967 Génétique expéri-mentale en productions animales in Le Magneraud (France) and slaughtered at the Unité Mixte de Recherche SENAH in Saint Gilles (France) or reared and slaughtered at Unité Pluri-Espèces d'Expérimentation Animale in Tours-Nouzilly (France). Forty-four tissue samples from Meishan and Large White pigs at different stages of devel-opment or in different physiological conditions (foetus, young or adult animal, male or female, pregnant, stressed or control animals) were taken, frozen in liquid nitrogen and stored at -80°C until RNA extraction.
Total RNA was extracted, using the Chomczynski method [41] and controlled (integrity, reverse transcription effi-ciency) resulting in 38 high quality preparations.
These total RNA were pooled into 6 groups in equal pro-portions, according to biological functions (Table 1): brain, digestive function, glands, heart and muscle, male reproduction, female reproduction. PolyA+ mRNA was extracted from 300 µg of RNA from these pools.
As a control, 3 exogenous polyA+ mRNAs ("spikes") obtained by in vitro transcription of the corresponding cDNA sequences of SRG3 (A. thaliana, X98376), luciferase (P. pyralis, CVU03687) and I11a (A. thaliana, Y10291) were added to the polyA+ RNAs of each library in different amounts: 6.578 ng, 104.15 pg and 0.274 pg/µg pig RNA respectively. These concentrations correspond to the respective estimated frequencies of 0.5, 50 and 5000 cop-ies of mRNA per cell.
Library construction, normalisation and subtraction
The libraries were constructed, normalised and subtracted following the protocol of Soares [42] with minor modifi-cations. Briefly, 1 µg of polyA+ RNA (including the 3 spikes) from each pool was used and the reverse transcrip-tion with Superscript II (Invitrogen) was primed with 1 µg of NotI-Tag-dT18 primer (see Additional file 2), contain-ing the sequence AGCAG as a library tag. Second-strand synthesis was performed with T4 DNA polymerase (Biolabs) in the presence of DNA ligase (Biolabs) and RNase H (Amersham Pharmacia biotech). cDNA were size-selected (>500 bp), using a BioGel A 50 (BioRad) gel filtration, ligated to EcoRI adaptators primer (see Addi-tional file 2) (Amersham Pharmacia biotech) and digested with NotI. The purified cDNAs were directionally cloned into a pT3T7-pac vector and electroporated into DH10B E coli bacteria. The number of recombinant clones was determined, for each library, by dilution titration of Hybridisation of the generic 9K pig microarray with an oligonucleotide probe
Figure 4
Hybridisation of the generic 9K pig microarray with an oligonucleotide probe. The array is composed of 64 (16*4)
blocks of 144 (12*12) spots. At the four corners of each block, 3 external controls and a negative control (upper right corner) are spotted.
BMC Genomics 2008, 9:17 http://www.biomedcentral.com/1471-2164/9/17
Page 9 of 13
(page number not for citation purposes)
Gene Ontology annotation of the generic 9K pig microarray
Figure 5
Gene Ontology annotation of the generic 9K pig microarray. 5.1, 5.2 and 5.3 indicate the distribution of the annotated
BMC Genomics 2008, 9:17 http://www.biomedcentral.com/1471-2164/9/17
Page 10 of 13
(page number not for citation purposes) bacteria onto ampicillin plates. The whole six libraries
were pooled and the resulting library was normalised. The normalisation was achieved through the reassocia-tion of an excess of cDNA inserts, amplified by PCR, with single-stranded plasmid circles, obtained from the starting library (I) [42]. Single-stranded plasmids were generated
in vivo and purified by chromatography on
hydroxyapp-tite (HAP). One ng of the single-stranded library was used in a high-fidelity PCR (Qiagen Taq Polymerase, 250 UI, reference 201203) with T3 and T7 primers primer (see Additional file 2). 500 ng of PCR products were mixed with 50 ng of the single-stranded library and allowed to hybridise for 22 hours (Cot = 5). The remaining single-stranded circles were purified by HAP chromatography, converted into double-stranded plasmids with T7 seque-nase (USB, reference 707752), and electroporated into DH10B bacteria. This led to the normalised library (N) The bound double-stranded fraction was recovered from the HAP column and used to generate a mini-library (A) enriched for abundant mRNAs.
The rate of empty clones and the average size of the inserts were estimated by a PCR amplification of the inserts from 96 clones, by using primers (M13/24 and M13Raster, see Additional file 2) flanking the vector-cloning sites primer. The subtraction was achieved in a similar way using a Cot = 50: 50 ng of the single-stranded normalised library was reassociated with 2.5 µg of PCR products (primers M13/ 24 and M13Raster, see Additional file 2) generated from the 8736 sequenced clones of the normalised library. In order to eliminate one over-represented contig, 10% of these PCR products were generated from 4 clones chosen to represent the consensus sequence of this contig. The quality of the normalisation or subtraction was assessed using the external controls in southern blot and PCR experiments. For southern blot experiment, 500 ng of the I, A and N libraries were separated by electrophoresis on a 1% agarose gel and blotted onto a nylon membrane. The blot was hybridised with a labelled probe correspond-ing to the external controls. PCR experiments were done with specific primers for external controls (see Additional file 2): 30 cycles of amplification were performed, using different amounts of plasmid DNA from each library (A, I or N) as a template. The PCR products were analysed on 1% agarose gel. The sequencing of 96 to 384 randomly picked clones was also used to assess the quality of the normalisation or subtraction processes.
EST sequencing
The recombinant bacteria were plated onto 2YT/ampicil-lin plates and picked into 96 or 384-well plates using a BioPick (Génopole de Toulouse[43]) or a QPix
(CRB-GADIE [44]) robot and grown in 10% glycerol medium. Four copies of the plates were made and stored at -80°C. Control plates were generated by picking 2 or 8 (96 or 384-well plates) clones from each sequencing plate. They were also sequenced and used as a sequence-quality con-trol.
A total of 23712 clones were sequenced, following plas-mid DNA preparation, from either 5' or both ends by Mil-leGen® Biotechnologies [45] using M13 43) or M13R
(-47) primers (see Additional file 2) andBigDye V3.1 (Applied Biosystem) or ET terminator (Amersham) chem-istries.
Sequence analysis and clustering
The data files produced by MilleGen® Biotechnologies
were processed by SIGENAE and the documentation on the procedures is available on SIGENAE website [30]. Briefly, the sequences were cleaned up from vector and adaptator sequences; repeats and contaminants were removed by comparison with several sequence databases: Univec, Yeast and E. coli genomes as well as pig ribosomal and mitochondrial genomes. Exogenous control sequences were also removed. PolyA site was identified by its relative position to the vector multiple cloning site and 2 putative polyadenylation sites (AATAAA or ATTAAA) were searched within the 30 bases preceding the polyA site. Valid sequences, that is with a PHRED score over 20 on at least 100 bp, were submitted to the EMBL-EBI Nucleotide Sequence database [28]. All public pig sequences were clustered. Redundancy of the library was calculated as follows: redundancy = 1 - (number of genes/ number of clones). The number of genes is estimated by the number of contigs obtained at the end of the SIGENAE processing chain.
The identification and annotation retrieval of the 20 deep-est contigs of the assembly and of the 20 deepdeep-est AGENAE specific contigs was done by SQL requests on the SIGE-NAE database. For the deepest contigs, the sequences from Agenae libraries were counted.
Sequences corresponding to putative "tissue specific" pro-teins in the normalised or subtracted library were identi-fied using a best blast hit strategy for the approximation of ortholog pig genes. The tissue-specificity was documented by literature and the contig containing the nucleotide sequence of the gene referenced in the publication was searched through the SIGENAE WEB interface. If the pub-lication of the sequence was posterior to the SIGENAE assembly, a blastn of the sequence against public_pig_contigV3 database was performed and the contig with a 0 E-value considered. Then an AGENAE sequence was identified in the contig.
BMC Genomics 2008, 9:17 http://www.biomedcentral.com/1471-2164/9/17
Page 11 of 13
(page number not for citation purposes) Microarray design, production, quality control and Gene
Ontology analysis
Design
According to clone availability, the contigs represented by at least one Agenae or USDA clone were selected and the size of the insert was estimated for the different clones. The following descending order criteria were examined: - the size of the insert had to be between 0.7 and 1.5 kb-long
- priority was given to a Agenae clone
- priority was given to the longest-insert Agenae clone Other clones came from home-made libraries and chosen by INRA researchers.
Rearraying
The 9138 selected clones have been rearrayed from differ-ent libraries. The origin plates were replicated in 384 wells plates in a fresh version for a best result of the subsequent rearraying. These steps were conducted using a Q-Bot robot (Genetix, UK). The bacteria were grown overnight in 2YT (Yeast Tryptone) culture medium containing carbenicilin (100 µg/ml) and glycerol (8%).
To assess the quality of the different steps from sequenc-ing to rearraysequenc-ing, the 4 corners of all plates were control-led by sequencing (4 clones/corner); the obtained sequences were compared with the expected sequences.
Amplification
PCR amplifications were performed in 96-well microtiter plates using the u-pig-CRB and l-pig-CRB primers (see Additional file 2), which were specific of the polylinker sequence of vectors used (pCMVSPORT6 for USDA librar-ies and pT7T3D-pac, pbluescript, pCR 2.1-topo, pUC for INRA libraries). The reactions were performed by transfer-ring 4 µl of Escherichia coli in growth culture to 100 µl of PCR mix, containing 1.5 mM MgCl2, 1 M betaine, 100 µM dATP, dTTP, dGTP, and dCTP, 1× Promega buffer and 5 U of Taq polymerase (M1865, Promega, Madison, WI). All the steps were conducted by a RapidPlate liquid-handling machine (Caliper LifeSciences). The plates were incubated for 3 min at 94°C, before 35 cycles of 94°C for 30 s, 60°C for 30 s and 72°C for 120 s. Amplification products were not quantified, but their quality was systematically checked on 1% agarose gels.
Spotting
unpurified PCR products were evaporated, resuspended in 20 µl of distilled water, then transferred to 384-well microplates and spotted ontonylon membranes
(Hybond-N+; Amersham Biosciences, Saclay, France), using a Biorobotics MicroGrid-II arrayer (Genomics Solu-tion, Cambridge, U.K.) equipped with a 64-pins Biorobot-icsprinthead and 64 Biorobotics 100 µm solid pins. The spotted DNA was denaturated in 150 mM NaOH, 1.5 M NaCl, neutralised in 1 M Tris HCl (pH 7.5), 1.5 M NaCl. After rinsing micromembranes in 2× SSC, the DNA was fixed by successive heat (80°C during 2 hours) and UV (120000 µJ) treatments.
Quality control
to control the quality of the nylon microarrays, a vector probe hybridisation (5'-TCACACAGGAAACAGCTAT-GAC-3')was performed (as described in http://tagc.univ-mrs.fr/pub/Cancer/) on 8% of the micromembranes.
Gene Ontology analysis
The consensus sequence of all the contigs were blasted (blastx, e-value < 10-5) against SwissProt database (ver-sion 48). The Gene Ontology annotations were recovered from the best swissprot hit. The proportion of annotated contigs and the proportion of each GO term category was calculated for 2 data sets: 9K microarray contigs and all SIGENAE contigs. A chi-square test (p-value < 0.001) was performed to test if the microarray was enriched in partic-ular GO terms.
Authors' contributions
AB carried out the library construction, normalisation and subtraction. EI performed the sequence processing, assembly and the gene ontology annotation and assisted the array design. KH carried out the clone rearrangement, PCR amplification, array spotting and quality control. FB participated in the clone picking and arraying and gave technical assistance for the robotic management. MBS and MFB welcomed AB in their laboratory and helped her for the construction of the library. FH initiated the study and supervised the experiments. GTK performed the design of the library, the preliminary experiments for library con-struction, the sequence data analysis, the array design and wrote the manuscript. All authors read and approved the final manuscript.
Additional material
Additional file 1
Sequence accession numbers. The accession numbers of 24449 published sequences are listed.
Click here for file
[http://www.biomedcentral.com/content/supplementary/1471-2164-9-17-S1.doc]
BMC Genomics 2008, 9:17 http://www.biomedcentral.com/1471-2164/9/17
Page 12 of 13
(page number not for citation purposes)
Acknowledgements
We thank the colleagues who provided the different pig tissues and/or RNA extracts. We thank Laurent Mazzolini and Véronique Duranthon for providing external controls. We thank Philippe Mulsant for his help during Gwenola Tosser-Klopp's maternity leave, Sandrine Villeger and Cédric Cabau for technical help. We are grateful to Béatrice Loriod and her col-leagues from CIML for their help with microarray spotting technique. This work was part of the French National program AGENAE.
References
1. INRA [http://www.inra.fr/]
2. AGENAE [http://www.inra.fr/agenae/]
3. Govoroun M, Le Gac F, Guiguen Y: Generation of a large scale repertoire of Expressed Sequence Tags (ESTs) from normal-ised rainbow trout cDNA libraries. BMC Genomics 2006, 7:196. 4. Adams MD, Kelley JM, Gocayne JD, Dubnick M, Polymeropoulos MH, Xiao H, Merril CR, Wu A, Olde B, Moreno RF, et al.: Complemen-tary DNA sequencing: expressed sequence tags and human genome project. Science 1991, 252:1651-1656.
5. Tuggle CK, Schmitz CB: Cloning and characterization of pig muscle cDNAs by an expressed sequence tag approach. Anim
Biotechnol 1994, 5:1-13.
6. Wintero AK, Fredholm M, Davies W: Evaluation and characteri-zation of a porcine small intestine cDNA library: analysis of 839 clones. Mamm Genome 1996, 7:509-517.
7. Bertani GR, Johnson RK, Robic A, Pomp D: Mapping of porcine ESTs obtained from the anterior pituitary. Anim Genet 2003, 34:132-134.
8. Tuggle CK, Green JA, Fitzsimmons C, Woods R, Prather RS, Mal-chenko S, Soares BM, Kucaba T, Crouch K, Smith C, Tack D, Robin-son N, O'Leary B, Scheetz T, Casavant T, Pomp D, Edeal BJ, Zhang Y, Rothschild MF, Garwood K, Beavis W: EST-based gene discovery in pig: virtual expression patterns and comparative mapping to human. Mamm Genome 2003, 14:565-579.
9. Mikawa A, Suzuki H, Suzuki K, Toki D, Uenishi H, Awata T, Hamasima N: Characterization of 298 ESTs from porcine back fat tissue and their assignment to the SSRH radiation hybrid map.
Mamm Genome 2004, 15:315-322.
10. Nobis W, Ren X, Suchyta SP, Suchyta TR, Zanella AJ, Coussens PM: Development of a porcine brain cDNA library, EST data-base, and microarray resource. Physiol Genomics 2003, 16:153-159.
11. Ponsuksili S, Wimmers K, Schellander K: Application of differen-tial display RT-PCR to identify porcine liver ESTs. Gene 2001, 280:75-85.
12. Davoli R, Fontanesi L, Zambonelli P, Bigi D, Gellin J, Yerle M, Milc J, Braglia S, Cenci V, Cagnazzo M, Russo V: Isolation of porcine expressed sequence tags for the construction of a first genomic transcript map of the skeletal muscle in pig. Anim
Genet 2002, 33:3-18.
13. Davoli R, Zambonelli P, Bigi D, Fontanesi L, Russo V: Analysis of expressed sequence tags of porcine skeletal muscle. Gene 1999, 233:181-188.
14. Yao J, Coussens PM, Saama P, Suchyta S, Ernst CW: Generation of expressed sequence tags from a normalized porcine skeletal muscle cDNA library. Anim Biotechnol 2002, 13:211-222. 15. Rink A, Santschi EM, Beattie CW: Normalized cDNA libraries
from a porcine model of orthopedic implant-associated infection. Mamm Genome 2002, 13:198-205.
16. Caetano AR, Johnson RK, Pomp D: Generation and sequence characterization of a normalized cDNA library from swine ovarian follicles. Mamm Genome 2003, 14:65-70.
17. Fahrenkrug SC, Smith TP, Freking BA, Cho J, White J, Vallet J, Wise T, Rohrer G, Pertea G, Sultana R, Quackenbush J, Keele JW: Porcine gene discovery by normalized cDNA-library sequencing and EST cluster assembly. Mamm Genome 2002, 13:475-478. 18. Whitworth K, Springer GK, Forrester LJ, Spollen WG, Ries J,
Lamber-son WR, Bivens N, Murphy CN, Mathialagan N, Green JA, Prather RS: Developmental expression of 2489 gene clusters during pig embryogenesis: an expressed sequence tag project. Biol
Reprod 2004, 71:1230-1243.
19. Smith TP, Fahrenkrug SC, Rohrer GA, Simmen FA, Rexroad CE, Keele JW: Mapping of expressed sequence tags from a porcine early embryonic cDNA library. Anim Genet 2001, 32:66-72. 20. Fujisaki S, Sugiyama A, Eguchi T, Watanabe Y, Hiraiwa H, Honma D,
Saito T, Yasue H: Analysis of a full-length cDNA library con-structed from swine olfactory bulb for elucidation of expressed genes and their transcription initiation sites. J Vet
Med Sci 2004, 66:15-23.
21. Uenishi H, Eguchi T, Suzuki K, Sawazaki T, Toki D, Shinkai H, Oku-mura N, Hamasima N, Awata T: PEDE (Pig EST Data Explorer): construction of a database for ESTs derived from porcine full-length cDNA libraries. Nucleic Acids Res 2004, 32:D484-8. 22. Kim TH, Kim NS, Lim D, Lee KT, Oh JH, Park HS, Jang GW, Kim HY,
Jeon M, Choi BH, Lee HY, Chung HY, Kim H: Generation and anal-ysis of large-scale expressed sequence tags (ESTs) from a full-length enriched cDNA library of porcine backfat tissue.
BMC Genomics 2006, 7:36.
23. Cheon Y, Nara TY, Band MR, Beever JE, Wallig MA, Nakamura MT: Induction of overlapping genes by fasting and a peroxisome proliferator in pigs: evidence of functional PPARalpha in nonproliferating species. Am J Physiol Regul Integr Comp Physiol 2005, 288:R1525-35.
24. Ferré PJ, Liaubet L, Concordet D, SanCristobal M, Uro-Coste E, Tosser-Klopp G, Bonnet A, Toutain PL, Hatey F, Lefebvre P: Longi-tudinal analysis of gene expression in porcine skeletal muscle after post-injection local injury. Pharm Res 2006, 24(8):1480-1489.
25. Lee SH, Zhao SH, Recknor JC, Nettleton D, Orley S, Kang SK, Lee BC, Hwang WS, Tuggle CK: Transcriptional profiling using a novel cDNA array identifies differential gene expression dur-ing porcine embryo elongation. Mol Reprod Dev 2005, 71:129-139.
26. Dvorak CM, Hyland KA, Machado JG, Zhang Y, Fahrenkrug SC, Mur-taugh MP: Gene discovery and expression profiling in porcine Peyer's patch. Vet Immunol Immunopathol 2005, 105:301-315. 27. Machado JG, Hyland KA, Dvorak CM, Murtaugh MP: Gene
expres-sion profiling of jejunal Peyer's patches in juvenile and adult pigs. Mamm Genome 2005, 16:599-612.
28. EMBL-EBI [http://www.ebi.ac.uk/embl/]
29. Gautheret D, Poirot O, Lopez F, Audic S, Claverie JM: Alternate polyadenylation in human mRNAs: a large-scale analysis by EST clustering. Genome Res 1998, 8:524-530.
30. SIGENAE [http://www.sigenae.org/]
31. TIGR [http://compbio.dfci.harvard.edu/tgi/cgi-bin/tgi/ gimain.pl?gudb=pig]
32. UniGene [http://www.ncbi.nlm.nih.gov/UniGene/ UGOrg.cgi?TAXID=9823]
33. Mu X, Zhao S, Pershad R, Hsieh TF, Scarpa A, Wang SW, White RA, Beremand PD, Thomas TL, Gan L, Klein WH: Gene expression in the developing mouse retina by EST sequencing and micro-array analysis. Nucleic Acids Res 2001, 29:4983-4993.
34. Yu J, Farjo R, MacNee SP, Baehr W, Stambolian DE, Swaroop A: Annotation and analysis of 10,000 expressed sequence tags from developing mouse eye and adult retina. Genome Biol 2003, 4:R65.
35. Gonzalez IL, Sylvester JE: Incognito rRNA and rDNA in data-bases and libraries. Genome Res 1997, 7:65-70.
36. Castella S, Fouchecourt S, Teixeira-Gomes AP, Vinh J, Belghazi M, Dacheux F, Dacheux JL: Identification of a member of a new RNase a family specifically secreted by epididymal caput epi-thelium. Biol Reprod 2004, 70:319-328.
37. Prochazka R, Nemcova L, Nagyova E, Kanka J: Expression of growth differentiation factor 9 messenger RNA in porcine growing and preovulatory ovarian follicles. Biol Reprod 2004, 71:1290-1295.
Additional file 2
Primer sequences. The name and the sequence of the primers are listed.
Click here for file
[http://www.biomedcentral.com/content/supplementary/1471-2164-9-17-S2.doc]
Publish with BioMed Central and every scientist can read your work free of charge "BioMed Central will be the most significant development for disseminating the results of biomedical researc h in our lifetime."
Sir Paul Nurse, Cancer Research UK
Your research papers will be:
available free of charge to the entire biomedical community peer reviewed and published immediately upon acceptance cited in PubMed and archived on PubMed Central yours — you keep the copyright
Submit your manuscript here:
http://www.biomedcentral.com/info/publishing_adv.asp
BioMedcentral
BMC Genomics 2008, 9:17 http://www.biomedcentral.com/1471-2164/9/17
Page 13 of 13
(page number not for citation purposes)
38. Bertucci F, Loriod B, Tagett R, Granjeaud S, Birnbaum D, Nguyen C, Houlgatte R: [DNA arrays: technological aspects and applica-tions.]. Bull Cancer 2001, 88:243-252.
39. Talby L, Chambost H, Roubaud MC, N'Guyen C, Milili M, Loriod B, Fossat C, Picard C, Gabert J, Chiappetta P, Michel G, Schiff C: The chemosensitivity to therapy of childhood early B acute lym-phoblastic leukemia could be determined by the combined expression of CD34, SPI-B and BCR genes. Leuk Res 2006, 30:665-676.
40. Bobe J, Montfort J, Nguyen T, Fostier A: Identification of new par-ticipants in the rainbow trout (Oncorhynchus mykiss) oocyte maturation and ovulation processes using cDNA microarrays. Reprod Biol Endocrinol 2006, 4:39.
41. Chomczynski P, Sacchi N: Single-step method of RNA isolation by acid guanidinium thiocyanate-phenol-chloroform extrac-tion. Anal Biochem 1987, 162:156-159.
42. Bonaldo MF, Lennon G, Soares MB: Normalization and subtrac-tion: two approaches to facilitate gene discovery. Genome Res 1996, 6:791-806.
43. Genopole de Toulouse Midi-Pyrénées [http://genopole-tou louse.prd.fr/index.php]
44. CRB-GADIE [http://www-crb.jouy.inra.fr/BRC/index.html] 45. Millegen [http://www.millegen.com/]
46. Turner BS, Bhaskar KR, Hadzopoulou-Cladaras M, LaMont JT: Cysteine-rich regions of pig gastric mucin contain von wille-brand factor and cystine knot domains at the carboxyl termi-nal(1). Biochim Biophys Acta 1999, 1447:77-92.
47. Wang H, Zhu Z, Yang S, Mo D, Li K: Characterization of different expression patterns of calsarcin-1 and calsarcin-2 in porcine muscle. Gene 2006, 374:104-111.
48. Depre C, Wang L, Tomlinson JE, Gaussin V, Abdellatif M, Topper JN, Vatner SF: Characterization of pDJA1, a cardiac-specific chap-erone found by genomic profiling of the post-ischemic swine heart. Cardiovasc Res 2003, 58:126-135.
49. Zhu Z, Li Y, Mo D, Li K, Zhao S: Molecular characterization and expression analysis of the porcine caveolin-3 gene. Biochem
Biophys Res Commun 2006, 346:7-13.
50. Okamura N, Iwaki Y, Hiramoto S, Tamba M, Bannai S, Sugita Y, Syntin P, Dacheux F, Dacheux JL: Molecular cloning and characteriza-tion of the epididymis-specific glutathione peroxidase-like protein secreted in the porcine epididymal fluid. Biochim