HAL Id: hal-02928148
https://hal.archives-ouvertes.fr/hal-02928148
Submitted on 6 Jan 2021
HAL is a multi-disciplinary open access
archive for the deposit and dissemination of
sci-entific research documents, whether they are
pub-lished or not. The documents may come from
teaching and research institutions in France or
abroad, or from public or private research centers.
L’archive ouverte pluridisciplinaire HAL, est
destinée au dépôt et à la diffusion de documents
scientifiques de niveau recherche, publiés ou non,
émanant des établissements d’enseignement et de
recherche français ou étrangers, des laboratoires
publics ou privés.
Functional organization of the endomembrane network
in the digestive gland of the Venus flytrap: revisiting an
old story with a new microscopy toolbox
Claire Boulogne, Cynthia Gillet, L. Hughes, Romain Le Bars, A. Canette, C.
R. Hawes, Béatrice Satiat-Jeunemaitre
To cite this version:
Claire Boulogne, Cynthia Gillet, L. Hughes, Romain Le Bars, A. Canette, et al.. Functional
organiza-tion of the endomembrane network in the digestive gland of the Venus flytrap: revisiting an old story
with a new microscopy toolbox. Journal of Microscopy, 2020, 280, pp.86 - 103. �10.1111/jmi.12957�.
�hal-02928148�
Functional organisation of the endomembrane network in the
digestive gland of the Venus flytrap: revisiting an old story with a
new microscopy toolbox
C . B O U L O G N E∗, C . G I L L E T∗, L . H U G H E S †, ‡, R . L E B A R S∗, A . C A N E T T E §, C . R . H AW E S † & B . S AT I AT - J E U N E M A I T R E∗
∗Université Paris-Saclay, CEA, CNRS, Institute for Integrative Biology of the Cell (I2BC), Gif -sur-Yvette, France
†Oxford Brookes University, Oxford UK, England
‡Oxford Instruments NanoAnalysis, High Wycombe, Bucks, UK
§CNRS, Institut de Biologie Paris-Seine (IBPS), Sorbonne Université, Paris, France
Key words. Array tomography, carnivorous plants, endomembranes,
scanning electron microscopy, serial block face, serial sections, tomography, transmission electron microscopy.
Summary
Up-to-date imaging approaches were used to address the spa-tiotemporal organisation of the endomembrane system in se-cretory cells of Dionaea muscipula. Different ‘slice and view’ methodologies were performed on resin-embedded samples to finally achieve a 3D reconstruction of the cell architecture, using ultrastructural tomography, array tomography, serial block face-scanning electron microscopy (SBF-SEM), correla-tion, and volume rendering at the light microscopy level. Ob-servations of cryo-fixed samples by high-pressure freezing re-vealed changes of the endomembrane system that occur after trap activation and prey digestion. They provide evidence for an original strategy that adapts the secretory machinery to a
In Memoriam of Chris Hawes : Even more impressive than the amount of electron
mi-crographs that Chris published over the years is the number of unpublished mimi-crographs that he kept nicely ordered in his filing cabinet. Among them were preliminary studies de-scribing the endomembrane system of Dioneae muscipula, dating from the time when Chris was working at the Plant Science University in Oxford, in partnership with Barry Juniper in the 1980s. He was very keen to apply the ZIO impregnation protocol to various botanical samples in order to make observations by High Voltage Transmission Electron Microscopy (HVTEM) (Hawes, 1981). Two plates describing the endomembrane system of Dionaea were published at the time (Juniper et al., 1982). Many years later, these very same pic-tures served as the basis for many animated discussions in Chris’s office on the complexity of the plant endomembrane system. Thus, when the era of 3D SEM arrived, Chris was very proud to bring out his 35-year-old resin blocks, as the ZIO-induced contrast was perfect for the SBF-SEM approach. This paper proposes to resume the work developed in our two laboratories based on the biology of Dionaea, and to act as a way to acknowledge Chris’s enthusiasm for plant wonders, plant endomembrane complexity, and his love for electron microscopy.
Correspondence to: B. Satiat-Jeunemaitre, Université Paris-Saclay, CEA, CNRS, In-stitute for Integrative Biology of the Cell (I2BC), 91198 Gif -sur-Yvette, France. Tel: 00 33 1 69 82 46 60; e-mail: bsj@i2bc.paris-saclay.fr
specific and unique case of stimulated exocytosis in plant cells. A first secretion peak is part of a rapid response to deliver diges-tive fluids to the cell surface, which delivers the needed stock of digestive materials ‘on site’. The second peak of activity could then be associated with the reconstruction of the Golgi ap-paratus (GA), endoplasmic reticulum (ER) and vacuolar ma-chinery, in order to prepare for a subsequent round of prey capture. Tubular continuum between ER and Golgi stacks ob-served on ZIO-impregnated tissues may correspond to an effi-cient transfer mechanism for lipids and/or proteins, especially for use in rapidly resetting the molecular GA machinery. The occurrence of one vacuolar continuum may permit continu-ous adjustment of cell homeostasy. The subcellular features of the secretory cells of Dionaea muscipula outline key innova-tions in the organisation of plant cell compartmentalisation that are used to cope with specific cell needs such as the full use of the GA as a protein factory, and the ability to create pro-tein reservoirs in the periplasmic space. Shape-derived forces of the pleiomorphic vacuole may act as signals to accompany the sorting and entering flows of the cell.
Introduction
The fascination for carnivorous plants has produced many writings, both in fiction and scientific literature. Indeed, the variety in form and physiological behaviour of these plants is remarkable enough to stimulate the imagination, as well as endless observations at the macroscopic and microscopic levels. For the cell biologist, the secretory machinery of carni-vorous plants is an amazing experimental model to work on, as this is one of the rare plant examples in which secretion of high levels of proteins may be triggered by prey capture.
S E C R E T O RY PAT H WAYS I N C A R N I VO RO U S P L A N T S 8 7
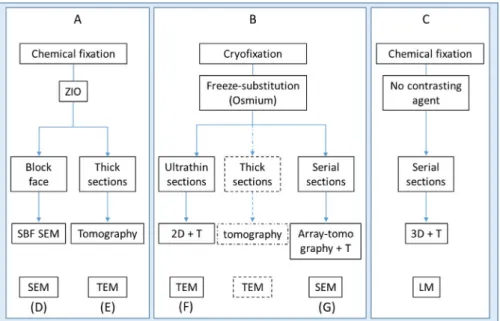
Fig. 1. Flowchart of the microscopy approaches developed to explore Dionaea secretory cell architecture. Boxes (A)–(C) represent distinct embedding
pro-tocols. (D), (E), (G) Distinct ‘slice and view’ approaches for 3D-EM reconstruction (respectively SBF-SEM (D), TEM tomography (E) and array tomography-SEM (G)). (F) 2D+ T = 2D study comparing three stages of the digestive cycle over time (T). Broken lines: see complementary protocol for TEM-tomography in Gergely et al. (2018).
Research on carnivorous plants has called upon a large tradition of microscopy and biochemical approaches over the last century, as recalled in Barry Juniper’s magnificent book,
The Carnivorous Plants (Juniper et al., 1989). More recently,
carnivorous plant research has benefited from the sequencing of various other species (Fukushima et al., 2017). However, correlations between potential molecular machineries, bio-chemical data, and ultrastructural features are still missing.
How do the secretory cells of carnivorous plants reconcile their ‘predator’ functions and their plant needs? How do they coordinate the production and secretion of huge amounts of digestive enzymes, along with the secretion of polysaccharides and digestive fluids? Tentative answers to such questions must be supported by solid observations of the cell architecture. Transmission electron microscopy (TEM) studies have always been a driving force in suggesting various (sometimes debat-able) scenarios for secretion models in the secretory cells of carnivorous plants (Juniper et al., 1989). In light of today’s knowledge, it is possible that those controversial analyses may have their sources in the observations of potential artefacts caused by specific TEM sample preparation (both from fixa-tion and the generafixa-tion of contrast). More importantly, the lack of spatial information provided by 2D data should also be considered as a missing link in the understanding of cell architecture.
The aim of this paper was to use a combination of up-to-date imaging approaches in order to address the spatiotem-poral organisation of the endomembrane system in secretory cells (see the flow chart in Fig. 1). Different ‘slice and view’ methodologies were performed on resin-embedded samples to
finally achieve a 3D reconstruction of the cell architecture, using ultrastructural tomography, array tomography, serial block face-scanning electron microscopy (SBF-SEM), correla-tion and volume rendering at the light microscopy level.
The biological model that we used to investigate the nature of the secretory cascades in glandular cells is Dionaea
musci-pula Ellis, better known as the Venus flytrap. Its first botanical
description was made by the naturalist John Ellis in the early eighteenth century in a letter to his colleague Linnaeus, which described the amazing sensitivity and characteristic traits of these plants. Darwin was however the first to initiate rigorous experiments on the trapping mechanisms and di-gestion processes, reported in his famous book, Insectivorous
Plants (Darwin, 1875). The prey capture process developed by Dionaea muscipula is based on a snap trap mechanism, and the
mechanism and physiology of this spectacular process are still being investigated (Volkov et al., 2009). The trap is composed of two lobes that function as a jaw to capture and digest prey. Marginal spikes extend from the margin of the trap lobes. In the resting stage, the trap is open (Fig. 2A). The inner surface of the trap is visible, covered by at least two types of secretory glands occupying distinct territories (Fig. 2A). The alluring glands at the margin of the trap secrete a mixture of carbohydrates to attract the prey, while pigmented digestive glands cover most of the inner surface of the trap (Juniper
et al., 1989). When prey make contact with one lobe, they
are detected via the stimulation of three hairs in the centre of each lobe of the trap (Fig. 2A, arrow), provoking a rapid closing movement of the two lobes at the mid-rib. Prey are thus trapped in a cage-like structure that ultimately crushes
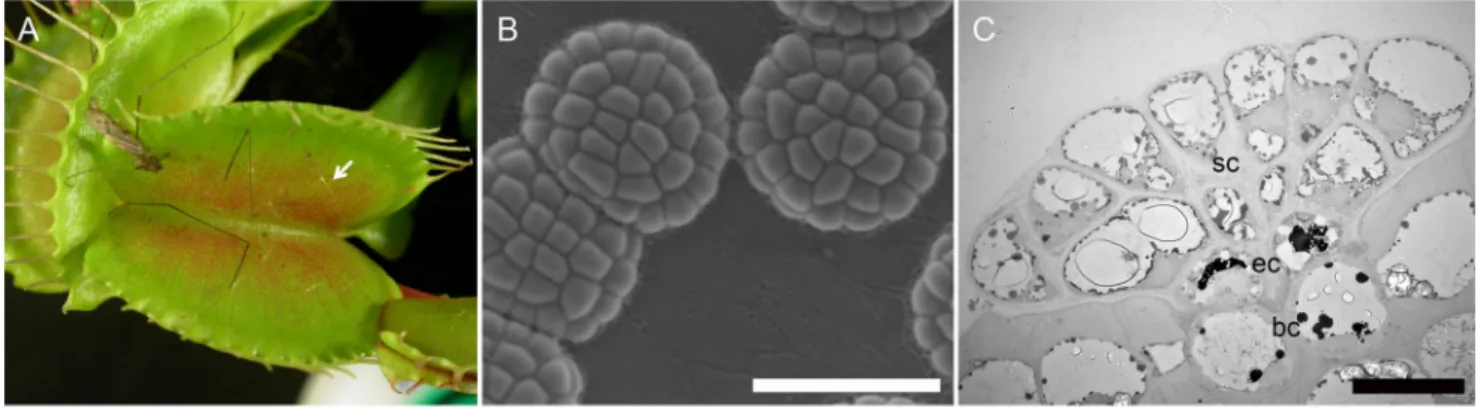
Fig. 2. Main features of the Dionaea muscipula snap trap and secretory gland. (A) An open trap of Dionaea muscipula. The red pigmented area corresponds
to hundreds of digestive glands. Note the hairs (arrow) acting as prey sensors to induce trap closure. (B) SEM micrograph showing the digestive glands in control of enzyme secretion when a prey has been captured. (C) TEM micrograph of a longitudinal section in a digestive gland (sc: secretory cells; ec: endodermoid cells; bc: basal cells). Scale bar in (B): 100µm; scale bar in (C): 20 µm.
them when the two lobes close in a slow movement (Darwin, 1875). The secretion of enzymes is stimulated by the closure of the trap and the detection of nitrogenous compounds from the prey (Scala et al., 1969; Robins, 1976; Juniper et al., 1989). Prey digestion begins with the delivery of digestive enzymes from the hundreds of digestive glands in contact with the prey. After the immediate capture of the prey, the trap remains closed for 4–5 days before opening again to start a new cycle (Davis et al., 2019). The description of the prey ‘di-gestive cycle’ established in the early 1980s (Robins & Juniper, 1980a,1980b,1980c,1980d) remains a solid foundation for today’s research. Dionaea secretory glands break down particles of nutrients from its prey, providing minerals and nitrogen supplies for the plant’s requirements. This process has been related to specific enzymes detected in the Dionaea ‘digestive fluid’ in the 1970s (Scala et al., 1969; Robins, 1976; Lichtner & Williams, 1977). However, the intracellular local-isation of the digestive enzymes in gland cells and the events associated with their discharge at the cell surface are still ma-jor questions in the field. The fine structure of the secretory cells of Dionaea digestive glands was observed by transmission electron microscopy (TEM) during the last decades of the 20th century (Scala et al., 1968; Schwab et al., 1969; Robins & Juniper, 1980a,1980b,1980c,1980d; Juniper et al., 1982). In accordance with the membrane flow concept proposed by Morré (James Morré et al., 1979), it was accepted that secre-tion is based on exocytotic processes from the endoplasmic reticulum (ER) to the cell surface. Several hypotheses, con-troversial at the time, have been raised to attribute functional roles to the ER, Golgi apparatus (GA) or vacuoles in carnivo-rous plant biology (Bal & Payne, 1972; Unzelman & Healey, 1974; Juniper et al., 1989). All of these previous studies were based on chemical fixation, and used various cytochemistry protocols to give contrast to the biological samples.
However, the preference for cryofixation methods over chemical fixation has been emphasised in the last 30 years
in order to obtain a better preservation of plant mem-branes and fewer ultrastructural artefacts in plant cells (Kiss et al., 1990; Samuels et al., 1995; Seguí-Simarro
et al., 2004) including Dionaea muscipula (Gergely et al.,
2018). In addition, the development of methods to re-construct a volume from 2D images (Hughes et al., 2014; Borrett & Hughes, 2016; Kittelmann et al., 2016) has been essential to revisiting or improving working hy-potheses on cell functional organisation and may therefore be a good tool to explore cell architecture of carnivorous plants. Finally, the development of 3D reconstruction by light microscopy approaches based on fluorescent properties (Plachno et al., 2006) may also provide new information regarding the cell organisation.
Here, we used Dionaea muscipula as an inducible system to monitor the changes of the endomembrane system that occur after trap activation and prey digestion. Our results provide evidence for an original strategy that adapts the secretory ma-chinery to a specific and unique case of stimulated exocytosis in plant cells.
Material and methods
Plant material and culture conditions
Dionaea muscipula plants were purchased from
commer-cial suppliers. Plants were maintained in green house conditions in a mixture of 2/3 acid peat (pH 4 ± 0.5, see: https://www.puteaux-sa.fr/terreau-potager-tourbe-naturelle-flora-150lt.html) and 1/3 sand (pH 7), and were watered with distilled water.
Induction of secretion
Traps were stimulated with blocks of 2% aqueous gelatin (Sigma G-2500) mimicking the presence of a prey (Schwab
S E C R E T O RY PAT H WAYS I N C A R N I VO RO U S P L A N T S 8 9
et al., 1969) {Schwab, 1969 #120}.Traps were then removed,
dissected in small pieces in the glandular area and fixed for electron microscopy studies just before stimulation (Day 0), and 1, 2, 3 and 5 days after stimulation.
Microscopy
The flow chart presented in Figure 1 summarises the main work flows developed in this study.
Chemical fixation, ZIO impregnation and epoxy resin embedding for TEM and SEM (Fig. 1, Box A). Thin strips of glandu-lar leaves were cut under glutaraldehyde/paraformaldehyde fixative and impregnated by the zinc/iodine/osmium (ZIO) en
bloc staining protocol as described (Hawes et al., 1981;
Ju-niper et al., 1982). For TEM tomography, 120-nm thick sec-tions were collected on Formvar-coated copper grids.
SBF-SEM (Fig. 1, Box A, column D). The final trimmed blocks were mounted onto 3View stubs (Gatan), and sputter-coated (Agar Scientific sputter coater) with gold for 30 s (thick-ness layer∼20 nm) in order to improve conductivity. SBF-SEM images were collected on a Merlin Compact scanning elec-tron microscope (Zeiss) with the Gatan 3View system. Sec-tion thickness was set to 40–100 nm, depending on the mag-nification used, and the block face was imaged in variable pressure mode (∼50 Pa) at 4 kV acceleration voltage with an aperture size of 30 µm and a pixel dwell time of 2–5 µs. Data processing (stack formation, image alignment, and trim-ming and scaling of sections to a common mean and SD) was performed using the IMOD software package (Kremer et al., 1996). The Amira software (Thermo) brush tool was used to select the regions of interest around the Golgi and ER, and the VolRen function was applied and thresholded to show max-imum intensity 3D views of Golgi bodies and ER (Borrett & Hughes, 2016; Gergely et al., 2018).
Cryofixation by high-pressure freezing and freeze-substitution for TEM and SEM studies (Fig. 1, Box B). Three mm2trap
fragments were immersed in the cryoprotectant hexadecene. One mm diameter discs were made using a punch and quickly placed in metal dishes (Leica ‘flat specimen carriers’, 400 µm depth, ref. 16706899). Samples were cryofixed in liquid nitrogen by high-pressure freezing with EMPACT2 (Leica). The cryofixed material was then stored in liquid nitrogen until freeze-substitution.
Freeze-substitution (FS) was performed in the AFS2 appa-ratus (Leica). Frozen specimens were kept at –90°C in an FS medium of 2% osmium in anhydrous acetone. The tempera-ture was increased as follows: 24 h at –90°C, 15 h from –90°C to –60°C, 8 h at –60°C, 15 h from –60°C to –30°C and 8 h at –30°C. Specimens were then transferred on ice and washed three times in acetone. They were then processed for epoxy
resin (LV premix Medium R1165, Agar Scientific, Oxford Instruments) embedding (Hawes & Satiat-Jeunemaitre, 2001; Marion et al., 2017).
Chemical fixation and LR White embedding for light microscopy (Fig. 1, Box C).
Tissue preparation for histology by light microscopy. Leaf pieces
were cut and fixed 4–6 h at room temperature with 3% paraformaldehyde and 0.5% glutaraldehyde in 0.1 M cacody-late buffer at pH 6.8. After washing with 0.1 M cacodycacody-late buffer, samples were progressively dehydrated at 4°C in 10%–50% ethanol baths (10%–20%–30%–50%) and then at –20°C in 70%–100% ethanol baths (70%–90%–100%). To achieve complete dehydration, samples were finally kept in absolute ethanol before embedding in acrylic resin (LR White Resin, Agar Scientific, Oxford Instruments) (Hawes & Satiat-Jeunemaitre, 2001).
Sectioning and staining for LM. Embedded trap fragments were
cut on an EM UC6 ultramicrotome (Leica Microsystems) with a JUMBO diamond (Diatome), as its large boat facilitates production of section ribbons with no loss or folding. Two hundred and fifty-nanometre sections were directly collected on glass coverslips and stained at RT in DAPI (0.5 mg mL–1)
and propidium iodide (PI) (0.5 mg mL–1) solution during 15
min before washing three times with water. After removing excess water, coverslips were mounted on slides with Citi-fluor AF1 (EMS) and sealed with nail polish. Samples were immediately imaged after staining.
Light microscopy imaging and image analysis. Image
acqui-sitions were performed either on a widefield microscope (DMI6000 B, Leica) equipped with a CCD camera (CoolSNAP HQ2, Photometrics) or on a confocal microscope (SP8-X, Le-ica) equipped with hybrid detectors. First, a map of the ribbon was established using a 10× objective (Plan Apo, NA: 0.4, Leica) to identify and mark the glands on every leaf section. Then, using a 63× oil immersion objective (Plan Apo, NA: 1.4, Leica), z-stacks (z step: 300 nm) were automatically created for each gland section. Each stack was acquired sequentially on two channels to collect the fluorescence of both propidium iodide (excitation: 555 nm, detection: 565–700 nm) and DAPI (excitation: 405 nm, detection: 450–500 nm). Each stack was then processed with automated scripts in ImageJ (Schneider et al., 2012). Briefly, stacks were first projected as a maximal intensity projection, and all resulting projections were concatenated to produce one 3D stack for each gland. Then the stacks were realigned using the StackReg plugin (Thevenaz et al., 1998) and corrected for plane-to-plane intensity variations. To perform the segmentation of cell walls and vacuoles, the Ilastik machine learning software was used (Berg et al., 2019) to produce binary masks. To avoid
any segmentation error on the cell wall masks (which can lead to unwanted fusing events), quality control and manual correction steps were essential. Finally, in order to attribute each vacuole to a cell and generate volume rendering, we imported the masks into Imaris (Bitplane). All data presented were extracted cell by cell and analysed in Prism (GraphPad).
TEM (Fig. 1, Box B, column F). Ultrathin (80 nm) or thick (150 nm) sections were cut with an EM UC6 ultramicrotome (Leica Microsystems) and collected on Formvar carbon-coated copper grids. Ultrathin sections were stained with 2% uranyl acetate (Merck) and Reynolds lead citrate (Agar) according to standard procedures (Hawes & Satiat-Jeunemaitre, 2001). Grids were examined under a JEOL 1400 TEM operating at 120 kV (JEOL, http://www.jeol.com). Images were acquired using a high-resolution (11 megapixels), high-speed camera (SC1000 Orius; Gatan, http://www.gatan.com) and processed using Digital Micrograph (Gatan).
Array tomography-SEM (Fig. 1, Box B, column G). To ana-lyse each of the three steps in the digestive cycle, 50–60 nm thick serial sections were cut with a 35° diamond (Diatome) on an EM UC6 ultramicrotome (Leica Microsystems), and de-posited on several rectangular 5× 7 mm silicon wafers (one per ribbon, G3391, Agar Scientific), which were then glued on an aluminium pin stub (Zeiss aluminium short pin stub 25.4 mm diameter top, https://www.microtonano.com) with silver cement. Samples that were previously plasma-cleaned with an Evactron (XEI scientific) were then observed with a Field Emission Scanning Electron Microscope (GeminiSEM 500, Zeiss) driven by SmartSEM, operating in high vacuum at 1.5 kV with the high current mode and a 30 µm aper-ture diameter, and approximately 1.75 mm working dis-tance. Two detectors (one in-lens and one in-column, respec-tively) were used to separately collect secondary (SE) and backscattered electrons (energy selective BSE detector with fil-tering grid between 400 and 750 V). Brightness and contrast LUT (LookUp Table) mode was inverted to obtain TEM-like images.
Automated acquisitions were performed using Atlas 5 (Fibics), with a pixel dwell time of 6.4 µs, a line average of 50, a 7-nm pixel size and 8192× 8192 pixels image definition (corresponding to an image size of 57.3× 57.3 µm), overlap at 10% (each ROI was a mosaic of 2 images), autofocus and autoastigmatism. After stitching, stacks were recorded with a 50–50 mix of SE and BSE channels. In these conditions, SE images were generated at the extreme surface (depth of a few nanometres), whereas the BSE images were capable of provid-ing information from a depth of a few tens of nanometres. Im-ages produced by the SE in Lens detector were low-contrasted with good resolution. The SE in Lens is also charge sensitive and detects topological informations like folds, dirts and scan mark (especially in the overlapped regions for mozaïc). On the other hand, images produced by the ESB detector had a
bet-ter contrast, but a higher background noise. The 50–50 mix of the two channels is a right equilibrium to take advantages of the two detection modes and practically erase their defaults. Prealignment in Z was performed using the ‘linear stack align-ment with SIFT’ module of the ‘registration’ plugin in Fiji. 3D reconstructions were made using IMOD (Kremer et al., 1996).
Results
The main traits of the Dionaea muscipula digestive glands, and a chronological map of secretion
Figure 2 presents the main characteristics of the snap trap mechanism developed by Dionaea (cf Introduction para-graph). Our study focuses on the pigmented digestive glands covering most of the inner surface of the trap. Those digestive glands that we investigated are arranged in a highly organ-ised multicellular complex (Fig. 2B). Longitudinal sections observed by conventional TEM (Fig. 2C) highlight this tissue organisation. In accordance with the typical organisation of plant secretory glands (Luttge, 1971), three cell types may be observed: basal cells, which are inserted in the epidermis; en-dodermoid cells; and secretory cells involved in the synthesis and release of digestive fluid (see also fig. 1B in Gergely et al., 2018).
Our experimental conditions using a gelatine block to sim-ulate the prey present the same kinetics as described by pre-vious authors: after prey capture, the trap rapidly closes and reopens after 4–5 days. We were therefore confident that sam-pling the traps at day 0 (resting stage before stimulation by contact with the gelatine block), day 1, day 2, day 3 and day 5 would give different snapshots of the secretory system in ac-tion, in agreement with the digestive cycle described by Juniper (Juniper et al., 1989).
3D reconstruction of subcellular architecture by TEM tomography and SBF-SEM
A first set of 3D data was acquired from specimens fixed by chemical fixation combined with ZIO impregnation that had already been used in earlier studies (Juniper et al., 1982) (see flow box A in Fig. 1). Strong labelling of the ER and GA was previously described by TEM and stereomicroscopy at 80, 180 and 1000 kV by Chris Hawes (see figs. 18–22 in Juniper et al., 1982). It is widely accepted that the ZIO reaction may impreg-nate membranes in highly differential ways across a sample (probably due to an uneven penetration of the ZIO mixture which may be associated with a former uneven chemical fixation speed across the samples or the cells). In the former study, observations were performed on Golgi stacks that had been evenly stained across the cisternal stack, whereas our TEM tomography study concentrated on Golgi stacks exhibiting a gradual staining from cis to trans cisternae. The transverse sections of Golgi stacks (Fig. 3B) clearly show a
S E C R E T O RY PAT H WAYS I N C A R N I VO RO U S P L A N T S 9 1
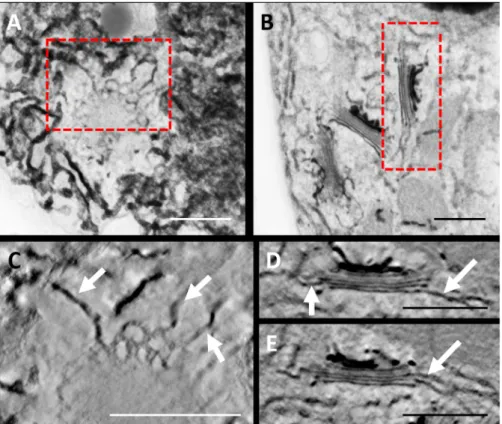
Fig. 3. 3D reconstruction by tomography of the endomembrane system of a ZIO-stained Venus flytrap leaf gland. (A)–(B) TEM micrographs from 10-nm
thick optical slices. (C), (D) and (E) are the corresponding electron tomograms. (D) and (E) are made up of different Z depths from the same tomogram. Boxes in (A) and (B) indicate the location of the tomogram data. Arrows indicate prominent connections between the Golgi stacks and ER. Scale bars: 500 nm.
differential ZIO impregnation from the cis-most cisternae to the trans-most cisternae, highlighting the polarity of the Golgi stack (Fig. 3B). The reticulate nature of the cis Golgi (poorly stained here) is enmeshed in a heavily stained ER membrane network (Fig. 3A). This planar view of cis-Golgi cisterna sug-gests multiple connections with the ER. The corresponding tomograms of the two Golgi stacks differentially orientated in space confirm tubular connections between the fenestrated margins of the cis-Golgi cisternae and the ER (Figs. 3C,D), as well as between the median cisternae and the ER (Fig. 3E).
3D reconstruction by SBF-SEM provided an even larger vol-ume rendering (Fig. 4). SBF-SEM data captured from within a ZIO-impregnated sample mirror the TEM micrographs pre-sented in Figure 3. The maximum intensity projections of the image stack recorded by SBF-SEM describe Golgi stacks as be-ing tightly enmeshed with the ER network, with ER/cisternal connections at different cisternal levels. ER appears mostly tubular, but some small sheets can be seen. Few if any vesicles are associated with the periphery of these cisternae.
Are these tubular connections the consequence of the sample preparation protocol (chemical fixation/ZIO en bloc staining), or are they representative of a functional state of the secretory system? At that stage, the question remains fully open. Analysing the ultrastructure of the endomembrane
system through the three main stages of the digestive cycle by high-pressure freezing may contribute to this long-standing question.
Reorganisation of the endomembrane system throughout the digestive cycle: a 2D study using samples fixed by high-pressure freezing
Contrastingly with ZIO impregnated samples, observations on samples prepared with high-pressure freezing fixation proto-cols (see flow box B in Fig. 1) did not permit to find tubular connections between ER and Golgi. On the other hand, three distinct phases in the secretory activity of the epidermal cells were identified over 6 days (D) of observation: D0 to D1, D1 to D2, D3 to D4 and finally returning to a situation close to the resting stage (not shown) in D5. Tracking of the architectural changes during these three phases is described below.
Ultrastructural organisation in the resting stage (day 0).
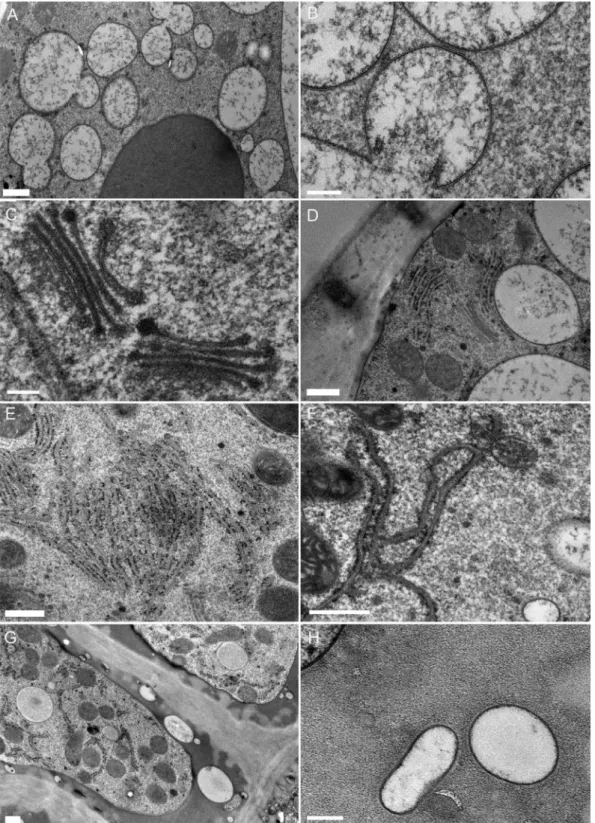
The main characteristic of secretory cells observed in the resting stage was the occurrence of a large vacuole accom-panied by several smaller vacuoles. All vacuoles appeared electron-transparent, presenting rather dispersed and mode-rately stained structures (Figs. 5A, B). Meanwhile, the early
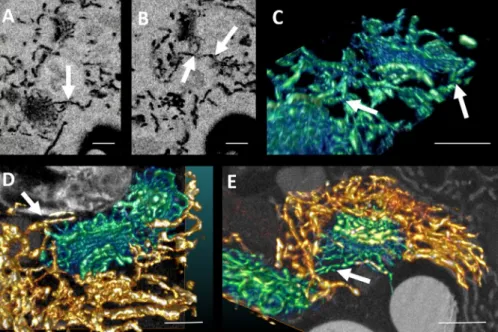
Fig. 4. SBF-SEM. (A)–(B) Images taken of a Venus’ flytrap leaf gland cell at different depths within the sample. (C)–(E) Maximum intensity projections of
Golgi bodies (blue to green with green indicating the highest electron signal) and ER (orange to yellow, the lighter shades indicating the highest electron signal) showing connections (arrows) between the two. (D) and (E) also show orthoslices through the data in the background of the image. (C) is a reconstruction of the data shown in (A). Scale bars: 500 nm.
compartments of the secretory pathway, that is ER and GA, ex-hibited a typical plant ultrastructural organisation, with small Golgi stacks made of four to six flattened cisternae dispersed throughout the cytoplasm (Figs. 5C and S1). These were surrounded by small, rare vesicles, suggesting a low secretory activity by exocytosis. This Golgi stack architecture was quite homogeneous throughout the whole GA (Fig. S1). The ER appeared dispersed throughout the cytoplasm displaying tubular profiles. Most ER profiles were heavily decorated with ER-bound ribosomes, suggesting they might actually origi-nate from ER sheets rather than tubules (Fig. 5B). Multivesic-ular bodies (MVBs) (Fig. 5C) were often observed, enclosing a large number of intraluminal vesicles. The plasma membrane was closely apposed to the cell wall (Fig. 5A). Wall ingrowths, a characteristic of secretory cells (Vaughn et al., 2007), were also observed (Figs. 5B–C, arrows). Atypical membranous features not previously reported in chemically fixed samples were also seen, with complex circular labyrinths (0.5–2 µm size) mixing cytoplasmic and vacuolar networks observed in the vacuolar space (Fig. 5D). These labyrinthic networks will persist and even become more prominent during the digestive cycle (Fig. 6B).
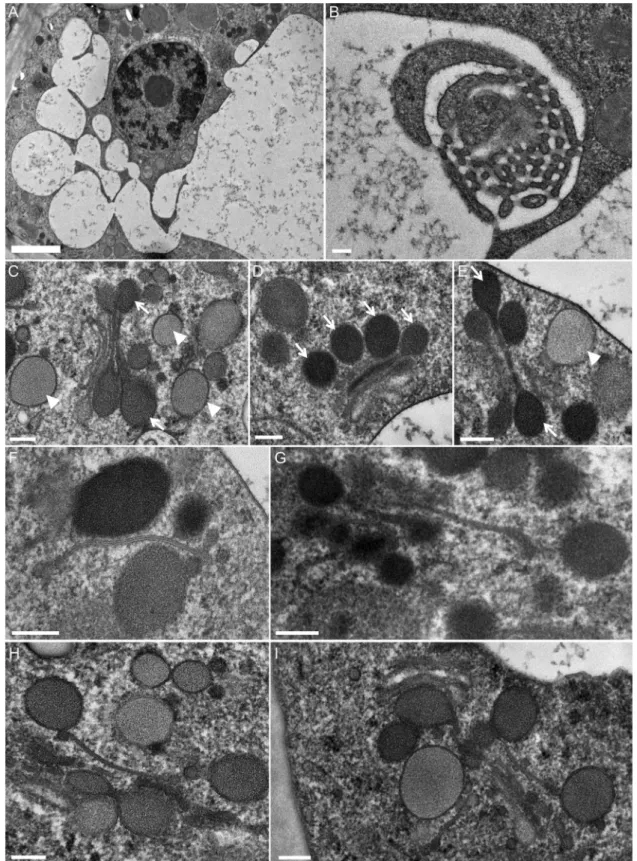
Ultrastructural organisation after stimulation of secretion (day 1 and day 2). Activation of the trap induced profound mod-ifications of the endomembrane system during the first 24– 48 h (Fig. 6). One striking aspect of reorganisation concerned the main electron-transparent vacuolar system: the vacuoles became more convoluted, and were apparently breaking down
into smaller vacuolar compartments (Fig.6A). The unusual labyrinthic networks were still observed in the vacuolar space of the main vacuolar structure (Fig. 6B). Besides this vacuole population, a heterogenous population of electron-dense vac-uoles/vesicles was also observed at this stage. One of these subpopulations was clearly derived from Golgi stacks. A few Golgi stacks still presented the typical profile made of five cis-ternae described at the resting stage, but most of the Golgi stacks now presented a quite extraordinary profile: they were made of only one to three cisternae, bulging at their extre-mities and producing large (150–300 nm) electron-dense vesicles (Figs. 6C–E, arrows). The faith of the lost cisternae may be mirrored either by the high vesiculation process which is observed, although dispersal of stray cisternae may occur (Figs. 6F–H), as suggested by the width of some membranous tubular profiles. These images strongly suggest that the Golgi stacks are engaged in the massive secretion of products en
route to the cell surface. Variations in the electron-dense
con-tent of these vesicles may have varied from one Golgi to the next (see supplementary data Fig. S2). On the other hand, aside from this electron-dense Golgi-derived material, another subpopulation of large vesicles (300–500 nm) had their sur-face marked by a thin electron-dense membrane, enclosing homogenously stained contents (Figs. 6C–E, arrowheads). Do these vesicles derive from Golgi stacks or are they derived from other structures that could not be well-established in these 2D micrographs? One hypothesis is that they may cor-respond to trans-Golgi network (TGN) elements described in Gergely et al. (2018). Tubular profiles that associate with those
S E C R E T O RY PAT H WAYS I N C A R N I VO RO U S P L A N T S 9 3
Fig. 5. Ultrastructural organisation of secretory cells of digestive glands in the resting stage (D0). (A) Note the large vacuole together with the occurrence
of a few small vacuoles; arrows indicate wall ingrowths. (B) ER, small vacuoles and typical wall ingrowths (arrows). (C) Two Golgi stacks, surrounded by a few small vesicles, made of four to six flat cisternae. Note the multivesicular body (MVB) with intraluminal vesicles and wall ingrowth (arrow), characteristic of secretory cells. (D) Labyrinthic network within the vacuolar space. Scale bar (A): 5 µm; scale bars (B–C–D): 500 nm.
vesicular structures profiles were also observed (Figs. 6F– I). Those could correspond to ER profiles, or, as previously evoked, to stray Golgi cisternae, as the width of the profiles matched the width of the Golgi cisternae (Figs. 6F, H). At this stage, tubular ER was still present throughout the cy-toplasm. Micrographs showed small 50–70 nm dense struc-tures in the vicinity of the ER, Golgi stacks, and large vesicles, evoking coated vesicles involved in traffic between compart-ments (Figs. 6C, E, F, H, I). MVBs were also abundant, with a high number of intraluminal vesicles. The cell surface was still made of the cell wall flanked by a closely apposed plasma membrane (Fig. 6A).
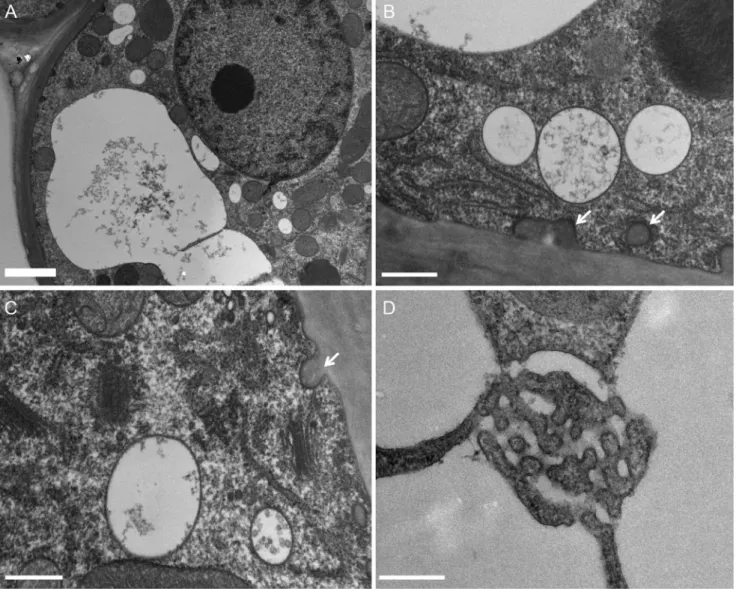
Ultrastructural organisation after stimulation of secretion (day 3). Three days after feeding plants, we observed new ul-trastructural features that characterised the secretory cell: an apparent breaking of the vacuolar system, a modification of Golgi secretory activity, and the occurrence of an enlarged periplasmic space filled with osmium-sensitive material, as reported below.
The apparent process of vacuolar remodelling was rein-forced, since the vacuolar system was made up of a dense population of small vacuoles (Figs. 7A, B). Some observa-tions even suggested connecobserva-tions between small vacuoles, or fusion events (Fig. 7B). The extent of this connectivity was
Fig. 6. TEM micrographs of secretory cell ultrastructure 1–2 days after stimulation. (A) Main convoluted vacuole giving rise to interconnected or isolated
subcompartments. (B) Labyrinthic network in the vacuolar space. (C)–(E) Drastically altered Golgi stacks. The Golgi stacks, which contain less cisternae, are connected to large secretory vesicles and are full of fine electron-dense material. Note that the luminal electron-density of the vesicles around the Golgi stack is heterogeneous. (F)–(I) ER and tubular structures associated with dense vesicles. Scale bar (A): 2 µm; scale bars (B–I): 200 nm.
S E C R E T O RY PAT H WAYS I N C A R N I VO RO U S P L A N T S 9 5
Fig. 7. Ultrastructure of the secretory cells of the digestive glands 3 days after stimulation. (A)–(B) Clusters of small independent or interconnected
vacuoles in the cytoplasm. (C) Golgi stacks containing 4–5 cisternae, with small dark vesicles. (D)–(F) ER remodelling: (D) The ER may be closely apposed to the vacuoles; (E) abundant ER organised in stacks; (F) ER branched configurations. (G) Occurrence of a new compartment between the plasma membrane and cell wall (periplasmic space). (H) Detail of the new periplasmic space, with embedded membranous ‘pockets’. Scale bars (A–D–E–G): 500 nm; scale bars (B–C–F–H): 200 nm.
investigated by 3D analysis. Labyrinthic networks were rarely observed at this stage. On the other hand, the GA seemed to enter a new cycle of secretion as Golgi stacks were built up again, composed of three to six cisternae (Fig. 7C). At this stage, the massive electron-dense vesicles described earlier were no longer detectable, and were replaced by numerous small electron-dense vesicles budding from the margins of cisternae (Figs. 7C, S3). Golgi stacks appeared extremely or partially curled (Fig. S3). These images still suggest secretory activity, but at a different rate or with a different quality than described before. Contrastingly with the previous stage, structural modifications of the ER network were now often de-tected, suggesting a complex 3D reorganisation and changes in communication within the cells. For example, the ER could be closely apposed to the vacuolar membranes (Fig. 7D), and clear ER sheets were organised in membranous stacks (Fig. 7E), or present in branched configurations (Fig. 7F). MVBs were rarely observed.
One striking characteristic of secretory cells at this stage is the occurrence of a new space at the cell surface, settling between the plasma membrane and the preexisting cell wall (Figs. 7G–H). We also observed that the plasma membrane had retracted within the cells, compressing the cytosol. This new space was homogenously stained, exhibiting a fine granular content. The texture and density of this new compartment was similar to the contents of the Golgi-derived vesicles observed at D1–D2. Membranous ‘pockets’ of un-known origin or functions were also observed in this newly created space (Fig. 7H).
These observations suggested the occurrence of a second phase of secretory activity, distinct from the one observed in D1–D2.
Ultrastructural organisation after stimulation of secretion (day 5). After 5 days, the new periplasmic space described in D3 had disappeared and the cell organisation resembled that described in the resting state. Golgi stacks and ER exhibited structural profiles similar to the ones described at D0, and no secretory vesicles were detected around the Golgi stacks. Fi-nally, the main vacuole reformed.
Visualisation of the intra- and interconnections of the vacuolar system, vesicles and ER by array tomography
We found the evolution of the vacuolar system described above (i.e. the apparent fragmentation throughout the di-gestive cycle) very intriguing. Moreover, the existence of heterogeneous populations of vesicular structures brought into question the origin of these vesicles. In order to further analyse the vacuolar remodelling and occurrence of small vacuolar/vesicular structures, 3D reconstructions of the vacuolar system were made by array tomography.
3D reconstruction of the vacuolar system confirmed that, prior to activation of secretion by prey trapping, the vacuolar
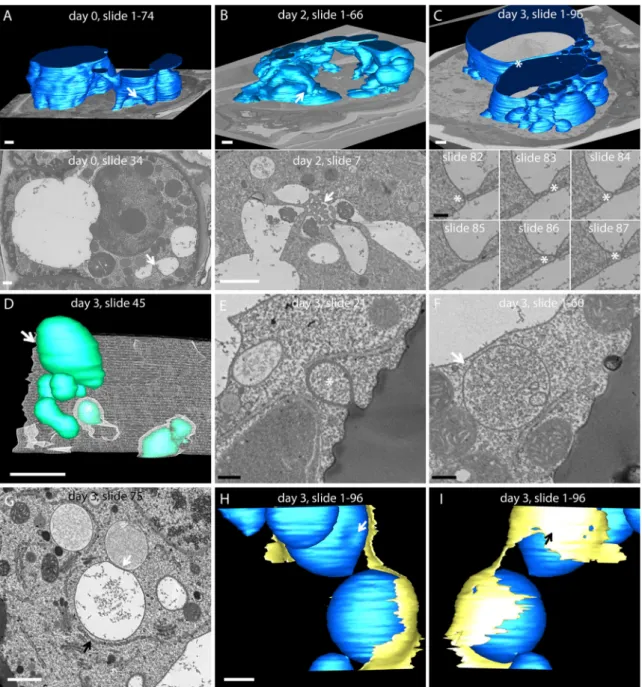
system was primarily composed of a main large vacuole with small convolutions (Fig. 8A). 3D reconstruction of such fig-ures showed that the few small vacuoles present in the cyto-plasm were actually connected to the main vacuole (Fig. 8A, arrow).
After activation of the trap and triggering of the secretion processes, 2D data clearly revealed a remodelling of the vacuo-lar system. The 3D volume reconstruction showed that those smaller vacuoles observed in the 2D representation were still clearly associated with a highly complex main vacuolar struc-ture, forming interconnected subvacuolar domains (Figs. 8B, C). Serial sections observed by SEM also permitted focusing on the structural connections between two subvacuolar com-partments. The continuum is composed of a tight channel between the two subvacuolar compartments (Fig. 8C). These data suggest the occurrence of constriction or tubularisation events, in contradiction with the term ‘fragmentation process’ previously evoked from 2D data. Interestingly, the 3D recon-struction of labyrinthic networks observed in the 2D micro-graphs were positioned at the junction between those subvac-uolar compartments (Fig. 8B, arrow), suggesting a peculiar mechanical or physiological role for these areas in the remod-elling of the vacuole.
Besides the main vacuolar system that is recognisable by its electron-translucent content, distinct populations of large vesicular structures were also observed in SEM micrographs (Figs. 8E–F). Their content is reminiscent of the cytoplasm. Their 3D reconstruction outlined a complete separation from the vacuolar compartments (Fig. 8D, arrow). When observed in close proximity to the cell surface, they appeared to be surrounded by the plasma membrane (Figs. 8E, D, asterisk). These profiles suggest the occurrence of autophagosomal-like structures, originating from the plasma membrane. They may be related to ‘inflows’ of membranes to compensate for the massive export of membrane material during the secretory activity observed in the previous stage, and could therefore explain the cytoplasm-like content of these vesicles.
One of the structural characteristics evoked by TEM micro-graphs at this stage was the remodelling of the ER network. Clear ER sheets were observed (Figs. 8G–I). Array tomogra-phy was used to determine whether there was any relation-ship between the ER and vacuoles (Figs. 8G, H). As shown in Figures 8(H) and (I), the vacuoles seemed to be wrapped on one side by extended ER sheets, suggesting a functional role for ER/vacuole exchanges.
Quantification of vacuolar volume variation between the resting and activated stages of the digestive cycle: LM image analysis
Next, we addressed whether the morphological changes observed in the vacuolar system were related or not to sur-face/volume changes. As previously shown, stacks of serial sections provided an overview of the volumetric changes in vacuoles within an entire cell. The possibility to perform
S E C R E T O RY PAT H WAYS I N C A R N I VO RO U S P L A N T S 9 7
Fig. 8. 3D rendering from array tomography data. (A)–(C) Comparison of the main vacuole 3D structure at the three time points of secretion. (A) Vacuole
reconstruction in a resting cell (day 0). Top: modelling of 74 sections (thickness= 50 nm section–1). Bottom: micrograph of slide n°34. White arrows indi-cate the corresponding position of the micrograph on the modelling. (B) Vacuole reconstruction in a secretory cell 2 days after activation. Top: modelling of 66 sections (thickness= 60 nm section–1). Bottom: detail of micrograph n°7. Labyrinthic network of vacuolar material observed in 2D micrographs
(arrow) is positioned between several vacuolar subcompartments. (C) Vacuole reconstruction in a secretory cell 3 days after activation. Top: modelling of 96 sections (thickness= 50 nm section–1). Bottom: detail of serial sections (n°82 to 87) extracted from the image stack modelllised in the upper part.
Tubular connections are observed between 2 vacuolar subcompartments (*). (D)–(F) Vesicular structures were localised near the plasma membrane, or even enmeshed in it (day 3). (D) Modelling of 60 sections (thickness= 50 nm) at day 3. White: plasma membrane; green: vesicular structures. Arrow: vesicle observed on the micrograph presented in (F). (*): 3D reconstruction of the structure observed in (E). (E) Micrograph of section n°45 extracted from the model presented in (D). *The corresponding vesicles in the model (D). (F) Micrograph of section n°21 extracted from the model presented in (D). Arrow shows the corresponding vesicles in the model (D). (G)–(I) ER-vacuole contact in activated secretory cells (day 3). (G) Micrograph of section n°75 extracted from the stacks in (H)–(I). White and black arrows show the positions of the corresponding arrows in (H) and (I). (H)–(I) Two views of the reconstruction of the structures observed in G. (H) White arrow corresponds to the white arrow in the micrograph (G). (I) Black arrow corresponds to the black arrow in (G). Blue: vacuole; yellow: ER. White scale bar: 1 µm; black scale bar: 200 nm.
Table 1. Summary of observations made by volume EM approaches.
D0–D1 D1–D3 D3–D4 D5
Cell wall Wall ingrowths Wall ingrowths Wall ingrowths Wall ingrowths
Periplasmic space Enlarged periplasmic space,
possibly made of proteins Plasma
membrane
Closely apposed to the cell wall Closely apposed to the cell wall ER connections?
Plasma membrane retraction Closely apposed to the cell wall Vacuole Main vacuole, with few
subcellular compartments Convoluted vacuoles, interconnected vacuoles Interconnected small subvacuoles Reconstruction of a main vacuole Polygonal network
Presence of labyrinthic network Presence of labyrinthic network Disappearance of a labyrinthic network
Rarely observed
Golgi 4–5 cisternae Decrease in Golgi cisternae number (2–3 cisternae)
Increase in Golgi cisternae number (4–5 cisternae)
4–5 cisternae
Golgi-associated vesicles
Small and rare Peak production of massive secretory vesicles (protein content)
Peak production of small secretory vesicles
Resting stage
ER-GA tubular connections
Juniper et al. (1982); this study* Juniper et al. (1982); this study*
Intracytoplasmic vesicles
Rare Heterogenous populations, at least two types
Small vesicles Rare
ER Tubular ER and ER sheets, dispersed throughout the cytoplasm
ER close proximity to the Golgi Complex ER remodelling and ER/organelle contact sites, suggesting multiple functions
Tubular ER and ER sheets
Multivesicular bodies
Numerous Numerous Rarely seen Numerous
*Note that the number and profiles of cisternae in the Golgi stack suggests that the cells are engaged either in the second phase of the secretory event
(D4–D5) or in the early stage (D1–D2).
automatic segmentation based on contrast provided by spe-cific fluorescent labelling was therefore combined with the ability to reconstruct volumes from serial sections.
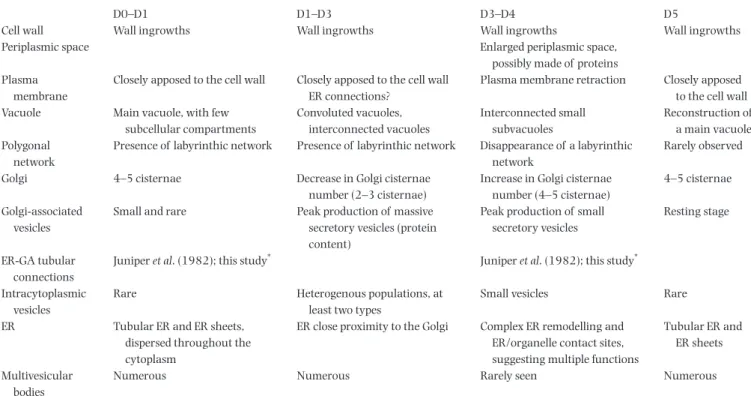
In order to optimise dye uptake by the sections, D0 and D2 samples were processed without contrasting agents before resin embedding. A combination of DAPI and propidium iodide (PI) was applied in order to differentially stain cell perimeters and vacuoles. Staining of entire ribbons of serial sections affixed to glass coverslips ensured a homogenous contrast throughout the entire preparation (Figs. 9A,B), per-mitting a clear visualisation of cells and vacuoles (Figs. 9C,D) and facilitating subsequent 3D cell reconstructions (Fig. 9E). Figure 10 illustrates the data extracted from the image analy-sis of six secretory glands in the resting stage D0 (Fig. 10A) or after two days of trap activation (D2) (Fig. 10B). Cell volumes remained unchanged between the two conditions (data not shown). However, an increase in both vacuolar surface and vacuolar volume in each cell was observed after triggering the secretory process, suggesting that membrane flow to the vacuole may occur.
Discussion
The prey of Dionaea muscipula provides an essential source of nutrients such as nitrogen and minerals, as these plants typi-cally grow in soils that are poorly enriched with these
compo-nents. Trap performance is linked to the ability to quickly di-gest prey, before reopening for subsequent prey capture. Thus, an efficient trap requires a supporting digestive system, and must be regulated by a specific molecular orchestration within the cells. Here, we used a volume electron microscopy toolbox to learn more about the cellular mechanisms possibly involved in this process.
A combination of 2D and 3D EM approaches provided us with an abundance of data on ultrastructural modifications (Table 1). These approaches are complementary to a pre-vious HVEM study (Juniper et al., 1983), as well as more recent electron tomography observations made at 300 kV by Gergely et al. (2018). They are associated with the original feeding strategy of Dionaea, and probably outline possible key innovations in secretory processes in the evolution of eukary-otic cells. Importantly, the reported descriptions of secretory events (i.e. timing and intensity) may differ slightly from one experiment to the next, or between laboratories, depending on the very nature of the experimental prey (e.g. liquid ver-sus solid; see also Scala et al., 1969). Intensity or even qual-ity of secretory events may also depend on the physiological state of the trap, performances of which will decrease with the number of cycles (mainly three, but exceptionally four cycles) (Davis et al., 2019). It is also essential to stress that remodelling of the membrane system should probably be considered as a whole that is greater than the sum of its parts.
S E C R E T O RY PAT H WAYS I N C A R N I VO RO U S P L A N T S 9 9
Fig. 9. 3D reconstruction of vacuolar volume from serial sections observed by light microscopy. Successive steps are shown in the volume reconstruction
of the secretory gland cells and vacuoles. (A)–(B) Low-magnification fluorescence image of the serial sections stained with DAPI and propidium iodide to generate the automated high-resolution acquisitions. (C) High-resolution dual channel fluorescence image of a single gland section. (D) Result of the segmentation procedure used to generate two masks: cell walls (red) and nonvacuolar cell content (yellow). (E) 3D reconstruction of the cell walls (red) and vacuoles (grey) from the binary masks.
ZIO impregnation and the ER/Golgi relationship: organisational and functional changes in ER–GA exchanges throughout the digestive cycle
One source of debate regarding the reliability of EM data is the variation in observations according to the protocol used in sample preparation. Results showed that membrane continuum was described between ER and Golgi stacks when samples were prepared along a ZIO protocol impregnation process. However, such continuum was never detected when samples were prepared along high-pressure freezing/osmium protocol (this paper; Gergely et al., 2018). Are those ZIO-stained membrane continuum artefactual or do they reveal a physiological trait of the endomembrane system only deci-pherable by ZIO protocols? Osmium impregnation techniques are the most popular way to increase membrane contrast. These techniques are based on the reduction of osmium tetroxide, which leaves a deposit of osmate or osmium on the surface of membranes or within the cisternal space of membrane-bound organelles. Osmium tetroxide mainly re-acts with double bonds that are not present in all lipids. In the ZIO protocol used for this study, osmium reduction was furthermore increased by the addition of zinc iodine osmium mixture, which probably limits the extraction of unbound molecules during dehydration steps.
The ZIO impregnation method could be considered an ideal
en bloc staining method for the early compartments of the
se-cretory pathway (i.e. the ER, GA, and nuclear membranes), it does not always enhance the tonoplast, it never labels the plasma membrane, and hardly ever stains Golgi-derived or associated vesicles. The duration of staining may affect the whole impregnation process and should be tested for each biological sample (4–12 h for Dionaea; C. Hawes, personal communication). Its ability to stain membrane structures may therefore reveal a highly sensitive and complex cytochemical reaction in cellulo, linked to specific molecular arrangements within the membranes. It therefore cannot be excluded that the association of chemical fixation and heavy osmiophilic re-sponse obtained with ZIO protocol may enhance character-istics not detectable by some other means. The information extracted from ZIO observations should therefore be consid-ered as solid data. In this study, a strong staining gradient is typically observed across the sample (due to uneven fixation speed or intensity and/or uneven penetration of the chemi-cals during impregnation process) permitting the selection of regions of interest. The ER–Golgi continuum observed in this study has been detected by ZIO impregnation in several bio-logical materials (Harris, 1979; Hawes, 1981; Hawes et al., 1981; Harris & Oparka, 1983; Mérigout et al., 2002; Képès
Fig. 10. Quantification of vacuolar morphology change from light microscopy 3D reconstructions. Representative volume rendering of a secretory gland
(grey) and its vacuolar system (using rainbow LUT, one colour per cell) in the resting (A) or digestive stage (B). (C) Quantification of the vacuole surface change between resting and digestive stages. The vacuole surface is presented as the surface of all the vacuoles within a cell normalised by the cell surface. (D) Quantification of the vacuole volume change between the resting and digestive stages. The vacuole volume is presented as the volume of all the vacuoles within a cell normalised by the cell volume. Resting stage samples: 70 cells. Digestive stage samples: 34 cells.
connections may be dependent on the type of secretory ac-tivity of the cell. For example, in carbohydrate-secreting cells that specialise in polysaccharide secretion, connections be-tween the Golgi and ER are rarely observed (as in maize root caps, bean leaf palisade tissue, and elongating bean roots). Meanwhile, in protein-secreting cells, connections between the tubular ER and Golgi are observed across the cisternal stack (Juniper et al., 1982).
Taking into account these considerations, we believe that the tubular ER–GA connections observed by elec-tron tomography and SBF-SEM at the D4–D5 or D0– D1 stages are truly representative of a specific func-tional organisation in Dionaea muscipula. Such a tubular continuum, detectable mainly (if not only) by ZIO ap-proach, may correspond to an efficient transfer mecha-nism for lipids and/or proteins between the ER and GA, especially for use in rapidly resetting the molecular GA machinery.
The HPF/freeze-substitution protocol: two distinct phases of protein secretion occur throughout the digestive cycle
The osmium en bloc staining associated with the HPF proto-col provided ‘shades of grey’ among the stained structures. This procedure stains membranes enriched in unsaturated lipids, interacts with proteins (producing electron-dense ma-terial in secretory vesicles), and reveals a fair amount of the ultrastructural content, especially the occurrence of hetero-geneous vesicles/vacuole-like compartments. However, it does not selectively stain polysaccharide-containing vesicles or cell walls. It therefore constitutes an appropriate staining protocol
to track the trafficking of a massive production of cargo pro-teins.
Based on our observations, two phases of protein secretion could be observed. In the first, there is a massive peak in-volving high activity in both the ER and GA. Golgi stacks ex-haust themselves by producing massive protein-stained vesi-cles. Meanwhile, the ER exhibits tubular connections or close contacts with a subpopulation of vesicles, which suggests the occurrence of ER-derived secretory vesicles that may by-pass the Golgi stacks. Such by-by-passes have been described for instance in case of ER-to-vacuole transports (Pereira et al., 2013). Direct contact between the ER and plasma membrane has also been suggested to be involved in protein release to the cell surface in previous studies (Juniper et al., 1982). ER to cell surface secretion has been described in the extrafloral nec-tary of Abutilon where the prenectar is loaded into a specialised form of ER. The second phase of endomembrane activity was observed as a distinct architecture of the GA and ER network. Golgi stacks being rebuilt still presented dense electron vesicles at the margins of their cisternae (although they were much smaller than in the previous step), and were surrounded by numerous small (coated) vesicles. Interestingly, some of the Golgi stacks were often curled or partially curled. Such Golgi profiles have been previously described (Lütz-Meindl et al., 2016), in a different functional/physiological background probably related to stress. It may be related either to a differ-ential membrane growth (cis sides growing faster than trans sides), or to the settings of the molecular machinery for cister-nae stacking. At this stage, the ER may be involved in sustain-ing the homeostasis of lipids and proteins in different subcel-lular compartments, as suggested by the high reorganisation
S E C R E T O RY PAT H WAYS I N C A R N I VO RO U S P L A N T S 1 0 1
of its network (i.e. branched configurations in close contact with vacuoles and Golgi stacks). These results suggesting two secretory phases are in agreement with the biphasic secretion curve described by the fluorescent casein assay and are possi-bly related to the different nature of secreted proteins (Gergely
et al., 2018).
Taking these considerations into account, we believe that the first secretion peak is part of a rapid response to deliver digestive fluids to the cell surface, which delivers the needed stock of digestive materials ‘on site’. The second peak of ac-tivity could then be associated with the reconstruction of the Golgi, ER and vacuolar machinery, in order to prepare for a subsequent round of prey capture. As stated by Gergely et al. (2018), ‘cells of secretory glands are “overbuilt” to permit the
stimulated cells to quickly provide the needs in digestive enzymes’.
The Dionaea feeding strategy involves a novel Golgi morphodynamic process
The morphodynamics of the Golgi apparatus in Dionaea
mus-cipula may add to our general understanding of plant Golgi
biology. As in other plant secretory cells, a massive transport to the cell surface of secretory products from the bulging margin of the Golgi cisternae was observed in order to accommodate the cell’s needs. However, these ultrastructural profiles were previously observed in the massive production of polysac-charides (instead of proteins) en route to the cell surface by a default pathway, leading to the description of plant Golgi as a ‘polysaccharide factory’ (Driouich et al., 1993). In contrast, the Dionaea muscipula GA acts as a true ‘protein factory’. Moreover, in plants, the ability to produce proteins is often associated with the production of storage proteins at the most
trans cisternae of the GA, which are targeted to the vacuolar
compartment by specific receptors. Similarly, in mammalian cells specialised in protein secretion, proteins are packaged in secretory vesicles at the trans side of the Golgi before their stor-age in secretory granules (Rambourg et al., 1992). However, in
Dionaea muscipula, most of the cisternae are involved in
secret-ing the dense vesicles, which are probably directed by bulk flow (via a default pathway) to the cell surface for immediate use.
Dionaea therefore appear to employ a novel mechanism that
uses the pleiomorphy/plasticity of the GA in order to optimise the rapid delivery of newly synthesised proteins, branding the plant Golgi stack as an adjustable protein factory.
Our Dionaea data also suggest that the capacity to pro-duce massive secretory products may be driven rather by me-chanical forces than by a specific molecular machinery. The ‘bulging’ event occurring at the margins of cisternae may be the result of the accumulation of a product, indistinctly from its nature. Protein processing (such as glycosylation) may oc-cur in the central plain core of the Golgi, and processed pro-teins could therefore be pushed towards the fenestrated mar-gins of the Golgi cisternae by an unknown mechanisms, until
mechanical fission of the membranes and vesicle release from the cisternal structure.
Taken together, these data highlight a certain pleiomorphy in the cisternae stacking, which shakes up the well-established ‘cis/median/trans’ hierarchical organisation model, and rein-forces the hypothesis of a (highly adaptative) cisternal matu-ration process in plant Golgi biology.
Volume EM approaches and the release of digestive enzymes: when mechanics rejoin physiology
During the first peak of secretion (D2–D3), a new cell surface area emanating from Golgi-derived secretory vesicles is built and the plasma membrane is pushed away from the cell sur-face. At the same time, Dioneae muscipula secretory cells en-close a vacuolar component that is remodelled into multiple and connected subcompartments. The connections between these subvacuolar compartments are extremely complex due to an unusual labyrinth of unknown function (which may function as a mechanical node to resist volume changes) and the presence of thin channels. All of these events have to be part of the same arrangement: delivering digestive enzymes as quickly as possible to increase trap efficiency.
The punctual and temporary enlargement of the periplas-mic space probably constitutes a reservoir made of freshly synthesised enzymes for immediate use. The Golgi machinery plays a crucial role in the filling of this periplasmic space, cor-responding to the first peak in secretory activity observed on day 2. But what about the emptying process?
Since this is the first time to our knowledge that a vac-uolar continuum has been shown in Dionaea muscipula, it is tempting to propose a functional role for vacuolar remod-elling in accommodating the set-up of a new reservoir, as well as in its emptying. The vacuolar compartment has in-deed been frequently compared to an osmometer that regu-lates both the cell volume conditioning axis of cell growth, and cell homeostasis (Reisenet al., 2005). The progressive and
reversible remodelling of the main vacuole in a complex and convoluted network may help in the continuous adjustment of osmotic pressure for secretory events. Earlier studies have suggested a mechanical interplay between the distribution of forces within cells, provoking the exit of fluid from the vac-uole and the cell towards the cell surface and contributing to the extrusion of the ‘digestive fluid’ (Heslop-Harrison & Knox, 1971; Heslop-Harrison, 1975). When returning to a main central vacuole, the vacuole may grow again in size through the addition of new membranes delivered by the recycling ma-chinery either through multivesicular bodies, endosomes or autophagosome-like compartments (see also Cui et al., 2019 for discussion on vacuole constriction).
The function of vacuoles as acidic and catabolic compart-ments is also important in maintaining cell homeostasis in
Dionaea. These lytic vacuoles may favour the recycling of
in amino acids and releasing them in the cytoplasm, but they are also essential when cells are not properly fed. However, pathways for the internalisation of nutrients and their further use by Dionaea cells have been poorly documented. Such traf-fic may explain the presence of heterogeneous vesicles in the cytoplasm at D2–D3 during the high peak of secretion, where outflows may meet with inflows. In addition, the recycling of membranes by endocytic mechanisms needs to occur in or-der to counterbalance the secretory process. The involvement of specific internalisation mechanisms may also take place in the final distribution of digested prey nutrients. The fact that the vacuolar volume increases throughout the digestive pro-cess (despite its remodelling) suggests that some of these in-flow events actually end up in the main vacuole, either for further processing of nutrients or as a means to replenish the vacuole’s stock of permanent lytic enzymes.
Conclusions and perspectives
The delivered secretory product that we studied here is a unique biological fluid, comparable in many ways to the saliva of heterotrophic organisms (Humphrey & Williamson, 2001). The subcellular features of the secretory cells of
Dion-aea muscipula outline key innovations in the organisation of
plant cell compartmentalisation that are used to cope with specific cell needs, such as the full use of the Golgi appa-ratus as a protein factory, and the ability to create protein reservoirs in the periplasmic space. Shape-derived forces of the pleiomorphic vacuole may act as signals to accompany the sorting and entering flows of the cell. The challenge is now to place in their context the molecular regulators of this digestive response that have been suggested by sequencing programs. This should include the COP (Gergely et al., 2018) transport machinery in addition to well-known molecular, Rab and SNARES cascades involved in membrane trafficking, as well as players involved in modification of the cytoskele-ton and mechanotransduction. Several biotechnology groups around the world are now engaged in sequencing carnivorous plants in order to identify the signalling pathways that are trig-gered by prey capture. Altogether, this work reveals a probable combination of mechanical and structural complexity under-lying secretory cell organisation, and puts forward the ques-tion of trap efficiency in plant biology.
Acknowledgements
We thank Michaël Trichet (IBPS electron microscopy core facility) for his expertise in SEM and array tomography. We thank Jake Richardson for collecting part of the data shown in Figure 3. This work benefited from the expertise of the light microscopy facilities at the Imagerie-Gif (http: //www.i2bc.paris-saclay.fr/spip.php?article278). This core fa-cility is a member of the Infrastructures en Biologie Santé et Agronomie (IBiSA), and is supported by the French
Na-tional Research Agency under the Investments for the Fu-ture programs ‘France-BioImaging’, (ANR-10-INBS-04-01), the ‘Saclay Plant Science’ Labex (ANR-11-IDEX-0003-02), and the Equipex Morphoscope (ANR-11-EQPX-0029).
References
Bal, A.K. & Payne, J.F. (1972) Endoplasmic reticulum activity and cell wall breakdown in quiescent root meristems of Allium cepa L. Z. Für
Pflanzen-physiol. 66, 265–272.
Berg, S., Kutra, D., Kroeger, T. et al. (2019) Ilastik: interactive machine learning for (bio)image analysis. Nat. Methods 16, 1226–1232. Borrett, S. & Hughes, L. (2016) Reporting methods for processing and
analysis of data from serial block face scanning electron microscopy.
J. Microsc. 263, 3–9.
Cui, Y., Cao, W., He, Y. et al. (2019) A whole-cell electron tomography model of vacuole biogenesis in Arabidopsis root cells. Nat. Plants 5, 95– 105.
Darwin, C. R. (1875). Insectivorous Plants. London: John Murray. Davis, A.L., Babb, M.H., Lowe, M.C., Yeh, A.T., Lee, B.T. & Martin, C.H.
(2019) Testing Darwin’s hypothesis about the wonderful venus flytrap: marginal spikes form a “horrid prison” for moderate-sized insect prey.
Am. Nat. 193, 309–317.
Driouich, A., Faye, L. & Staehelin, A. (1993) The plant Golgi apparatus: a factory for complex polysaccharides and glycoproteins. Trends Biochem.
Sci. 18, 210–214.
Fukushima, K., Fang, X., Alvarez-Ponce, D. et al. (2017) Genome of the pitcher plant Cephalotus reveals genetic changes associated with car-nivory. Nat. Ecol. Evol. 1, 0059.
Gergely, Z.R., Martinez, D.E., Donohoe, B.S., Mogelsvang, S., Herder, R., & Staehelin, L.A. (2018) 3D electron tomographic and biochemical anal-ysis of ER, Golgi and trans Golgi network membrane systems in stimu-lated Venus flytrap (Dionaea muscipula) glandular cells. J Biol Res
(Thes-salon) 25, 15.
Harris, N. (1979) Endoplasmic reticulum in developing seeds of Vicia faba. A high voltage electron microscope study. Planta 146, 63–69. Harris, N. & Oparka, K.J. (1983) Connections between dictyosomes, ER
and GERL in cotyledons of mung bean (Vigna radiata L.). Protoplasma
114, 93–102.
Hawes, C. & Satiat-Jeunemaitre, B. (2001) Plant Cell Biology: A Practical
Approach. UK: Oxford University Press.
Hawes, C.R. (1981) Applications of high voltage electron microscopy to botanical ultrastructure. Micron 1969 12, 227–257.
Hawes, C.R., Juniper, B.E. & Horne, J.C. (1981) Low and high voltage elec-tron microscopy of mitosis and cytokinesis in maize roots. Planta 152, 397–407.
Hawes, C.R.1., Juniper, B.E. & Horne, J.C. (1981) Low and high voltage electron microscopy of mitosis and cytokinesis in maize roots. Planta
152(5), 397–407.
Heslop-Harrison, Y. (1975) Enzyme release in carnivorous plants. Front.
Biol. 43, 525–578.
Heslop-Harrison, Y. & Knox, R.B. (1971) A cytochemical study of the leaf -gland enzymes of insectivorous plants of the genus Pinguicula.
Planta 96, 183–211.
Hughes, L., Hawes, C., Monteith, S. & Vaughan, S. (2014) Serial block face scanning electron microscopy – the future of cell ultrastructure imag-ing. Protoplasma 251, 395–401.
![[PDF] Bureautique excel PDF cours de base | Cours Bureautique](data:image/gif;base64,R0lGODlhAQABAIAAAP///wAAACH5BAEAAAAALAAAAAABAAEAAAICRAEAOw==)