ENVIRONMENT
Article · January 2006 CITATION 1 READS 66 5 authors, including:Some of the authors of this publication are also working on these related projects:
Context-aware Mobile EnvironmentsView project
Image processing using FPGAView project Mohammed Boulmalf
Université Internationale de Rabat 91PUBLICATIONS 692CITATIONS SEE PROFILE Tamer Rabie University of Sharjah 73PUBLICATIONS 649CITATIONS SEE PROFILE Abderrahmane Lakas United Arab Emirates University 90PUBLICATIONS 897CITATIONS
SEE PROFILE
Hesham Elsayed
Arab Academy for Science, Technology & Maritime Transport 5PUBLICATIONS 6CITATIONS
SEE PROFILE
All content following this page was uploaded by Abderrahmane Lakas on 15 May 2014. The user has requested enhancement of the downloaded file.
Mohammed Boulmalf et al.
Performance characterization of IEEE802.11g in an office environment cubicles
1
PERFORMANCE CHARACTERIZATION OF IEEE 802.11G
IN AN OFFICE ENVIRONMENT
Mohammed Boulmalf, College of Information Technology,
UAE University, UAE, boulmalf@uaeu.ac.ae
Tamer Rabie, College of Information Technology,
UAE University, UAE, tamer@uaeu.ac.ae
Khaled Shuaib, College of Information Technology,
UAE University, UAE, k.shuaib@uaeu.ac.ae
Abderrahamne Lakas, College of Information Technology,
UAE University, UAE, a.lakas@uaeu.ac.ae
Hesham Elsayed, College of Information Technology,
UAE University, UAE, helsayed@uaeu.ac.ae
Abstract
Wireless local-area networks (WLANs) based on IEEE 802.11 a/b/g standards are growing rapidly. WLANs can provide the benefits of network connectivity without the restrictions of being tied to a location or restricted by wires. Despite the convenience of mobility, the performance of a WLAN must be addressed carefully be-fore it can be adopted and deployed in any environment. In this paper, we address the impact of various key parameters on the actual performance of IEEE 802.11g. A series of controlled experiments are carried to assess the performance of IEEE802.11g, in the presence of interferences, and finding the maximum through-put under realistic conditions. In addition the impact of co-channel and adjacent channel interferences and noises on the quality of video when streamed over WLAN is exposed. Overall, three sets of independent experiments were conducted to measure IEEE 802.11g’s effective application-level throughput. The analysis results and measurement campaign provide insights into the required provisioning for 802.11g WLAN to ensure that it provides the needed coverage and capacity for the intended users..
Keywords: WLAN, IEEE802.11g, Performance, Throughput.
1 INTRODUCTION
The wireless local area network (WLAN) market has grown rapidly as wireless technology has evolved to meet fundamental needs of businesses and technology consumers. Corporate IT departments are deploying WLANs to support roaming employees, reduce the cost of cabling, and provide a rapid response to changes in connectivity demands. The mobile worker uses public access WLANs in cafes, airports, trains, lobbies, and remote corporate sites to connect to the corporate network or Internet. Small offices and enterprises use WLANs to share Internet connections, printers and peripherals, and create backup connectivity solutions while remaining highly scalable and flexible. The home-based networks use WLAN technology to share broadband Internet connection among multiple families PCs. IEEE 802.11g wireless standard is the latest of WLAN technology to be ratified by IEEE. It extends the widely deployed IEEE 802.11b by broadening its data rates to 54 Mbps within the 2.4 GHz band using OFDM (Orthogonal Frequency Division Multiplexing) modulation (William, 2002; Cisco, 2005).
Mohammed Boulmalf et al.
Performance characterization of IEEE802.11g in an office environment cubicles
2
To design and deploy a WLAN network, an accurate deployment procedure is required to ensure sufficient coverage and network functionality (capacity, interference, etc.). While wireless networking gear is often classified according to its standards-based signaling rate, such as 54 Mbps for 802.11g, the actual data throughput, or data being transmitted, is often just a fraction of the theoretical maximum rate. Research conducted by (Henry, 2001) showed that the user throughput performance changes radically when access points or clients are located near an interfering transmitter or when frequency planning is not carefully conducted. Data throughput can also be limited due to a number of important environmental and product-specific factors, including: (1) Distance between WLAN devices: access points (APs) and network interface cards (NICs), (2) Transmission power levels, (3) Effect of waveguide, e.g. in hallways, (4) Building and home materials, (5) Radio frequency interference, (6) Signal propagation, and (7) Antenna type and location. Therefore, even though the new 802.11g products available are capable of a 54 Mbps signaling rate, the practical, or “actual,” data throughput is more likely to be much less than that (in the 10 – 12 Mbps range).
There are few papers that discuss the performance of the 802.11b standards such as in (Rose, 2002; Zahur, 2003), and to the best of our knowledge, there is no work in the literature that discusses the throughput performance of 802.11g WLANs in small enterprise environments such as a cubicles office area. In this paper, we present a full scale performance study and analysis conducted on IEEE 802.11g, to measure its effective application-level throughput under different scenarios. In order to improve its performance, a clear understanding of WLAN behavior is needed, therefore measuring and analyzing the performance of system under realistic conditions is of paramount importance.
In our experiments, we studied the performance of WLAN in both asynchronous (UDP) and synchronous (TCP) communications by varying the packet size and Inter Packet Delay (IPD). We studied also the effect of interferences on TCP and UDP traffic. The remainder of this paper is organized as follows. Section 2 presents an overview of the measurements undertaken, and describes the test setup and testing environment. Section 3 discusses the performance experiments carried out. Finally, Section 4 concludes the paper.
2 MEASUREMENT CAMPAIGN OVERVIEW AND TEST SETUP
In order to design a wireless LAN, it is often necessary to perform a measurement campaign to ensure that the wireless LAN provides the needed coverage and capacity (i.e. throughput) for the intended users. With this need in mind, a full measurement campaign was performed. In this study we used a test-bed of four IEEE 802.11g access point where the setup was a typical indoor cubicles office environment. Then measurements of the TCP and UDP throughput were collected in presence of interferences. In addition, we investigated the impact of interferences on the quality of video when streamed over WLAN. A Matlab scripts was developed to calculate the Root Mean Squared Error (RMSE). The RMSE is usually used as a measure of video degradation due to compression or channel impairments. Given an original NxM image f and a compressed or degraded image f', the RMSE can be calculated according to the following formula as described in (Gringeri, 1999):
1 1 2 ' 0 0 1 ( , ) ( , ) . N M x y RMSE f x y f x y N M − − = = ⎡ ⎤ =
∑ ∑
⎣ − ⎦ (1)The Peak Signal to Noise Ratio (PSNR) is derived using RMSE to denote the deviation of a compressed or degraded image from the original in dB. For an eight-bit image, with intensity values between 0 and 255, the PSNR is given by:
10 255 20 log PSNR RMSE ⎛ ⎞ = ⎜ ⎟ ⎝ ⎠ (2)
The PSNR values were calculated using both the luminance and chrominance information in the raw video frames. In our experiments, for each iteration of the video sequence, the PSNR was calculated for each frame then averaged over the total number of frames in the sequence. The overall PSNR was
Mohammed Boulmalf et al.
Performance characterization of IEEE802.11g in an office environment cubicles
3
calculated by averaging the PSNR values of all iterations. The details of the IEEE 802.11g test-bed and the testing environment are discussed in the next subsections. Details of the measurement campaign and results are presented in Section 3.
2.1 Testing Environment
Figure 1 shows the physical layout of the measurement environment in the campus of the College of IT at the UAE University. The measurement environment is basically an open area with forty two cubicles and served by three APs using channels 1, 6, and 11. The environment includes seven other IEEE 802.11g Nortel APs located outside of the open area at fixed places inside the campus. During all experiments, the seven 802.11g access points were actively busy serving around 50 active mobile users inside the campus rooms. These APs generate an interference-rich environment, and were used to evaluate how the IEEE 802.11g test-bed system performs in the presence of interferences.
Figure 1. The Physical Layout of the measurement environment
2.2 IEEE 802.11g test-bed measurements
The WLAN test-bed consists of three IEEE 802.11g Nortel APs, a laptop with a 54 Mbps WLAN card, and a desktop PC which is connected to the AP using a 10/100Mbps Ethernet cable. LanTrafficTM v2 (produced by France Telecom R&D) software was in-stalled in both Sender and Receiver to generate data traffic between sender and receiver. LanTraffic is a testing tool which is used to generate UDP and TCP traffic in an IP net-work. It establishes TCP or UDP connections between PCs over the IP network. Specifications of the laptop and desktop PC are shown in Table 1.
Brand Computer OS Processor RAM Software Wireless card
Laptop Dell Latitude Windows 2000 Pentium IV (1.2 GHz) 512 MB LanTraffic Linksys 802.11g
Desktop HP Windows 2000 Pentium IV (1 GHz) 256 MB Lantraffic PCI 100/10 Ethernet Card
Table1 Computers and setting used in measurements
3 PERFORMANCE EVALUATION EXPERIMENTS
This section discusses the three different scenarios that were used to measure the performance of the WLAN systems under test. The three measurement scenarios reflect different indoor environments that are likely to be used in WLAN networks, and were selected to reflect a range of typical installation locations. The measurements were taken on a single floor at various locations throughout all the experiments with the access point located in a central location. Specific details of each of theses
Mohammed Boulmalf et al.
Performance characterization of IEEE802.11g in an office environment cubicles
4
scenarios are given in the following sections. The traffic was generated using LanTrafficTM with packet payload varying from 64 to 1460 bytes and the Inter Packet Delay varying from 1ms to 20ms. For all tests, 50,000 packets where transferred between the WLAN laptop and the server. The distance between the AP and the laptop (with wireless connection) is chosen to be 7 meters with high signal strength. For all testing scenarios, the RTS/CTS protection mode was turned on. In this mode, when a device wants to communicate it sends a Request To Send (RTS) to the destination node, and waits for a Clear To Send (CTS) message before it transmits any data. This is done to avoid collisions; however this brings the maximum data throughput performance down; see (Broadcom, 2003) for further details. During all experiments, all power-save features of the WLAN cards were disabled and no WEP encryption was used.
Figure 2. The IEEE 802.11g measurement test-bed without interferences
The e ffe ct of Inte r Packe t De lay and the Packe t Size on Throughput "TCP Traffic"
0 1000 2000 3000 4000 5000 6000 7000 8000 64 128 256 512 1024 1460
Packet size (bytes)
Thr ouh put ( K b p s ) Throughput (Kb/s) IPD=1ms Throughput (Kb/s) IPD=5ms Throughput (Kb/s) IPD=10ms Throughput (Kb/s) IPD=15ms Throughput (Kb/s) IPD=20ms
Figure 3. The effect of packet size and IPD in the throughput in TCP
3.1 Scenario 1
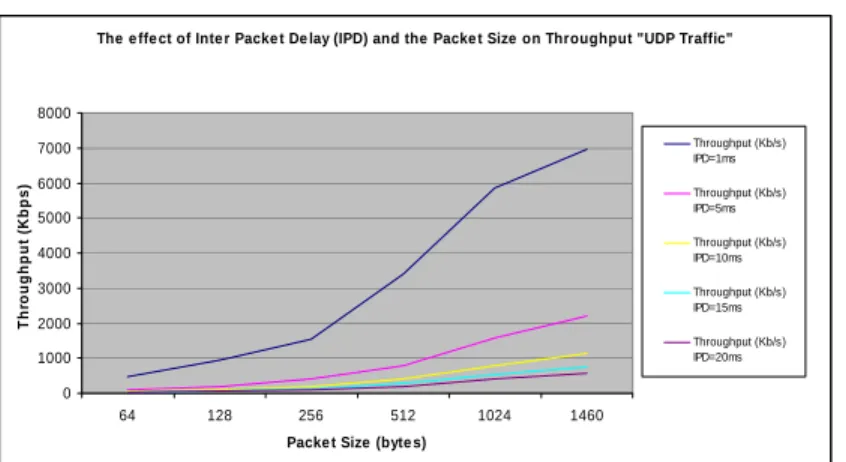
The basic idea behind this scenario, illustrated in figure 2, is to calculate the effective TCP/UDP throughput in the open area within the presence of interferences created by other APs. Figure 3 and Figure 4 show the measured throughput using LanTraffic generator for TCP and UDP, the throughput was increased as the packet size increases. Likewise, for both TCP and UDP experiments, the throughput was increased as the Inter Packet Delay (IPD) was decreased. The maximum throughput can be achieved with maximum packet size and minimum IPD. This throughput is around 7 Mbps with one user. This means: if we have more users, they will share the 7 Mbps and consequently the throughput will decrease dramatically.
Mohammed Boulmalf et al.
Performance characterization of IEEE802.11g in an office environment cubicles
5
The e ffe ct of Inte r Packe t De lay (IPD) and the Packe t Size on Throughput "UDP Traffic"
0 1000 2000 3000 4000 5000 6000 7000 8000 64 128 256 512 1024 1460
Packe t Size (byte s)
Thr oughp ut ( K bps ) Throughput (Kb/s) IPD=1ms Throughput (Kb/s) IPD=5ms Throughput (Kb/s) IPD=10ms Throughput (Kb/s) IPD=15ms Throughput (Kb/s) IPD=20ms
Figure 4. The effect of packet size and IPD in the throughput in UDP
3.2 Scenario 2: generation of co-channel interferences
The main objective of this scenario is to study the effect of co-channel interferences on UDP/TCP Traffic. In this experiment, we considered two segments using similar infra-structure. In each segment, we used one laptop with wireless connection acting as a sender and another laptop with wired connection acting as receiver. The first segment used Nortel AP (channel 11) and the second segment used Linksys Access Point (channel 11). Moreover, we installed LanTraffic software in each computer to send data traffic from a sender to a receiver in the network. The test-bed of this scenario is shown in the Figure 5.
Figure 5. Test-bed with a co-channel interferences generator
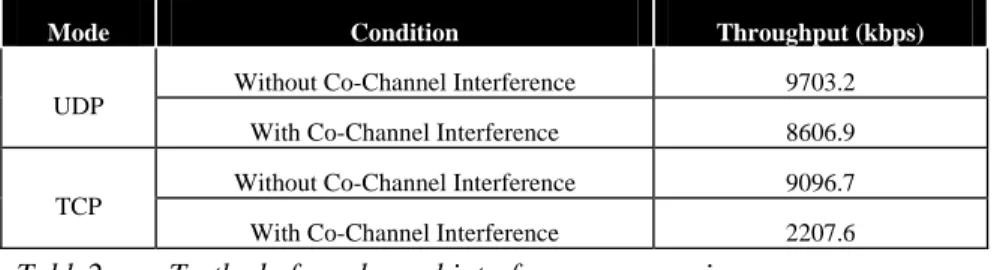
In order to assess the effect of the co-channel interference on the performance of the network, we need to implement the same scenario without interferences producing the highest possible throughput as a base line i.e. when the Inter Packet Delay (IPD) was 1 ms and the packet size was 1460 bytes. The results of the experiments are presented in the Table 2 where the effect of the co-channel interference is clearly shown to drastically degrade the throughput performance, with TCP suffering much more than UDP. This is explained by the delays incurred by the retransmission and error detection. The through-put in UDP mode also decreased but smoothly with co-channel interferences because there are no error detection and no retransmission
Mohammed Boulmalf et al.
Performance characterization of IEEE802.11g in an office environment cubicles
6
Table2 Testbed of co-channel interferences scenario
3.3 Scenario 3: video streaming with interferences
The objective of this scenario is to study the impact of channel interferences and noises on the quality of video streaming. Streaming Video is a process that allows video content to be delivered in real-time across the network to the user's browser without requiring the entire clip to be downloaded before it can be viewed. Without this technology in place, web sites would require users to wait until the whole content is completely downloaded. For instance, an uncompressed AVI (Audio Visual Information) file that is only 40 seconds long may take over 20 minutes to download using a 56Kbps modem. Compare this with an AVI file that has been converted to a suitable streaming format and hosted on a streaming server, the clip would begin to play back during the downloading process. A streaming video file can be of virtually unlimited length, and can run over Internet using bandwidths between 56Kbps and upwards.
Applications such as video streaming are used in a variety of situations, bringing commercial benefits to companies such as content providers. For instance it can be utilized for sales demonstrations, training presentations, entertainment, publishing, advertising and news. In order to understand the effect of channel interference and noise in the quality of video streaming, we simulated and analyzed three different scenarios. The first scenario, shown in Figure 6-(a), consists of a network with no interference. The client and the server were connected to the access point by an RJ45 cable. The second scenario, shown in Figure 6-(b), was implemented with adjacent interference, which was caused by nearby laptops, mobile phones, neighbouring access points, and other devices that interfered with each other’s transmission.
Sender Receiver Linksys AP with router RJ-45 Cable RJ-45 Cable Receiver Ethernet Sender with Linksys
Adapter G
Figure 6-(a) Scenario 1: No interference Figure 6-(b) Scenario 2: Adjacent interference
The second scenario, shown in Figure 6-(b), was implemented with adjacent interference, which was caused by nearby laptops, mobile phones, neighbouring access points, and other devices that interfered with each other’s transmission.
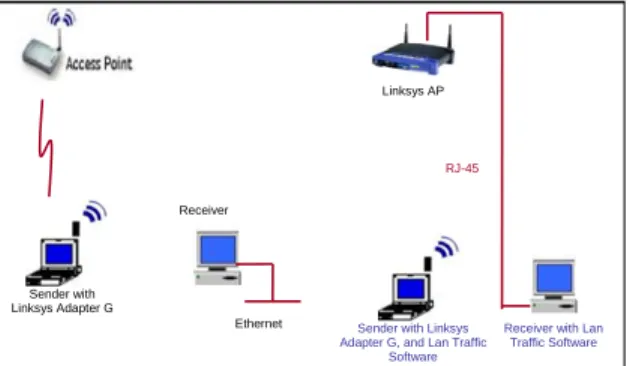
The third scenario is shown in Figure 7. There were two types of interferences; adjacent and co-channel interference. In this scenario, we had more interferences coming from running LAN Traffic in the background.
In the three scenarios, the client is streaming the video from the server and capturing it to analyze the output. The video is first captured while it is being streamed from the server and frames are randomly
Mode Condition Throughput (kbps)
Without Co-Channel Interference 9703.2
UDP
With Co-Channel Interference 8606.9
Without Co-Channel Interference 9096.7
TCP
Mohammed Boulmalf et al.
Performance characterization of IEEE802.11g in an office environment cubicles
7
extracted from the captured video (keeping a record of the frame numbers that are extracted). These frames are then converted into Gray scale images and the peak signal-to-noise ratio (PSNR) is then computed between the captured random selected frames and their original Gray-scale counterparts in each of the three scenarios then, the average PSNR is computed for all the frames of each scenario.
Receiver
Ethernet Sender with
Linksys Adapter G
Receiver with Lan Traffic Software RJ-45
Sender with Linksys Adapter G, and Lan Traffic
Software
Linksys AP
Figure 7. Scenario 3 (adjacent and co-channel interference)
The average PSNRs for the captured video in the three scenarios are 19.9 dB, 20.4 dB, and 24 dB, respectively for co-channel interferences, adjacent interferences, and without interferences. It is clear from the average PSNR values obtained that the signal quality is affected to a higher extent when the type of interference is co-channel and adjacent.
4 CONCLUSION
In this paper we have conducted a campaign of tests to characterize the performance of the IEEE 802.11 g in a typical cubical office environment. The throughput performance of UDP and TCP traffic were evaluated under different realistic operational scenarios. Our results showed that the performance IEEE 802.11g can be greatly degraded due to co-channel interferences especially for TCP traffic. In addition, we looked at how the video quality was affected when streamed over a WLAN in the presence of adjacent and co-channel interferences. The PSNR of a video frame was shown to be degraded by up to 13 dB in some cases due to interferences.
References
W. Carney. 2002."IEEE 802.11g New Draft Standard Clarifies Future of Wireless LAN". Wireless
Networking Business Unit, Texas Instruments, USA
Cisco. 2005. "Capacity, Coverage, and deployment considerations for 802.11g". Cisco systems, USA B.E. Henty. 2001. B. E. Henty. "Throughput Measurements and Empirical Prediction Models for
IEEE 802.11b Wireless LAN (WLAN) Installations". Master thesis, Virginia Polytechnic Institute
and State University. Virginia, USA.
C. Rose, S. Ulukus, R.D. Yates. 2002. "Wireless systems and interference avoidance". IEEE
Transactions on wireless Communications, pp.415-428.
Y. Zahur, M. Doctor, S. Davari, T. Andrew Yang. 2003. "802.11b Performance Evaluation". Proceeding of the 2nd IASTED International Conference Communications, Internet, and
Information Technology, Scottsdale, AZ, USA.
Broadcom, 2003. White paper: "IEEE 802.11g: The new Mainstream Wireless LAN standard". S. Gringeri, R. Egorov, K. Shuaib, A. Lewis, B. Basch. 1999. "Robust Compression and Transmission
of MPEG-4 Video". 7th ACM International Conference on Multimedia, October 30 - November 5,
1999, pp 113-120.
View publication stats View publication stats