HAL Id: hal-03149294
https://hal.archives-ouvertes.fr/hal-03149294
Submitted on 22 Feb 2021
HAL is a multi-disciplinary open access archive for the deposit and dissemination of sci-entific research documents, whether they are pub-lished or not. The documents may come from teaching and research institutions in France or abroad, or from public or private research centers.
L’archive ouverte pluridisciplinaire HAL, est destinée au dépôt et à la diffusion de documents scientifiques de niveau recherche, publiés ou non, émanant des établissements d’enseignement et de recherche français ou étrangers, des laboratoires publics ou privés.
SAPIUM: a generic framework for a practical and
transparent quantification of thermal hydraulic code
model input uncertainty
Jean Baccou, Jinzhao Zhang, Philippe Fillion, Guillaume Damblin,
Alessandro Petruzzi, Rafael Mendizabal, Francesc Reventos, Tomasz Skorek,
Mathieu Couplet, Bertrand Iooss, et al.
To cite this version:
Jean Baccou, Jinzhao Zhang, Philippe Fillion, Guillaume Damblin, Alessandro Petruzzi, et al.. SAPIUM: a generic framework for a practical and transparent quantification of thermal hydraulic code model input uncertainty. Nuclear Science and Engineering, Academic Press, 2020, 194, pp.721-736. �10.1080/00295639.2020.1759310�. �hal-03149294�
12 3 3
Jean Baccou , Jinzhao Zhang , Philippe Fillion , Guillaume Damblin , Alessandro
Petruzzi4, Rafael Mendizabal
5, Francesc Reventos
6, Tomasz Skorek
7, Mathieu
Couplet
8, Bertrand Iooss
8, Deog-Yeon Oh
9, Takeshi Takeda
10, Nils Sandberg
11 1Institut de Radioprotection et de Sûreté nucléaire (IRSN), PSN-RES/SEMIA, Centre deCadarache, 13115 St Paul-Lez- Durance, FRANCE jean.baccou@irsn. fr
2Tractebel (ENGIE), Boulevard Simon Bolivar 34-36, 1000 Brussels, BELGIUM [email protected]
3CEA, Université Paris Saclay, DEN/DM2S/STMF/LMES, F-91191 Gif-sur-Yvette, FRANCE [email protected]; [email protected]
4N.IN.E. - Nuclear and INdustrial Engineering S.r.l., Via della Chiesa XXXII, 759 - 55100 Lucca, ITALY
5Consejo de Seguridad Nuclear (CSN), 28040 Madrid, SPAIN [email protected]
6Universitat Politècnica de Catalunya (UPC), Avda. Diagonal 647, 08028 Barcelona, SPAIN francesc.reventos@upc. edu
7Gesellschaft für Anlagen- und Reaktorsicherheit (GRS) GmbH, Forschungszentrum , 85748 Garching, Germany
8EDF R&D, 6 Quai Watier, 78401, Chatou, FRANCE [email protected]; bertrand.iooss@edf fr
9Korea Institute of Nuclear Safety, 62 Gwahak-ro, Yusong-gu, Daejeon 34142, KOREA [email protected]
10Nuclear Regulation Authority
1-9-9, Roppongi, Minato-ku, 106-8450 Tokyo, JAPAN takeda. takeshi4695@gmail. com
nOECD Nuclear Energy Agency (NEA), 46, quai Alphonse Le Gallo, 92100 Boulogne-Billancourt, FRANCE
Nils. [email protected]
SAPIUM: a generic framework for a practical and transparent quantification
of thermal hydraulic code model input uncertainty
SAPIUM: a generic framework for a practical and transparent quantification
of thermal hydraulic code model input uncertainty
Uncertainty analysis (UA) is a key element in nuclear power plant (NPP) deterministic safety analysis using best-estimate thermal hydraulic codes and best estimate plus uncertainty (BEPU) methodologies. If forward uncertainty propagation methods have now become mature for industrial applications, the input uncertainties quantification (IUQ) on the physical models still requires further investigations. The OECD/NEA PREMIUM project attempted to benchmark the available IUQ methods, but observed a strong user-effect due to lack of best practices guidance. The SAPIUM project has been proposed towards the construction of a clear and shared systematic approach for input uncertainty quantification. The main outcome of the project is a first “good practices” document that can be exploited for safety study in order to reach consensus among experts on recommended practices as well as to identify remaining open issues for further developments. This paper describes the systematic approach that consists in five elements in a step by step approach to perform a meaningful model input uncertainty quantification and validation as well as some “good practice guidelines” recommendations for each step.
Keywords: Model Input Uncertainty, Quantification, Simulation Model, Thermal Hydraulics Code, Validation.
1. Introduction
Assessment of uncertainties associated with Best-Estimate (BE) calculations has become of prime importance in the so-called Best-Estimate Plus Uncertainty (BEPU) nuclear safety analyses. Following the recommendations from several OECD/NEA projects on uncertainty analysis methods (e.g., UMS [1] or BEMUSE [2],) the OECD/NEA PREMIUM benchmark [3] was organized as a frst step towards the development and application of model input uncertainty quantification (IUQ) methods. However, the analysis of PREMIUM Phases III and IV benchmark results [4] has shown a large dispersion between participants. One main reason could be attributed to the lack of common consensus and practices in the followed process and method [4].
Therefore, a new OECD/NEA project, SAPIUM (Systematic APproach for Input Uncertainty quantification Methodology), was proposed to progress on the development of a systematic approach for quantification and validation of the uncertainty of the physical models in thermal- hydraulic codes [5]. It was organized as a writing group. The contributors came from 10 organizations including Technical Support Organization (TSO), industry and university. The project lasted two years and a half (January 2017 - September 2019), and the final report was approved for publication on December 2019.
The objectives of the SAPIUM project were:
• To construct a systematic procedure (following different elements in a step by step approach) to perform a meaningful model input uncertainty quantification & validation; • To address the identified key issues for each step;
• To provide “good practice guidelines” recommendations on the used tools and methods; • To provide, if deemed necessary, simple illustration examples for application of the tools
To identify the open issues for future development.
The “good practice guidelines” document can be exploited for safety study to increase the agreement among experts on recommended practices as well as on remaining open issues for further developments. End users are both the developers and the users of BEPU approaches, as well as the organizations in charge of evaluating these approaches.
The systematic approach consists in 5 key
elements
[5], each element including several keysteps
to perform it, which have been already presented in [6]. We therefore just recall them in Fig. 1. The objective of this paper is to provide more details on the technical aspects of each element to guide a user to develop or apply an IUQ method following the approach (called the SAPIUM approach) proposed in the project.Figure 1. The 5 elements and key steps ofthe SAPIUM approach.
2. Elément 1 - spécification of the IUQ problem and requirements
As part of the BEPU methodology, the quantification of input uncertainty should start with a clear and concise specifcation of the problem. It consists in the defnition of the system responses quantities (SRQs) of interest and identification of the important physical phenomena for the intended applications, which are the frst steps of the BEPU methodology for transient and accident analyses [7]-[10], such as those included in the final safety analysis report (FSAR) [10]. This element provides recommendations and good practices for specifying the input uncertainty quantification and validation problem in the following three steps (1-3).
2.1. Step 1 - Spécification of the IU Q purpose
In this Step, the type of nuclear power plant (NPP) and the transient or accident scenario of interest are first specified. Specification of the IUQ objective is important because any given NPP type or transient scenario may be analyzed for different reasons. The specification influences the whole process of simulation model development, assessment, and analysis for each specifc transient scenario.
The application domain or the applicability of the IUQ is transient scenario-dependent because the dominant safety parameters and acceptance criteria differ from one scenario to another. Therefore, the transient scenario determines also the key phenomena and input uncertainties that must be quantified and validated. However, a complete scenario defnition is NPP type (e.g., PWRs, BWRs, or CANDU) specific or sometimes even plant specifc, because the dominant physical phenomena and their interactions differ in various reactor designs or specific plant configurations.
It is thus recommended to start the specifications according to the transient classification as documented in the FSAR of the targeted NPP [10], or in case of new plant design, to specify the application domain for the newly identifed transient scenario. In order to reduce the IUQ efforts for a simulation model for a specific application, it is recommended to group different transient scenarii into a category of transients with common SRQs, and to make a generic IUQ and validation for that class of transients.
2.2. Step 2 - Selection of system responses quantities (SRQs)
The selection of the SRQs should be made according to the objective of the IUQ study. For IUQ purpose, the chosen SRQs should be the parameters that are directly and accurately measured in the experiments. In most cases, this selection is straightforward, as they are directly related to the acceptance criteria as specified in the applicable rules, guides, design codes or standards for the transient scenario of interest.
In nuclear power plant FSAR [10], the acceptance criteria for the events of interest are defined in terms of quantitative fuel and reactor system design limits, such as reactor coolant system pressure or temperature limits, departure from nucleate boiling ratio limits, cladding or fuel temperature limits, etc. [11]. Thus, for FSAR accident analysis, SRQs are generally synonymous with criteria directly associated with the regulations, and their selection is usually a simple matter.
During simulation model development and assessment, a surrogate SRQ (i.e. a replacement of the SRQ by another measurable or predictable variable such that the respect of the limit on the surrogate SRQ will ensure the respect of the limit on the SRQ) may be of value in evaluating the importance of phenomena and processes. In such a case, justification for using a surrogate SRQ should be provided. For example, in small-break loss-of-coolant accidents (SBLOCAs), the peak cladding temperature (PCT) limit can be replaced by a reactor vessel collapsed water or mixture level limit.
In line with the surrogate SRQ, it is also important to consider other related performance measures in conjunction with the principle objectives. Because compensating errors in the simulation model can unintentionally lead to correct answers, additional performance measures serve as physical tracking points and additional proof of accuracy.
2.3. Step 3 - Identification of important phenomena (PIRT)
The involved physical phenomena for the concerned reactor components and Systems and the transient or accident scenario of interest are then identified. Since many physical phenomena and input parameters may be involved in any thermal hydraulic analysis, and they are not modelled in a simulation model (or computer code) at the same fidelity, it may be impractical to quantify the uncertainty for each phenomenon and each input parameter. Therefore, it is essential to rank the importance of the involved physical phenomena or input parameters.
The behavior of a specific plant and scenario is not equally infuenced by all the processes and phenomena that occur during a transient period. The most cost-effective but sufficient analysis reduces all potential phenomena to a manageable set by identifying and prioritizing phenomena according to their influence on the SRQs. Each phase of the transient scenario and the system components are investigated separately. The processes and phenomena associated with each component are examined. The cause and the effect are differentiated. Once the processes and phenomena are identified, they are ranked according to their impact on the relevant SRQs. The main product of the process described above is the so-called Phenomena Identification and Ranking Table (PIRT). The formality and complexity of this process should be coherent with the complexity and importance of the scenario under consideration.
The development and assessment of a simulation model regarding the IUQ activities should be based on a credible PIRT. The PIRT should be used to determine requirements for physical model or methodology development, scalability, validation, and sensitivity studies. In the end, the PIRT is used to guide any uncertainty analysis or to assess the overall adequacy of the model. The NPP accident scenario identification and IUQ defnition process can rely heavily on expert opinion and can be subjective. Therefore, iteration of the process, based on experimentation and analysis, is important. It is recommended to use the phenomenon identification and raking table (PIRT) technique ([12], [13]) to frst identify and rank the physical phenomena, and use the sampling-based global sensitivity analysis (GSA) technique to confirm the PIRT (also called Q- PIRT [14-16]).
The only open issue is the subjectivity of the highly ranked phenomena, which could be subject to the limitations of the knowledge of the expert, the experimental databases or simulation models. The Q-PIRT technique based on GSA could reduce this subjectivity. Iteration with other elements may be necessary if such limitations are identified during the SAPIUM approach.
3. Elément 2 - development and assessment of the experimental database
The objective of Elément 2 is the construction of the experimental database for the IUQ problem specified in Element 1. This construction relies on an efficient selection procedure of suitable experiments and associated tests from a large available database that can come from the test matrices used for thermal-hydraulic codes verification and validation (V&V).
3.1. Step 4 - Establishment of a list of available experiments and standardized description of
each experiment
The experiments in nuclear thermal-hydraulics are coming from basic tests, Separate-Effect Tests (SETs), Combined Effect Tests (CETs) and Integral-Effect Tests (IETs). In order to help at selecting an experiment, a set of criteria for a standardized description of an experiment should be defined. Table 1 provides an example of such a list.
Table 1.Test description.
Criteria/items Test name
(or number) Type (SET, IET, CET, ...)
Component and/or reactor if interest
Working fluid (steam water, simulant fluid ...), Material properties
Range of main parameters
pressure, mass flux, quality or void fraction, heat flux. Geometry
Scale (vertical scale, volume scale wrt component or NPP) Covered phenomena
Covered model
Validate complete system, subsystem, component Available measurements
Instrumentation (tool used for data measurement) Data access condition
Publications
Standardization of information of the tests has been already discussed in CSNI reports or in the literature. For example, the authors of [17] developed the idea to consolidate qualified databases (both experimental and code calculation results) through standardization, aiming to support the V&V activities of system codes and uncertainty methodologies. The database, called SCCRED (Standardized Consolidated Calculated and Reference Experimental Database) includes documentation such as the reference data set of the facility (description of the facility, instrumentation, physical properties of the material, evaluation of the pressure losses...) and of the associated tests (main phenomena investigated during the test, configuration of the facility,..).
3.2. Step 5 - Assessment of the adequacy of the database
In order to ensure the transparency of this element, a quantitative evaluation of the constructed experimental database should be performed. It is based on the computation of two indicators. The frst one, called representativeness, is related to the ability of an experiment to provide relevant information for model input uncertainty quantification and validation. The second one, called completeness, concerns the ability of a set of experiments to fulfl the whole specifcations of the problem under study e.g. cover the physical space of interest.
The adequacy assessment requires the introduction of a set of criteria to take into account the multicriteria nature of the problem [18]. These criteria should possess the following properties:
• Measurability of each criterion,
• Operationality of each criterion i.e. meaningfulness for the analysis to perform, • Capability of the set of criteria to cover all aspects of the problem,
• Non-redundancy of the set of criteria to avoid the problem of double counting.
The set of criteria should be also minimal (i.e. kept small as much as possible) to reduce the complexity of the analysis.
In the framework of IUQ, priority for representativeness criteria should be given to: • The separable nature of the experiment,
• The quality of the experimental data such as density of measurements, quality of Boundary and Initial Conditions (BIC) characterization, quality of measured fow parameters, availability and quantity of measurement uncertainty (i.e. how large the uncertainty is), capability to cover important physical phenomena/models of interest, sensitivity of measured parameters to phenomena and models of interest, repeatability, • The agreement between experimental and case study conditions with a focus on the
geometry and the BIC,
• The capability of the experiment to address different simulation scales (CFD, component- scale, system scale).
Once the representativeness criteria have been defned, the representativeness evaluation and the ranking of experiments can be handled by Multi-Criteria Decision Analysis approaches including
outranking methods [19] or Analytical Hierarchical Process (AHP) [20]. They are applied in two main steps. The first one is the construction of a decision matrix summarizing the analyst’s preferences i.e. a score characterizing the representativeness of each experiment relatively to each criterion is given as well as an importance coefficient associated to each criterion. The second one is the construction of a decision rule which can be used for combining (or aggregating) the information provided by the decision matrix to evaluate the representativeness and establish the final ranking.
Concerning the completeness of an experimental database, indices for assessing the maturity level of various issues within the VVUQ procedure for nuclear licensing can be exploited. In [21], the authors point out that such indexes should include three features, which are goodness of fit, complexity and coverage. However, since this SAPIUM element is restricted to the experimental database and not to the whole quantification process, the existing indices need to be adapted. It is advisable to frst consider for the construction of a completeness criteria the ratio between the convex hull (i.e. the smallest convex set that contains the experimental data) areas of the validation and application domains. A ratio close to 1 will reduce extrapolation when moving to the application domain. The spatial distribution of the experiments within the validation domain can be also interesting to take into account to avoid overweighting the influence of specific regions in the input uncertainty quantification. Several mathematical tools exist to check the uniformity of a spreading (e.g. [22] or [23]).
3.3. Step 6 - Sélection of the experimental database for the quantification and the validation
Classically, SETs are usually applied for quantification and validation is performed on the basis of IETs. CETs can be used also for quantification since inverse methods are now tailored to deal with this type of experiment involving several phenomena.
The main diffSculty concerns the situation with few experiments. It can happen in practice that the number of available experiments is too limited to perform a splitting between quantification and validation. In this case, all available experiments should be considered for the quantification step and the validation step should be adapted by following a cross-validation as described in Section 6.
4. Elément 3 - sélection and assessment of the simulation model
The simulation model (SM) should be developed such as to adequately predict the SRQs for the transients or accidents of interest for the test facility (or the plant) from Element 2, and the key input parameters should be identified based on their importance to the modelling of the scenario and their impact on the SRQs for the simulation model calculation. The physical models included in the simulation model and their degree of fidelity in predicting physical phenomena must be consistent with the conclusions of the PIRT process in Element 1 (i.e., high fidelity models should be included for the high or important phenomena). This element 3 consists in the following 3 steps (7-9).
4.1. Step 7 - Development and Assessment ofApplicability of the Simulation Modelfor Modeling all
the Tests of the Experimental Database (Nodalization Strategy and Model Options)
The process for assessing the applicability of the SM has the goal to demonstrate that the SM calculation results - obtained by the application of the best estimate code with the nodalization developed following the standard nodalization rules and techniques - constitues a realistic approximation of the reference behavior of a test facility. The process should take into account the effect of many different sources of approximations:
• The data of the reference test facility available to the code-user are typically non exhaustive to develop a perfect nodalization of the reference test facility;
• The code-user derives, from the available data, an approximated nodalization of the facility reducing the level of details of the simulated hardware;
• The code capability to reproduce the hardware, the systems (test facility or plant) and the actuation logic of the systems further reduce the level of detail of the nodalization.
The development of the process for assessing the applicability of the SM should include :
• the establishment of necessary requirements for the different aspects above mentioned, and
• the determination, whether or not those requirements are met by the SM for all selected experiments in the database.
The goal is to develop and obtain a qualified SM considering the comparison with the hardware data, the BIC and the time trends of relevant quantities. The process should distinguish at least between three main sub-steps:
1) demonstration of the geometrical fidelity of the nodalization,
2) demonstration of the achievement of the steady state, qualitative transient analysis and 3) quantitative accuracy evaluation.
Criteria for selecting relevant quantities in each of the above three sub-steps should be defned as well as the defnition of the assessment applicability requirements. If any requirement in any of the three sub-steps is not fulfilled, the process of assessment of applicability of the SM is not passed and the main elements of the SM should be improved. A new process should be then applied in full, i.e. all three sub-steps, to the modified SM.
It should be also emphasized that the three-steps process for assessing the applicability of the SM apply to all tests of the experimental database used for the input uncertainty quantification and validation and if the process fails for any of the test, the SM should be modified and improved and a new process should be applied to the modified SM for all tests of the experimental database.
4.2. Step 8 - Sélection of important uncertain input parameters (including nature of
uncertainties e.g. aleatory, epistemic) by sensitivity analysis
The models of complex physical systems, like the BE SM for conducting the safety analysis of NPP, are law-driven models characterized by the presence of balance equations and numerous correlations. As a consequence, those models are customarily over-parametrized (e.g. thousands of input parameters are needed to build a typical SM for NPP), as they may include more relevant laws than the amount of available data would support for the validation. For the same reason, those models may have also a greater capacity to describe the system under unobserved
circumstances (outside the ranges of dérivation of the corrélations - see the list of ‘sources of uncertainty’ - i.e. outside the validation domain), even though the crucial question remains the uncertainty of those predictions in respect to the reality.
In a perfect world, all model parameters are estimated from the data and ‘best’ parameter values as well as their ‘errors’ are derived. Unlikely, this situation does not apply to the complex physical models, like the BE SM for conducting the safety analysis of NPP for which the large part of the parameters and associated ‘errors’ cannot be estimated from the data.
When focusing on the selection of input parameters, it is important to make a clear distinction between 'important' parameters as those whose uncertainty contributes substantially to the uncertainty of the output results, and 'sensitive' parameters as those which have a signifcant influence on the output results. This distinction is in the type of analysis being conducted: global (that addresses parameter importance) and local (that addresses the parameter sensitivity) sensitivity analysis.
In practice, the
sensitivity analysis (SA)
process is an invaluable tool. It allows studying how the uncertainty in the output of a model can be apportioned to different sources of uncertainty in the model input [24]. In engineering studies, numerical model users and modelers have shown high interest in SA that takes full advantage of the development of computing equipment and numerical methods. The objectives of SA are numerous; one can mention model verification and understanding, model simplifying and factor prioritization. Finally, the SA is an aid in the validation of a computer code, the guidance of research efforts, or the justification of a system design in terms of safety. Depending on the information required by the study and the sensitivity analysis settings, different classes of methods can be defned [25].At the end of a sensitivity analysis, the analysts will hold a 'sensitivity ranking' of the input parameters sorted by the amount of influence each has on the model output. Disagreement among rankings by the various SA methods for parameters less sensitive is not of practical concern since these variables have little or no influence on model output. This last statement - ‘little or no influence on model output’ - might be false or completing misleading when an importance analysis (or better known as uncertainty analysis) has to be considered: in this situation given the practical difficulties/impossibilities to identify the uncertainty ranges (and even more PDF) of input parameters, the conclusions that can be drawn from the actual ranking might not be appropriate to estimate the uncertainty of the output model responses (it is for instance the case of a very low sensitive input parameter with a large range of uncertainty).
4.3. Step 9 - Construction and verification of error metrics (accuracy code/experiment) and
définition of a scale of accuracy for qualification of the simulation model
An error metric is the basis for comparing measured values with model predictions. Error metrics must be established during the setting-up of the qualification requirements phase of the SM and the primary consideration should be what the model must predict in conjunction with what types of data available from the experiment. Additionally, the metrics should provide a measure of agreement that includes uncertainty requirements, i.e. include estimates of the numerical and experimental errors.
A simple error metric is based on the expectation or the variance of the différence between experiment and model prediction. The SAPIUM report provides a description of other types of metrics as well as the requirements for the construction of an objective error fonction. The values of the metrics are then compared to selected thresholds-values requirements.
In carrying-out the assessment of adequacy of the SM, a range of tests (with different Boundary and Initial Conditions and at different scale) should be employed to demonstrate that the SM has not been tuned to a single test. For integral behavior assessment, counterpart tests (similar scenarios and transient conditions) in different experimental facilities at different scales should be selected. Assessments using such tests lead to information concerning scale effects on the models used for a particular SM.
Nodalization strategy and model option selection should be consistent between the experimental facility and similar components in the nuclear power plant. The selection of important uncertain input parameters (including nature of uncertainties e.g. aleatory, epistemic) should be conffrmed by sensitivity analysis methods, in order to reduce the subjectivity by expert judgement. Appropriate error metrics should be defned and verified for assessing the adequacy of the simulation model.
5. Elément 4 - model input uncertainty quantification
The information coming from Elements 2 and 3 to be treated by Element 4 is a set of couples simulation/experimental values associated to different tests and experiments, components, SRQs... It is exploited in this element to quantify input uncertainties using inverse methods.
5.1. Step 10 - Aggregation of the information coming from the different experiments of the
database and from the simulation model to be used in the “inverse propagation ”
Different couples simulated / experimental values can have different degrees of importance for the intended use. This degree of importance depends for example on the type of SRQs (Element 1), e.g. cladding temperature might be more relevant than quench time when focusing on safety studies, on the representativeness of each experiment of the database (Element 2) or on the assessment analysis performed in Element 3. It can be numerically taken into account through the assignment of weights to each data.
Nowadays, the most used inverse methods in the literature are probabilistic. These methods are based on the use of the so-called likelihood fonction, which is constructed from a database of responses, typically as a product of probability density fonctions (PDFs) evaluated on data points. A possibility to distinguish the importance of data is to assign the different weights (in the form of exponents) to the factors of the likelihood.
5.2. Step 11 - Quantification of model input uncertainties by “Inverse propagation ”
5.2.1. Inverse method categories
The construction of inverse methods is for sure the most addressed topic in the literature of input uncertainty quantification. Different categories of approaches arise in nuclear safety applications.
The simplest and the most widespread method of inverse quantification of model uncertainties is the quantification on the basis of separate effect tests (SETs), where singular measurements representing the phenomenon can be compared with associated simulated SRQ. In the case of CETs with multiple measurements representing the phenomena, advanced inverse methods are available; they have been studied in the OECD/NEA PREMIUM project [4]. A large majority of them are based on a probabilistic uncertainty representation. Depending on the statistical framework, two main types of methods can be distinguished: frequentist and Bayesian.
In the frequentist framework, the parameters to estimate are considered as fxed albeit unknown quantities. The solution of the inverse problem under the frequentist framework makes use of the maximum likelihood (ML) principle [26]. The alternatives to frequentist methods are Bayesian methods, based on the application of Bayes’ rule, which is a procedure for updating information ([27], [28], [29]). The information about the unknown input parameter previous to the obtainment of the SRQ values (i.e. the
a priori
or prior information) is captured in a probability distribution termed the prior distribution. Bayes’ rule then combines the information from SRQ values with the prior information to derive a posterior distribution. There is an important type of Bayesian inverse methods grouped under the name “Data Assimilation” (DA), which are devoted to solve IP for dynamic models (i.e. models describing the time evolution of a system). In DA, observational data are combined with the dynamical model in order to estimate parameters describing the state of the system, initial conditions, model parameters, etc.All the previous inverse methods offer a rigorous mathematical framework to treat the input uncertainty quantification. However, they rely on several assumptions that might be difficult to satisfy in presence of poor amount of information on uncertainties. To tackle this situation, a more empirical strategy can be combining forward uncertainty propagation and fulfillment of requirements on specific SRQ figure of merit such as a coverage rate or a maximum allowed deviation. It can be computationally costly since it requires performing several simulations. To circumvent this limitation, design of experiments (DoEs) can be exploited to reduce the number of simulations.
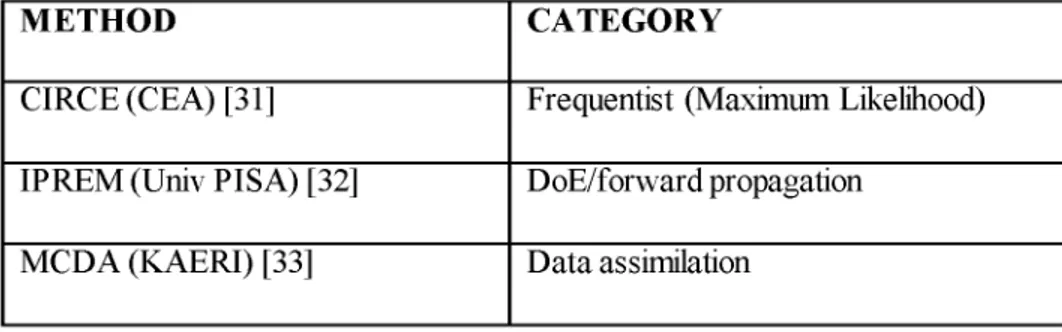
In the nuclear community, a growing number of model uncertainty quantification methods have been developed and applied in the last years, especially in connection with thermal-hydraulic system codes and thermo-mechanical ones. These methods rely on the different frameworks previously described. Table 2 summarizes the methods proposed in the nuclear safety field that most of them were applied, in the recent OECD/NEA PREMIUM project [30].
Table 2. Inverse methods applied in the nuclear thermal-hydraulics field.
METHOD CATEGORY
CIRCE (CEA) [31] Frequentist (Maximum Likelihood) IPREM (Univ PISA) [32] DoE/forward propagation
DIPE (IRSN) [34] DoE/forward propagation CASUALIDAD (NINE) [35] Data assimilation
IUQ (TRACTEBEL) [36] DoE/forward propagation
PSI [30] Bayesian
5.2.2. Characteristics of each method category
Frequentist and Bayesian methods offer a theoretical framework to quantify model input uncertainties. They allow including and modeling noise in the data. In many cases, the information about the noise is statistic. When the noise has a known probability distribution (e.g. Gaussian) these probabilistic methods are therefore adequate to beneft from such information. However, their construction relies on several assumptions related to uncertainty modeling and a careful check on the impact on the results should be performed to avoid any misleading interpretation. Frequentist and Bayesian methods allow both calibration and uncertainty quantification. If calibration is often performed during simulation model development, it is not recommended to recalibrate during the quantification according to the PREMIUM benchmark conclusions. The main reason is that if the experimental database is not adequate enough, the recalibrated calculation might be very different from the reference one and as observed in PREMIUM [4], when moving to an experiment not used in the quantification, uncertainty results might not encompass the experimental value.
The third category of methods is more empirical and is based on forward propagation and fulfllment of requirements on specifc SRQ figures of merit. By construction, contrarily to the two previous ones, it does not rely on a mathematical formulation of the inverse problem but seeks to adjust input parameter uncertainty by combining simulations with an updating process in an iteration loop. This category of methods strongly depends on the construction of the SRQ figures of merit and on the associated requirements. This last point involves expert judgment. However, these methods can be used in presence of poor knowledge on input uncertainties that would prevent from validating the underlying assumptions of frequentist and Bayesian approaches.
The choice of a method (category) to quantify input uncertainties depends on the problem under study. Because of the large variety of inverse methods, the main recommendation is obviously to clearly take into account the underlying assumptions of their construction and verify their coherence with the state of knowledge on input uncertainties. For example, since most methods are constructed in the probabilistic framework, they lead to the estimation of a probability distribution for each uncertain input parameter which might not always be affordable in practice due to incomplete state of knowledge. In this case, alternative uncertainty model could be used. For instance, the third category of methods (which is more empirical but is rooted in less assumptions than in the others) can be applied to derive uncertainty intervals. Concerning the choice of a mathematical model to represent uncertainties in agreement with the state of knowledge, although several works have been already proposed to treat the forward problem,
adaptation of frequentist or Bayesian inverse methods to alternative theory remains a challenging problem for nuclear applications. In particular, further investigations are required to tackle the problem of treatment of epistemic uncertainty by alternative theories in the framework ofIUQ.
5.3. Step 12 - Combination of model input uncertainties if several quantifications are
performed
In practice, different quantifications can be performed for different SRQs or group of experiments. It is common to distinguish three main kinds of synthesis to combine the results.
•
Conjunctive:
equivalent to take the intersection, conjunctive synthesis assumes the reliability of all quantifications, and allows exhibiting the conflict among the different results. It produces precise but potentially unreliable results in case of strong conffict, •Disjunctive:
equivalent to take the union, disjunctive synthesis makes the conservativeassumption that at least one quantification is reliable. It produces in general imprecise but reliable results,
•
Arithmetic
(weighted) mean: assumes independence between quantification results, and produces a result between disjunction and conjunction.In the probabilistic framework, the most commonly approach is based on a weighted average [37] to combine probability distributions. There exists a second approach constructed in the Bayesian framework [38] that requires specifying prior information. The construction can be also performed in the possibilistic framework ([39], [40]) that is appropriate to quantify a strong disagreement between quantification results meaning that the quantification should be iterated.
5.4. Step 13 - Confirmation by counterpart tests
Confirmation comes after input uncertainty quantification. It requires running a forward problem on the same experiment used for the quantification.
The first step exploits the set of quantifed input uncertainties. Such parameters are considered as input uncertain parameters for running the usual forward case. In the subsequent runs, SRQ values are calculated and their associated uncertainty bands are derived. This process is quite standard in nuclear applications.
The second step requires characterizing and quantifying the agreement between simulation and experimental results. A straightforward strategy is to verify if each experimental data is enveloped by the corresponding SRQ uncertainty band. There exist more complex confirmation indicators providing a deeper qualitative insight on the results. They are described in Section 6. 6. Elément 5 - model input uncertainty validation
The validation ([41], [42]) is based on a comparison between the simulated SRQs after the propagation of the quantifed input uncertainties and experimental results. However, it is important to keep in mind that an extended validation outside the experimental domain is necessary for reactor applications.
6.1. Validation experiments
The validation process first requires the availability of a set of experiments that will be used in the comparison. To perform a reliable validation, the experimental database should include different test scales.
Moreover, when the experimental database constructed in Element 2 is large, validation experiments should correspond to experiments which are not used for the uncertainty quantification. When the number of experiments is not sufficient to split the database, a leave- one-out cross-validation [43] can be performed. This process1 consists in iterating for each experiment of the database the following steps:
• Remove one experiment from the database,
• Quantify the model input uncertainties (Element 4) using the remaining experiments, • Validate on the removed experiment.
6.2. Step 14 - Détermination of numerical approximation and other input data uncertainties
for each validation case
Since the validation is performed in the SRQ space, one should first include all types of uncertainties.
In scientific computing, there exist three classes of uncertainty sources [44]:
• The first one is related to model inputs that include model parameters of closure laws considered by the SAPIUM approach but also geometry, boundary and initial conditions; • The second one is associated to the numerical approximation error such as space-time
discretization or iterative convergence errors;
• The last one concerns model form and includes all assumptions, conceptualizations, abstractions, approximations, and mathematical formulations on which the model relies. These other uncertainties are assumed to have been quantified elsewhere during the VVUQ process.
6.3. Step 15 - Uncertainty analysis based on input propagation
The most popular uncertainty analysis method is based on input uncertainty propagation. It has been used in the framework of nuclear safety analysis. It classically combines probabilistic modeling and Monte Carlo simulations [2]. It is applied following three main steps:
• Input uncertainty modelling and construction of input samples, • Input sample propagation through the simulation model, • Estimation of statistical analysis of interest such as percentiles.
1 Removing one experiment can artificially create a situation where extrapolation is required i.e. the removed experiment is outside the convex hull of the remaining ones or where the remaining subset of experiments has a low adequacy. It is therefore advisable to keep the same validation domain and to perform the cross-validation on sufficiently adequate subsets of experiments.
6.4. Step 16 - Comparaison between simulation and experimental results using validation
indicators
The difficulty to derive validation indicators for output uncertainties is essentially due to the different natures of the quantities to compare. For example, one might have to evaluate the discrepancy between an interval and an unique experimental value. The choice of a validation indicator should rely on an appropriate defnition of:
• The target quantity of validation (interval, CDF, ...),
• The important characteristics of the SRQ uncertainty to capture for validation.
There is an important literature ([45] for example) on the construction of validation indicators. In the sequel, we focus on some of them. The most straightforward indicator consists in checking whether experimental values fall in the uncertainty intervals. However, this type of indicator does not take into account the position of each experimental value inside the uncertainty interval and does not allow distinguishing between very different situations such as “all experimental values are located close to a bound of the interval” and “all experimental values are uniformly located” This suggests focusing on the percentage of experimental values falling in each sub - interval. It leads to a second type of indicator that is based on hypothesis testing. In this case, the indicator can be interpreted as a measure of the discrepancy between the observed situation and the expected one and a very large value (exceeding a given threshold) will indicate a poor agreement between the uncertainty results and the experimental information. In order to derive a validation indicator that has the same physical unit than the SRQ, Ferson et al [42] also introduce the so-called area metric. It is constructed as a distance in the space of probability distributions. Calibration indicators provide a comparison between simulation and experimental results but do not integrate for example the width of the uncertainty interval. A very large interval is more likely to encompass an experimental value but brings a limited amount of information. It is therefore recommended to take into account extra features such as the concentration of the information associated to the SRQ uncertainty. This concept can be found in several scientific felds ([46], [47], [37]) and is called informativeness in the case of uncertainty analysis. This indicator will measure the improvement (in term of information) of the SRQ uncertainty model compared to a model based on ignorance. From a practical point of view, a large value of this indicator indicates more precise information. The construction of this indicator can be performed following the probabilistic theory [37]. An extension of the informativeness as well as calibration concepts has been also developed in [40] in the framework of the possibility theory [39]. It has been used to analyze the participants’ contributions of the PREMIUM benchmark [4].
6.5. Step 17 - Iteration quantification/validation in a loop-approach if the acceptability is not
reached
The analysis of the validation results is based on an acceptability checking to evaluate if the quantified input uncertainties are suitable for the intended use. It requires the introduction of acceptability criteria. In particular, it involves the choice of acceptability thresholds that are related to the problem of interest and to the risk tolerance of the decision maker. This process cannot be formalized in a generic approach such as the SAPIUM one. However, it is worth mentioning that the thresholds depend on the type of validation indicators. In the case of the
unit-less indicators coming from the hypothesis testing framework, significance thresholds are available in the statistical literature to be able to reject the tested hypothesis. Their limitation to interpret validation results is that their use relies on strong assumptions on the number or the independence of validation data which are not always fulfilled in practice. In the case of the area metric, since it is expressed in the SRQ physical unit, the scale is based on experfs judgement. An important point to emphasize concerns the interpretation of the validation results with the objective of application to NPPs. Restricting the analysis to the acceptability of the values computed by the validation indicators is not satisfactory. An acceptable validation on an experimental database of low adequacy does not bring any information on the capability to move to reactor test case. An example comes from the PREMIUM project. Some participants quantified input uncertainties with high calibration and informativeness on the FEBA tests but received a very low calibration score when moving to PERICLES because FEBA database is not fully adequate for application to PERICLES. To avoid any misinterpretation, the validation indicator should therefore be combined with the adequacy of the experimental database. Such global indicators refer to the so-called predictive maturity indices or models ([21], [48]) and existing works should be adapted to the IUQ framework. Once such an indicator is defned, its evaluation can be carried out in a loop approach (quantification-validation) if the maturity is proved as not sufficient.
7. SCALING ISSUES AND PREDICTIVE CAPABILITY ASSESSMENT
The main concern of the predictive capability of uncertainty analyses is geometrical and thermal- hydraulic scaling. It means, if the identification and quantification of model uncertainties on the basis of selected experiments are valid for large scale geometry and range of thermal-hydraulic parameters characteristic for nuclear reactors. The problem of the up-scaling in the best estimate thermal-hydraulic simulations is a central problem in the nuclear reactor safety. This is a general problem and affect all activities in this field: experimental work as well as numerical analyses. This topic was a subject of intensive investigations and review of the activities and findings in this field was analysed in the frame ofOECD/NEA projects [49].
The dependency of interesting phenomena according to change of thermal-hydraulic conditions like pressure or temperature are usually known. It is a common practice to investigate the dependency of phenomena on thermal-hydraulic parameters for the full range of possible applications. The geometry of the experiments is mostly small-scale (or medium-scale) and rather only exceptionally equivalent to full-scale nuclear reactors. So, the problem of the up- scaling appears to be the main concern of the uncertainty analysis. Investigations performed in the past showed that the fndings obtained on the basis of small-scale experiments are applicable only partially for large scales.
The conclusion was that the scale-up effects are to be considered by the development of a qualified input data set for each reference (best estimate) calculation and by selection and quantification of uncertain input parameters. In particular, differences in uncertainties of physical models according to their application to different scale objects have to be taken into account. Other possibility to consider scaling effects is selection of different correlations according to their field of application. If there is such option in the physical model of the thermal-hydraulic
code, different correlations/constitutive équations may be applied for small and large scale facilities according to the recommendation in the code documentation. Such recommendations result from code development and validation and as such express the code developers state of knowledge concerning also the scaling effect.
The variation ranges of physical model uncertainties is the main way of scale-up effect consideration in uncertainty analyses. Since the quantification of model uncertainties takes place by comparison with experimental data, an appropriate selection of the adequate experiments is of importance. The preferable model uncertainties quantification is comparison of code predictions with experimental data from SETs. The experimental data selected for quantification have to be representative for the considered application. In particular they have to reflect the scale of the analysed facility. The optimal situation is, when there are available, SETs for the whole spectrum of scales where the model will be applied. The experiments considered by evaluation of scale effect underlay the same general requirements regarding adequacy to investigated phenomena and geometry and accuracy of experimental measurements, as applied for selection of tests for experimental data base as described in the Section 3.
The condition for a correct consideration of scale-up effects is to carry out carefully complete uncertainty and sensitivity analyses for each application. The results of uncertainty analyses for small scale facilities are important source of information and experience but cannot be directly transformed to large scale application [50]. The most important step by consideration of the scale-up effects is the identification and quantification of input uncertainties, in particular model uncertainties for large scale applications. Since some large scale separate effect experiments exist, the quantification can be performed in the best way on the basis of comparison with available experimental data. Once the model uncertainties have been quantified the propagation of the input uncertainties through the mechanistic codes enables carrying out the best estimate plus uncertainty analyses for any transient or accident in the field of the code application; also for events for which integral tests do not exist. This capability is a clear advantage of the uncertainty estimation method based on input uncertainties propagation (e.g. using Wilks’ formula [51]). However, it requires a proper quantification of input uncertainties and sufficient experimental basis of SETs or CETs for model uncertainties quantification.
In the case of lack of suitable experiments, the new trend is using CFD simulations as basis for evaluation of system codes models [52]. Application of CFD simulations instead of experimental data for uncertainties evaluation of 1 -D system code models is a relatively new option but of increasing importance. However, this approach frst requires performing a VVUQ analysis of the CFD simulation model.
Another aspect of the prediction capability is related to limitation of IUQ performed for a particular transient (specific approach contrary to generic approach). It can happen that in the course of uncertainty analysis the range of varied calculations extends the assumed range of parameters considered for development of experimental data base and following model uncertainties quantification. In such a case the frequently recommended best solution is performing iteration steps. Beginning with extension of the experimental data base, quantification and fnally validation of model uncertainties have to be performed once more.
The prédictive capability and more general safety of nuclear reactors rely on quality of extrapolation of the existing information to the fUl-scale application of nuclear reactors. As an ultimate measure of ensuring security of the safety analysis, lack of exact information on uncertainty of the upscaling to the full-scale NPP applications in nuclear reactor safety is compensated by application of safety margins.
8. Conclusions
Within the framework of the OECD/NEA SAPIUM project, a systematic approach for thermal hydraulic code model input uncertainty quantification and validation has been developed. It consists in fve elements in a step by step approach. For each step, the key issues to be addressed and recommendations on the tools and methods to be used have been discussed. This work contribues to the use of practical and transparent IUQ methods, since it offers a structured framework to construct and analyze them. It is expected that the SAPIUM report will guide the users in the future input uncertainty quantification and validation activities.
Open issues have been also identifed. Even if it is currently largely studied in the scientific literature, the construction of inverse methods should be further considered especially for problems with poor knowledge on input uncertainties and that would require alternative approaches to the methods recalled in this paper. Moreover, an important topic for future development concerns the quantitative evaluation of an experimental database adequacy in Element 2 and of the predictive maturity of quantifed input uncertainties in Element 5. This type of evaluation is necessary to ensure a transparent IUQ. The adequacy frst depends on the representativeness of each experiment of the database. If mathematical tools for multi-criteria analysis are available, collaborative exercises to defne relevant criteria of representativeness are recommended. The second component of adequacy is completeness. For this index also, a consensus should be found to specify the important characteristics of the experimental domain to take into account (e.g. ratio of the convex hulls, spatial distribution of the experiments). The same type of development is required for the definition of a predictive maturity index by exploiting the works of [21] and [48].
Besides the previous open issues that solving are necessary to provide to the analyst mathematical tools to perform each element of the SAPIUM approach, the interpretation of the validation results can be problematic and devotes a special attention for future activities. The difffculty can come from the limited number of available experiments that reduces the acceptability of the results in the experimental domain. There is up to now no clear strategy to deal with this situation. Another difficulty concerns the validation in the application domain. Frequently, there is a lack of suitable large scale experiments and the quantified input uncertainties need to be extrapolated. A possible way is, based on scaled integral test, extrapolation of behaviour of reactor systems from test facilities to the reactor safety analyses using system codes as extrapolation tools. But there is no mature extrapolation method which could be recommended.
NOMENCLATURE AHP BE BEMUSE BEPU BIC CDF CET CFD DoE FSAR IET IP IUQ GSA LOCA MCDA ML NPP PDF PIRT PREMIUM SAPIUM SBLOCA SET SM SRQ TH TSO UMS V&V VVUQ
Analytical Hierarchical Process Best-Estimate
Best-Estimate Methods Uncertainty and Sensitivity Evaluation Best-Estimate Plus Uncertainty
Boundary and Initial Conditions Cumulative Distribution Function Combined Effect Tests
Computational Fluid Dynamics Design of Experiments Final Safety Analysis Report Integral effects Test
Inverse Problem
Input Uncertainty Quantification Global Sensitivity Analysis Loss Of Coolant Accident Monte-Carlo Data Assimilation maximum likelihood
Nuclear Power Plant
Probability Density Function
Phenomena Identification and Ranking Table
Post-BEMUSE Reflood Models Input Uncertainty Methods
Systematic APproach for Input Uncertainty quantification Methodology Small-Break Loss Of Coolant Accidents
Separate Effects Test Simulation Model
System Responses Quantity Thermal-Hydraulic
Technical Support Organization Uncertainty Methodology Study Validation and Verification
Validation and Verification, Uncertainty Quantification ACKNOWLEDGMENTS
The authors are grateful to OECD/NEA for organizing this project, and to their respective organizations for supporting their participation in the SAPIUM project.
REFERENCES
1. OECD/NEA, “Report on the Uncertainty Methods Study” NEA/CSNI/R(97)35 (1998).
2. OECD/NEA, “BEMUSE Phase VI Report, Status report on the area, classification of the methods, conclusions and recommendations,” NEA/CSNI/R(2011)4 (2011).
3. T. Skorek, A de Crécy, “PREMIUM- Benchmark on the quantification of the uncertainty of the physical models in the system thermal-hydraulic codes”, Proceedings of CSNI Workshop on Best Estimate Methods
and Uncertainty Evaluations
,
OECD/NEA/CSNI/R(2013)8, Barcelona, Spam (2013).4. OECD/NEA, “PREMIUM Phase V report: Final Report”, OECD/NEA/CSNI/R(2016)18 (2017).
5. J. Baccou, J. Zhang and E. Nouy, “Towards a systematic approach to input uncertainty quantification methodology,” Proceedings of the NURETH-17 Conference
,
Xi’an, China (2017).6. J. Baccou, J. Zhang, et al., "Development of good practice guidance for quantification of thermal- hydraulic code model input uncertainty," Nuclear Engineering and Design, 354, 110173, (Available online 27 June 2019, 110173, DOI: https://doi.org/10.1016/j.nucengdes.2019.110173) (2019).
7. IAEA, “Deterministic Safety Analysis for Nuclear Power Plants.” IAEA Specific Safety Guide No. SSG-2. IAEA, Vienna (2009).
8. USNRC Expert group, “Quantifying Reactor Safety Margins: Application of Code Scaling, Applicability and Uncertainty Evaluation Methodology to a Large-Break Loss of Coolant Accident,” NUREG/CR-5249, USNRC (1989).
9. USNRC, “Transient and accident analysis methods,” Regulatory Guide RG-1.203, USNRC (2005).
10. USNRC, “Standard Format and Content of Safety Analysis Reports for Nuclear Plants,” Regulatory Guide RG 1.70, Rev. 2, USNRC (1978).
11. American National Standards Institute, “Nuclear Safety Criteria for the Design of Stationary Pressurized Water Reactor Plants,” ANSI/ANS N18.2 (1973), and ANS 51.1 (1988).
12. G. E. Wilson and B. E. Boyack, “The role of the PIRT process in experiments, code development and code applications associated with reactor safety analysis,” Nuclear Engineering and Design, Vtlume 186, Issues 1-2, Pages 23-37 (1998).
13. D. J. Diamond, “Experience Using Phenomena Identification and Ranking Technique (PIRT) for Nuclear Analysis,” Proc. PHYSOR-2006 Topical Meeting, Vmcouver, British Columbia, Canada, September 10-14 (2006) (BNL-76750-2006-CP).
14. H. Luo, Q. Wu and V Mousseau, “Quantified PIRT for Reactor System Safety Analysis Code Validation Using Characteristic Time Ratios”, Proc. NUTHOS-8, Shanghai, China, October 10-14 (2010).
15. R. P. Martin, “Quantifying Phenomenological Importance In Best-Estimate Plus Uncertainty Analyses,”
Nuclear Technology, \bl. 175, (2011).
16. J. P Yurko, and B. Jacopo, "Quantitative Phenomena Identification and Ranking Table (QPIRT) for Bayesian Uncertainty Quantification." 2012 International Congress on Advances in National Power Plants
(ICAPP '12), American Nuclear Society, Chicago, IL, June 24-28 (2012).
17. A. Petruzzi. and F. D'Auria, “Standardized Consolidated Calculated and Reference Experimental Database (SCCRED): A Supporting Tool for V&V and Uncertainty Evaluation of Best-Estimate System Codes for Licensing Applications”, Nuclear Science and Engineering, 182, pp. 13-53 (2016).
18. J. Malczewski, and C. Rimer, Multicriteria Decision Analysis in Geographical Information Science, Springer (2015).
19. B. Roy, Multicriteria Methodology for Decision Aiding, Kluwer Academic Publishers (1996).
20. T. Saaty, Decision Making for Leaders: The Analytic Hierarchy Process for Decisions in a Complex World, vol. Analytic hierarchy process series, RWS Publications (1982).
21. F. Hemez, H. Sezer and C. Unal, "Defining predictive maturity for validated numerical simulations," Computers and Structures, 88, pp. 497-505 (2010).
22. L. Pronzato and W. Muller, “Design of computer experiments: space filling and beyond”, Statistics and
Computing, 22(3), pp. 681-701 (2012).
23. G. Damblin et al., “Numerical studies of space-filling designs: optimization of Latin Hypercube Samples and subprojection properties”, Journal of Simulation, 7(4), pp. 276-289 (2013).
24. A. S altelli et al., Sensitivity analysis in practice: A guide to assessing scientific models, Wiley (2004). 25. B. Iooss and P. Lemaître, “A review on global sensitivity analysis methods”, in C. Meloni and G. Dellino,
editors, Uncertainty management in Simulation-Optimization of Complex Systems: Algorithms and
Applications, pp. 101-122 (2015).
26. E. Kuhn, “Maximum likelihood estimation in nonlinear inverse problems,” PhD Thesis of Paris Orsay (2003).
27. J.B. Nagel, Bayesian techniques for inverse uncertainty quantification. PhD Thesis, ETH Zürich, DISS. ETH NO. 24082 (2017).
28. J. Idier (Ed), Bayesian Approach to Inverse Problems, ISTE - Wiley (2008).
29. M. Dasht and AM. Stuart, “The Bayesian Approach to Inverse Problems”, chapter 10 of book R. Ghanem et al (eds), Handbook of Uncertainty Quantification, Springer (2017).
30. F. Reventos, et al., “PREMIUM: A Benchmark on the Quantification of the Uncertainty of the Physical Models in the System Thermal-Hydraulic Codes - Méthodologies and Data Review,” NEA/CSNI/R(2016)9, OECD (2016).
31. A. de Crécy, “CIRCÉ: A methodology to quantify the uncertainty of the physical models of a code”, CEA, STMF/LGLS (2012).
32. A. Kovtonyuk et al., “Development and Assessment of a Method for Evaluating Uncertainty of Input Parameters”, Proc. NURETH16
,
Chicago, USA (2015).33. J. Heo, K Kim, S.-W. Lee, “Validation and uncertainty quantification for FEBA, FLECHT-SEASET, and PERICLES tests incorporating multi-scaling effects,” Annals of Nuclear Energy 111, pp. 499-508 (2018). 34. J. Joucla and P. Probst, “DIPE: Determination of input parameters uncertainties. Methodology applied to
CATHARE V2.5_1”, Journal of Power and Energy Systems, 2(1), pp. 409-420 (2008).
35. A. Petruzzi, “The CASUALIDAD Method for Uncertainty Evaluation of Best-Estimate System Thermal- Hydraulic Calculations”, Nuclear Technology
,
205, pp. 1554-1566 (2019).36. J. Zhang et al., "Development of a Pragmatic Approach to Model Input Uncertainty Quantification for BEPU Applications”, Nuclear Technology
,
205(1-2), pp. 140-152 (2019).37. R.M. Cooke, Experts in uncertainty
,
Oxford University Press (1991).38. C. Genest and J.V. Zidek, “Combining probability distributions: a critique and an annoted bibliography”,
Statistical Science
,
1(1), pp. 114-148 (1986).39. D. Dubois and H. Prade, Possibility theory in information fusion
,
in G. D. Riccia, H. Lenz, and R. Kruse (Eds.), Data fusion and Perception, Vol. CISM Courses and Lectures N 431, 53-76.
Berlin: Springer Verlag (2001).40. S. Destercke and E. Chojnacki, “Methods for the evaluation and synthesis of multiple sources of information applied to nuclear computer codes”, Nuclear Engineering and Design
,
238, pp. 2484-2493 (2008).41. W.L. Oberkampf and M.F. Barone, “Measures of agreement between computation and experiment: validation metrics,” J. Comp. Phys.
,
217, 5-36 (2006).42. S. Ferson, W.L. Oberkamp and L. Ginzburg, “Model validation and predictive capability for the thermal challenge problem”, Comput. Methods Appl. Mech. Engrg.
,
197 (29), 2408-2430 (2008).43. H. Wackernagel, Multivariate Geostatistics
,
Springer (1998).44. C.J. Roy and W.L. Oberkampf, “A comprehensive framework for verification, validation, and uncertainty quantification in scientific computing,” Computer Methods in Applied Mechanics and Engineering
,
200(25-28), 2131-2144 (2011).45. Y. Liu, W. Chen, P. Arendt and H.-Z. Huang, “Toward a better understanding of model validation metrics”, J. Mech. Des., ASME Trans., 133(7), [071005], DOI: 10.1115/1.4004223133 (2011).
46. JCGM 200:212, “International vocabulary of metrology - Basic and general concepts and associated terms (VIM)” (2008).
47. T. Gneiting, F. Balabdaoui and A.E. Raftery, “Probabilistic forecasts, calibration and sharpness”, J. R.
Statist. Soc. B, 69 (2), 243-268 (2007).
48. W.L. Oberkampf, M. Pilch and T.G. Trucano, “Predictive capability maturity model for computational modeling and simulation”, SANDIA report, SAND2007-5948 (2007).
49. D. Bestion et al., “Astate-of the art report on scaling in system thermal-hydraulics applications to nuclear safety and design,” NEA/CSNI/R(2016)14, OECD (2017). .
50. T. Skorek, Uncertainty and Sensitivity Analyses of Experiment and NPP Accidents: Large Break LOCA at Cold Leg of Zion Nuclear Power Plant and Comparison with LOFT Test L2-5, Proc. the 13th Intern. Topical Meeting on Nuclear Reactor Thermal Hydraulics (NURETH13), Kanazawa, Japan, Sept. 27 - Oct. 2 (2009).
51. S.S. Wilks, “Determination of sample sizes for setting tolerance limits,” Ann. Math. Stat. 12, 91-96 ( 1941).
52. A. Lewis et al., “An information theoretic approach to use high-fidelity codes to calibrate low-fidelity codes,” J. Computational Physics