A Modular Methodology for the Development of
Urban Energy Planning Support Software
Najd OuhajjouPeter Palensky Matthias Stifter Energy Department
AIT Austrian Institute of Technology Vienna, Austria
Jessen Page
Institute of Systems Engineering University of Applied Sciences and
Arts, Western Switzerland Sion, Switzerland
Stefan Fenz A Min Tjoa
Institute of Software Technology and Interactive Systems
Technical University of Vienna Vienna, Austria
Abstract—Two-thirds of the overall primary energy in the
world is consumed in cities, resulting in 71 percent of all energy related greenhouse gas emissions. There are many ongoing initiatives to develop strategies to lower the high amount of emissions at the level of cities. However, energy planners face problems that are related to the complexity of the urban energy systems, encapsulating the components of the city together with their properties and interactions that are relevant to the planning process. The complexity of the problem increases given the unavailability of data and their multiple levels of detail (LOD). Therefore, there is a need for adequate tools to support the development of integrated energy strategies, defining specific quantifiable CO2 reduction measures to be implemented at the city level. In this research, we perform an analysis of urban energy planning processes. Then, we extract the general requirements of decision support in this discipline. Then, we perform a general data availability review in cities. This process results in formalizing a modular methodology for the development of urban energy planning support software. This methodology is specific to urban energy planning, it ensures the modularity of the development process, it leads to flexible software that operates under different available LODs of data, and it addresses the problem of data availability at the development stage.
Keywords—ontology; energy planning support; software development methodology; decision support; semantics
I. INTRODUCTION
Most of CO2 emissions come from cities where two-thirds of the overall primary energy is consumed [1] and that results in 71% of energy-related direct greenhouse gas emissions [2]. To remedy this situation, given the complexity of cities, it is important to develop integrated strategies that state which CO2-reduction measures are to be implemented. This requires a quantitative assessment of the impact of such strategies on the city in terms of indicators, such as the amount of the reduced CO2 emissions and the associated costs to the implementation of the strategies. Accordingly, there is a need for adequate computer tools that model the complexity of urban energy systems (UES) and run calculations to produce output that supports urban energy planners, at an early stage where less information is available to use simulation tools. Currently, the developed energy strategies mainly lack for information integration and the consideration of the interactions of all the concerned stakeholders.
As a state-of-the-art overview, there exists a variety of tools [3], [4], [5], [6], [7] that support urban energy planning
processes in different aspects. A more comprehensive review of such tools can be found in [8]. These tools differ from the energy planning support software that our methodology targets in the sense that they do not meet all the following criteria at once: (i) proposing a set of CO2-reduction measures that the user can select; (ii) inviting a variety of different stakeholders in the development of energy strategies; (iii) considering the impact of different CO2-reduction measures on each other in the assessment of energy strategies; (iv) flexibility of use given the available LODs of data in different cities. The importance of these main requirements in urban energy planning support software is explained in further details in Section III.
Concerning methodologies to develop such urban energy planning support software, there is less available literature. The methodologies range from general, such as agile software development methodologies [9] or agent based modeling methodologies [10], to more specific to the domain of our interest, such as applying agent based modeling to socio-technical systems [11]. The general methods are too broad, not giving a clear guidance on the specific tasks to be achieved. The other methods are more specific to urban energy planning software; however, the scope of their target software is different from the one we discuss in this research. Other methodologies, such as the one adopted in SEMANCO [12], intersect with this research in the sense that it is based on using ontologies for information integration. However, the development approach in SEMANCO is different since it is based on case studies of three different cities to identify the scope and requirements of what they call carbon reduction tools in urban planning. Whereas the methodology in this paper is use-case oriented (each use case represents a specific CO2-reduction measure), it supports a specific urban energy planning process [13], and puts a special emphasis on the modularity of the development process.
We summarize the problems we are solving in this research in the following points: (i) Modeling the complexity of UES that contain a large number of components and interactions. (ii) Coping with the problem of LODs of data and data availability in cities. (iii) Defining integrated calculation methods for the assessment of the impact of energy strategies. This article defines a modular methodology to develop an urban energy planning support tool. In Section II, urban energy planning processes are discussed. In Section III, aligned with the findings in Section II, the general requirements that need to be present in an urban energy
planning support software are extracted. In Section IV, data availability and the LODs of data in different cities are discussed. In Section V, a methodology to develop urban energy planning support software is presented.
II. THE URBAN ENERGY PLANNING PROCESS
We refer with urban energy planning to the processes that result into developing energy strategies, where it is stated which CO2-reduction-measures to implement, in what quantities, and at what time horizon, with the objective to reduce CO2 emissions at the level of a city. In this text, the terms measures and CO2 reduction measures are interchangeably used.
There are many urban energy planning processes that are implemented worldwide, depending on the specificities of their contexts. In this research, we focus on the sustainable energy action plan (SEAP) process [13]. It is a reference process in Europe (by February 2013, it had been adopted by 4332 signatories [14]). It is a flexible process, not bounded to any specific regulations, and it considers the planning process within its global context.
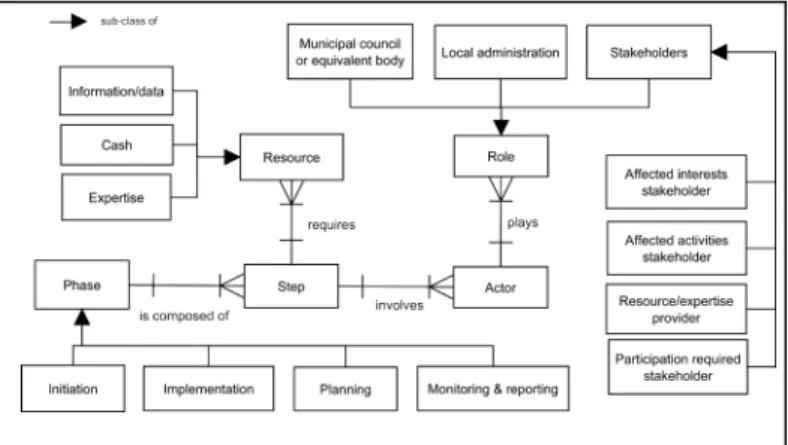
The main components of the SEAP process are phases, steps, resources, actors and their roles. We illustrate the structure of the SEAP process through its meta-model that we have derived, as shown in Fig. 1. The process is structured in four phases: initiation, planning, implementation, and finally monitoring & reporting. Each phase is composed of a number of steps, each of which requires resources and involves a certain number of actors.
The part of the SEAP process belonging to the scope of our interest is the planning phase, as it results in the development of an energy strategy, and requires computational support. The planning phase starts by an assessment of the current situation of the city, which leads to a CO2 emissions’ inventory that shows the different sources of energy and their breakdown over the main sectors (e.g. buildings, transport, industry, etc). Then, a vision is established in terms of quantifiable objectives that the city aims to reach, such as a certain percentage of CO2 emissions’ reduction. Finally, an energy strategy is defined based on the current situation of the city in order to reach the targets that are defined in the vision.
Fig. 2 presents the structure and the main constituting blocks of the energy strategies that are developed within the planning phase of the SEAP process. An energy strategy is composed of a set of measures, i.e. quantifiable actions with a certain potential to reduce the CO2 emissions at the level of the city. Each measure is bound to an implementation sequence, which states what quantity of the measure is to be implemented at what time horizon. For example, installing solar photovoltaic (PV) modules on buildings is a measure. It can have an implementation sequence of 100,000 m2 each decade from 2020 until 2050. The implementation of an energy strategy results in an impact on the city that is measured through a predefined set of key performance indicators (KPIs), such as CO2 emissions and costs. The evaluation of a strategy is achieved by comparing its resulting KPIs against its objectives defined in the vision phase.
Fig. 1. SEAP process meta-model
III. GENERAL REQUIREMENTS OF DECISION SUPPORT IN
URBAN ENERGY PLANNING
In this section, the main requirements of an urban energy planning support software are derived, based on findings of the previous section. The focus is to capture the main requirements that enable developing an energy strategy as described in Fig. 2, taking into consideration the constraints of the process we illustrate in Fig. 1.
A. Diversity of Actors
Developing an energy strategy requires the collaboration of several actors from different fields of expertise, as shown in Fig. 1. The actors that take part in this process have different views of the problem and expect a support that is specific to their point of view. The planning support software is supposed to be usable by all the actors and explicitly implement their points of view.
B. Input Flexibility
Information and data collection is of a special interest in the SEAP process, where data and information are considered to be resources that ensure the success of the process. Some actors within the process may have dedicated roles as data/information providers. Cities have no common standards in terms of data availability. Thus, available data may differ from one city to another. The target planning support software discussed in this research must therefore be flexible in terms of data input. It shall be used in different LODs depending on the context where it is used. We address the data availability problem and LODs of data in more details in the next section. C. Measures Integration and Resources Negociation
The assessment of the impact of an energy strategy depends on the integrated assessment of the impacts of its constituting measures. Indeed measures impact on each other and this needs to be considered when assessing the overall performance of an energy strategy (Fig. 2 highlights that we are interested in an assessment at the strategy level, not at the level of single measures). Measures can impact on each other in a causal way, e.g. introducing electric vehicles will increase electricity demand, reducing the production of waste will also reduce the energy available from incineration, introducing a
Fig. 2. Energy strategies structure
large amount of PV will require interventions on the local electricity grid. On the other, hand measures can compete over limited available resources, e.g. PV modules and solar thermal collectors will compete for a limited available roof area. D. Quantifiability of the Impact of Strategies and Alignment
With Objectives
The assessment of the impact of energy strategies shall be quantifiable and comparable to predefined objectives. Fig. 2 shows that an energy strategy implements objectives that are defined prior to the beginning of this activity. Therefore, the assessment of all measures shall obey to a common output format that is comparable to the predefined objectives. We note that each measure can also have an additional output that is specific to its context and that addresses particular needs of the actors that it involves.
IV. DATA AVAILABILITY AND LEVELS OF DETAIL
This research considers data from seven different cities: Vienna, Linz, Amstetten and Nanchang, in the context of smart city projects [15] where we collected data to develop energy strategies. Moreover, we have used a publically available report on accessible energy data, by SEMANCO [16], from North Harbour (Copenhagen), Newcastle-upon-Tyne and Manresa.
In the case of Vienna, Linz, Amstetten, and Nanchang, the collected data is categorized into two groups: city CO2 emissions’ inventory related data [13], and measure-related data. The inventory data are mainly energy consumption and supply data, their breakdown per sector, and other data that take part in the calculations of the carbon footprint of the city. The availability of these data is correlated to the granularity of their breakdown, i.e. the smaller the granularity is, the harder it is to obtain the data. For example, it is easier to find energy consumption data at the level of the city than a specific building. The measure-related data are relatively less available, as they are directly used in calculations, where it is required to have higher LODs of data that need to be more accurate and consistent with the rest of data.
Concerning the data availability analysis conducted by SEMANCO on North Harbour (Copenhagen), Newcastle-upon-Tyne, and Manresa [16], data have been collected for all the three cities and categorized in eleven groups. An evaluation of the availability, reliability, relevance, and other
TABLE I. DATA AVAILABILITY COMPARISON NORTH HARBOUR, NEWCASTLE,MANRESA
Data category parameters Number of Percentage of similarities a
N.Hb NCL MNR N.H NCL MNR Energy 5 6 2 0% 0% 0% Energy cost 2 0 2 50% 50% Climatic 6 4 3 33% 50% 33% Building technical 4 30 32 50% 23% 25% Geographical 0 6 6 - 0% 0% Land use 4 0 8 0% - 0% Urban planning 1 0 6 0% - 0% Socio-economic 6 14 3 33% 0% 67% Demographic 4 0 7 100% - 57% Legislative constraints 0 0 1 - - 0% Not classified 0 5 6 - 0% 0%
All data together 32 65 76 34% 14% 21% a. the number of similar parameters in one city data collection compared to the other two cities
divided by the total number of parameters in the data collection of the city in question b. N.H:Nourth Harbour(Copenhagen); NCL: Newacastle; MNR: Manresa
criteria is provided for each data type. We note that the data availability and reliability is different depending on the data type and the city.
Based on the data analysis of the considered cities, we conclude that: (i) data availability is different from a city to another. TABLE I. shows the number of parameters in the data collection that has been performed by SEMANCO for North Harbour, Newcastle-upon-Tyne, and Manresa as well as the percentage of similarities among the parameters of each of these cities and the two remaining ones. In the case of Vienna, Linz, Amstetten, and Nanchang, there was an attempt to collect data to feed a specific tool (227 CO2 emissions inventory-related parameters and 44 are measure-related ones). The data collection in the latter did not lead to obtaining the same data for all of these cities. Assumptions were made to compensate for the scarcity of data. (ii) Developing detailed energy strategies is directly related to the LOD of the available data. Low LODs of data lead to a broader, less-specific energy strategy. In other cases, assumptions about data have to be made, therefore, the accuracy of the energy strategies depends on the accuracy of the assumptions. (iii) The availability of data is influenced by their LODs. The higher the LOD is, the less available is the data.
Within the analyzed data, we can distinguish two main dimensions in the LOD of data that are critical to the calculations of the impact of the energy strategies. The first dimension is related to the LOD of data in space. Energy strategies comprise a number of measures that are implemented in a spatial context, e.g. installing solar PV requires spatial data, such as the solar radiation and the orientation of roofs. The second dimension is related to the LOD of data in time. This LOD defines the precision of data with regard to its temporal distribution. Using the same example of solar PV, we notice that the solar radiation is not only related to space but also to time. The solar radiation of a
roof can be an annual value or more detailed in the form of a daily profile.
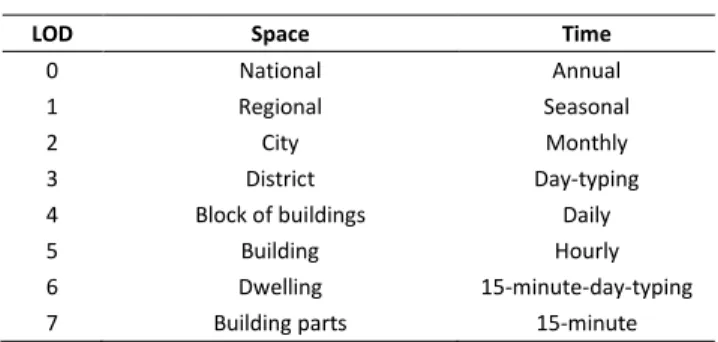
Within the analyzed data collection, we have classified the LODs of data as shown in TABLE II. The different LODs of data in time are in the range [annual, seasonal, monthly, day-typing, daily, hourly, 15-minute-dayday-typing, 15-minute]. The different LODs of data in space are in the range [National, City, District, Block of buildings, Building, Dwelling].
We note that the list of the extracted LODs of data is not an exhaustive one. The findings in TABLE II. are based only on the data we have considered in this research, including Vienna, Linz, Amstetten, Nanchang, North Harbour (Copenhagen), Newcastle, and Manersa. We also note that the data collection for the four first cities was driven by the data requirements of a decision support tool that has been developed in the context of Smart Cities - FIT for SET [15]. Therefore, the data that we considered in this review is not an exhaustive collection. Accordingly, more LODs may be extracted if more data is considered.
It is also important to mention that not all data can be classified in terms of these LODs. There are data that are space and/or time independent. For example, the CO2 emissions factors of fuels are not related to any LODs in space nor in time. Data availability, including LODs of data, conditions the process of developing energy strategies. Therefore, the software that supports urban energy planning is affected as well by this problem and it shall take data availability and LODs of data into consideration, as we have discussed in the previous section.
V. AMODULAR METHODOLOGY FOR THE DEVELOPMENT OF ENERGY PLANNING SUPPORT SOFTWARE
We present in this section a modular methodology for the development of urban energy planning support software, aligned with the findings in the previous sections. This methodology is structured in five iterative phases, each of which has an objective, an iteration granularity, a set of activities, and involved actors (excluding developers). We present below the different phases of the methodology in their sequential order, where an iteration of a phase can start only if at least one iteration of the previous phase is complete. A. Scoping Phase
The objective of this phase is to determine the scope of the decision support software in terms of measures it provides support for. Each measure is further detailed to define its number of perspectives, which is defined by the number of actors that are affected by the potential application of the measure. The granularity of an iteration within this phase is measure-based i.e. the activities of this phase can be iteratively conducted measure by measure. The activities of the scoping phase are listed below, in a sequential order:
• A1: Define the measure to be implemented • A2: Identify the involved actors
• A3: Identify the roles of the actors
TABLE II. CLASSIFICATION OF LODS OF DATA
LOD Space Time
0 National Annual
1 Regional Seasonal
2 City Monthly
3 District Day-typing
4 Block of buildings Daily
5 Building Hourly
6 Dwelling 15-minute-day-typing
7 Building parts 15-minute
• A4: List the main questions that different actors raise in each of the roles they play
• A5: Break the questions down into quantifiable sub-questions
B. Data Modeling Phase
The objective of the data modeling phase is to formalize the semantics of the UES that is within the scope of interest defined in the previous phase. The granularity of the iterations in this phase is related to the main questions that are defined in Activity A4. Iterations within this phase can be conducted on each single main question, before it is broken down to sub-questions. The involved actors are (i) the same ones that specifically asked the questions in the previous phase, (ii) any stakeholders that play the role of data providers, and (iii) domain experts that are able to provide calculation methods to reach the expected answers for the sub-questions in Activity A5. The activities that are conducted in this phase are the following:
• B1: Define the expected output/answers to the questions breakdown (defined in A5 )
• B2: Define calculation methodologies to reach the expected output
• B3: Extract semantics from the questions, output, and calculation methodologies
• B4: Extract time/space LODs from the semantics • B5: Data availability check for potential re-use of
existing ontologies/data models
• B6: Classify the semantics into their corresponding hierarchies, LODs, and properties
• B7: Formalize the semantics into an ontology. C. Interactions Modeling Phase
The objective of this phase is to integrate the different calculations that are triggered to calculate outputs for different questions and to ensure that they are consistent with regard to each other. The granularity of the iterations in this phase is related to the main questions that are defined in activity A4. The actors that participate in the interactions modeling phase are mainly the domain experts that defined the calculation methods in Activity B2. The sequence of activities that are required in this phase goes in the following order:
• C1: Extract the list of the physical components and their properties
• C2: Define the interactions between all the modeled physical components
• C3: Check for circular dependencies, where an interaction loops back to the initial trigger
• C4: Define the interaction protocols
• C5: Adjust calculation methods to integrate the interaction protocols
• C6: Formalize the component interactions and interaction protocols and integrate them into the ontology (formalized in activity B7).
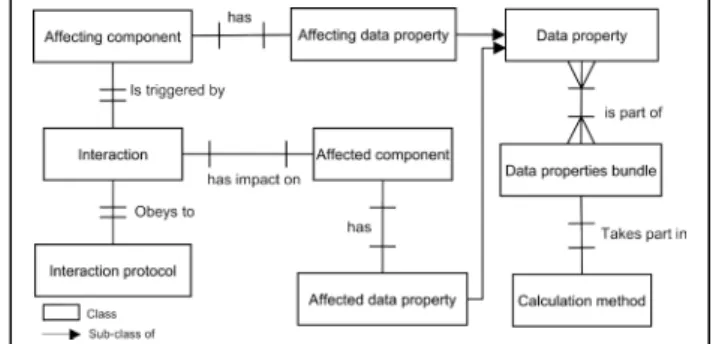
Fig. 3 summarizes the elements that are captured in the interactions modeling phase and indicates how an interaction is related to calculation methods.
D. Decisions Modeling Phase
The objective of the decision modeling phase is to capture the knowledge of decision makers regarding the interpretation of the output we define in activity B1. The granularity of iterations in this phase is related to the main questions we define in Activity A4. The actors involved in this phase are those that define the questions of Activity A4. They are decision makers that have the required knowledge to interpret the output we define in Activity B1 and make decisions accordingly. The following activities take place in each iteration within the decision modeling phase:
• D1: Define the output ranges
• D2: Define relevant output range combinations
• D3: Associate potential decisions that correspond to output ranges/output range combinations
• D4: Extract semantics associated to output ranges and decisions
• D5: Define inference rules for the decision classes • D6: Formalize and integrate into the ontology: the
output ranges, output range combinations, their associations to potential decisions and inference rules for the decision classes.
Taking solar PV as an example measure, one of the actors that are involved is the building owner. One of the questions this latter has is “Does it pay off to install PV on my building(s)?” broken down into two sub-questions (i) “How long is the payback time?” (ii) “How much is the annual revenue?” The output ranges are defined in terms of payback time and annual revenue and are assigned interpretations such as low, medium, high. Then it is defined what decisions a building owner would make in the cases of a finite number of combinations output ranges e.g. (payback time high; annual revenue high) is assigned the decision “install PV”.
Fig. 4 summarizes the main elements that are captured in the decision modeling phase and that need to be integrated
Fig. 3. Components interactions model
into the ontology gradually developed through the different phases.
E. Software Development Phase
The objective of this phase is to implement an application layer that exploits the ontology formalized in the previous phases. The actors that are involved in the software development phase are the users of the targeted decision support software i.e. actors that have formalized the questions in Activity A4. The granularity of iterations in this phase is also related to questions defined in Activity A4. The sequence of activities in this phase is the following:
• E1: Define use cases of the planning support software • E2: Define the workflow of events of each use case • E3: Design the system architecture
• E4: Design the system interface • E5: Implement the solution • E6: Test the solution • E7: Deploy the solution
• E8: Verify the solution’s deployment
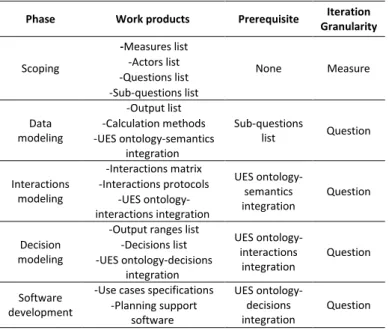
TABLE III. summarizes the main phases of the developed methodology. We also list the main artifacts that are produced in each phase and specify which of them are prerequisites for which phase. We note that an iteration of a phase can start only when one iteration of the previous phase is complete.
VI. DISCUSSION AND CONCLUSION
The presented methodology addresses the specific problems that developers face in the field of urban energy planning. This issue has been considered in this methodology by adopting a widely used energy planning process ( the SEAP process [13]) as a basis. We have derived a meta-model from the SEAP process to extract the general requirements that an urban energy planning support software shall meet. This methodology takes four main requirements into consideration. (i) The diversity of actors is considered in by identifying actors at the scoping phase, which allows designing software that can be used from different perspectives. We structure the development process in terms of questions (perspectives of different users) that are gradually implemented.
Fig. 4. Output-ranges based decision modeling
(ii) Input flexibility is considered in the methodology at the data modeling phase. Several calculation methods that require data with different LODs are captured. A mapping between question, LODs of data, calculation methods and output is made. It is thereby transparent which questions can be answered, what output is produced as an answer to these questions, using which calculation methods. (iii) Measures integration and resources negotiation is considered in the interactions modeling phase. An interaction matrix for the whole UES is developed to integrate the different calculation methods that are considered within the system. (iv) The quantifiability of the impact of strategies and alignment with objectives is considered in the scoping, data modeling, and software development phases. During the scoping phase, an iteration is completed only once a list of quantifiable sub-questions is obtained. In the data modeling phase, several calculation methods are defined to reach a quantifiable output in the case of low data availability in higher LODs. In the software development phase, use case specifications model the workflow of events, double-checking that the output of events are compared to objectives.
TABLE III. WORK PRODUCTS OF THE DEVELOPED METHODOLOGY
Phase Work products Prerequisite Granularity Iteration
Scoping -Measures list None Measure -Actors list -Questions list -Sub-questions list Data modeling -Output list Sub-questions list Question -Calculation methods -UES ontology-semantics integration Interactions modeling
-Interactions matrix UES ontology-semantics integration Question -Interactions protocols -UES ontology-interactions integration Decision modeling
-Output ranges list UES ontology-interactions integration Question -Decisions list -UES ontology-decisions integration Software development
-Use cases specifications UES ontology-decisions
integration Question -Planning support
software
This methodology is structured in such a modular way in order to cope with the size of the problem to be is modeled. The integrated scoping phase within the methodology allows high flexibility in terms of development efforts. A working software can be obtained earlier, with the possibility to enlarge the scope later on, i.e. it is possible to use this methodology to design an urban energy planning support software that considers fewer measures at the beginning and gradually expands to include more measures.
As future work, we plan to use this methodology to develop an urban energy planning support tool that considers solar PV and building refurbishment. It will allow us to test and refine the methodology based on the lessons learned.
ACKNOWLEDGMENT
The authors would like to acknowledge Amin Anjomshoaa and Johannes Kathan for the valuable discussions that have been very beneficial to this research.
REFERENCES
[1] J. Keirstead, N. Samsatli, N. Shah, and C. Weber, “The impact of CHP (combined heat and power) planning restrictions on the efficiency of urban energy systems,” Energy, vol. 41, no. 1, pp. 93–103, May 2012. [2] IEA, “World Energy Outlook 2008,” IEA. [Online]. Available:
http://www.iea.org/weo/2008.asp. [Accessed: 09-Mar-2012]. [3] P. Waddell, “UrbanSim: Modeling urban development for land use,
transportation, and environmental planning,” J.-Am. Plan. Assoc., vol. 68, no. 3, pp. 297–314, 2002.
[4] D. Robinson, F. Haldi, J. K\ämpf, P. Leroux, D. Perez, A. Rasheed, and U. Wilke, “CitySim: Comprehensive micro-simulation of resource flows for sustainable urban planning,” in Proc. Building Simulation, 2009. [5] L. Girardin, F. Marechal, M. Dubuis, N. Calame-Darbellay, and D.
Favrat, “EnerGis: A geographical information based system for the evaluation of integrated energy conversion systems in urban areas,”
Energy, vol. 35, no. 2, pp. 830–840, Feb. 2010.
[6] M. Kwartler and R. N. Bernard, “CommunityViz: an integrated planning support system,” Plan. Support Syst., pp. 285–308, 2001. [7] J. Keirstead, N. Samsatli, and N. Shah, “Syncity: an integrated tool kit
for urban energy systems modelling,” Energy Effic. Cities Assess. Tools
Benchmarking Pr., p. 21, 2010.
[8] D. Connolly, H. Lund, B. V. Mathiesen, and M. Leahy, “A review of computer tools for analysing the integration of renewable energy into various energy systems,” Appl. Energy, vol. 87, no. 4, pp. 1059–1082, Apr. 2010.
[9] A. Borg, K. Sandahl, and M. Patel, “Extending the OpenUP/Basic Requirements Discipline to Specify Capacity Requirements,” in
Requirements Engineering Conference, 2007. RE ’07. 15th IEEE International, Oct., pp. 328–333.
[10] E. Bonabeau, “Agent-based modeling: Methods and techniques for simulating human systems,” Proc. Natl. Acad. Sci. U. S. A., vol. 99, no. Suppl 3, pp. 7280–7287, 2002.
[11] K. H. van Dam, “Capturing socio-technical systems with agent-based modelling,” Delft University of Technology, Delft, the Netherlands, 2009.
[12] L. Madrazo, Á. Sicilia, and G. Gamboa, “SEMANCO: Semantic Tools for Carbon Reduction in Urban Planning,” in European Conference on
Product and Process Modeling, Reykjavik Iceland, 2012.
[13] E. Commission and others, “How to develop a Sustainable Energy Action Plan (SEAP)–Guidebook,” Publ. Off. Eur. Union Luxemb., 2010. [14] “Covenant of Mayors.” [Online]. Available:
http://www.covenantofmayors.eu/index_en.html. [Accessed: 26-Apr-2013].
[15] “Smart Cities - FIT for SET | FFG.” [Online]. Available: http://www.ffg.at/smart-cities. [Accessed: 28-Mar-2012].
[16] V. Corrado and I. Ballarini, “Report on the Accessible Energy Data,” SEMANCO, Apr. 2013.