www.the-cryosphere.net/9/1481/2015/ doi:10.5194/tc-9-1481-2015
© Author(s) 2015. CC Attribution 3.0 License.
Recent changes in north-west Greenland climate documented by
NEEM shallow ice core data and simulations, and implications for
past-temperature reconstructions
V. Masson-Delmotte1,*, H. C. Steen-Larsen1,*, P. Ortega1,a, D. Swingedouw2, T. Popp3, B. M. Vinther3, H. Oerter4, A. E. Sveinbjornsdottir5, H. Gudlaugsdottir5, J. E. Box6, S. Falourd1, X. Fettweis7, H. Gallée8, E. Garnier9, V. Gkinis3, J. Jouzel1, A. Landais1, B. Minster1, N. Paradis1, A. Orsi1, C. Risi10, M. Werner4, and J. W. C. White11
1LSCE (UMR CEA-CNRS-UVSQ 8212/IPSL), Gif-sur-Yvette, France
2UMR CNRS 5805 EPOC, OASU, Université Bordeaux 1, 33615 Pessac, France 3Centre for Ice and Climate, University of Copenhagen, Copenhagen, Denmark 4AWI, Helmholtz Centre for Polar and Marine Research, Bremerhaven, Germany 5Institute of Earth Sciences, University of Iceland, Reykjavik, Iceland
6GEUS, Copenhagen, Denmark 7University of Liège, Liège, Belgium
8LGGE (UMR 5183 CNRS-UJF), 54 rue Molière, Domaine Universitaire, BP96, 38 402 St Martin d’Hères cédex, France 9UMR CNRS LIENSs, Université de La Rochelle, La Rochelle, France
10LMD, Paris, France
11INSTAAR, Boulder, Colorado, USA anow at: LOCEAN, Paris, France
*These authors contributed equally to this work.
Correspondence to: V. Masson-Delmotte (valerie.masson@lsce.ipsl.fr)
Received: 25 November 2014 – Published in The Cryosphere Discuss.: 29 January 2015 Revised: 17 June 2015 – Accepted: 23 June 2015 – Published: 6 August 2015
Abstract. Combined records of snow accumulation rate,
δ18O and deuterium excess were produced from several shal-low ice cores and snow pits at NEEM (North Greenland Eemian Ice Drilling), covering the period from 1724 to 2007. They are used to investigate recent climate variability and characterise the isotope–temperature relationship. We find that NEEM records are only weakly affected by inter-annual changes in the North Atlantic Oscillation. Decadal δ18O and accumulation variability is related to North Atlantic sea sur-face temperature and is enhanced at the beginning of the 19th century. No long-term trend is observed in the accumula-tion record. By contrast, NEEM δ18O shows multidecadal increasing trends in the late 19th century and since the 1980s. The strongest annual positive δ18O values are recorded at NEEM in 1928 and 2010, while maximum accumulation oc-curs in 1933. The last decade is the most enriched in δ18O (warmest), while the 11-year periods with the strongest
de-pletion (coldest) are depicted at NEEM in 1815–1825 and 1836–1846, which are also the driest 11-year periods. The NEEM accumulation and δ18O records are strongly cor-related with outputs from atmospheric models, nudged to atmospheric reanalyses. Best performance is observed for ERA reanalyses. Gridded temperature reconstructions, in-strumental data and model outputs at NEEM are used to esti-mate the multidecadal accumulation–temperature and δ18O– temperature relationships for the strong warming period in 1979–2007. The accumulation sensitivity to temperature is estimated at 11 ± 2 %◦C−1and the δ18O–temperature slope at 1.1 ± 0.2 ‰◦C−1, about twice as large as previously used to estimate last interglacial temperature change from the bot-tom part of the NEEM deep ice core.
1482 V. Masson-Delmotte et al.: Recent changes in north-west Greenland climate
Figure 1. Map of Greenland showing the position of ice core records (red) and meteorological stations (green) used to establish a SW Greenland instrumental temperature record. The grey/white shading indicates elevation (source: NOAA/GLOBE, http://www. ngdc.noaa.gov/mgg/topo/globe.html).
1 Introduction
Under the auspices of the International Polar Year and the International Partnership for Ice Core Science, a camp was operated in 2007–2012 at NEEM (North Greenland Eemian Ice Drilling, 77.45◦N, 51.06◦W, 2450 m a.s.l.; Fig. 1), in or-der to retrieve an ice core record spanning the last interglacial period. The deep drilling took place from 2008 to 2012 and delivered a 2540 m long ice core, providing new information on climate and ice thickness during the last interglacial pe-riod (NEEM, 2013). However, large uncertainties remain at-tached to the interglacial temperature reconstruction, which relies on the interpretation of water-stable isotopes (δ18O) and on the mechanisms of climate variability in north-west Greenland. In this introduction, we briefly review the state of the art with respect to the isotope–temperature relationship in Greenland and at NEEM, and the large-scale drivers of Greenland recent climate variability, before introducing our methodology and the outline of this manuscript.
Studies based on independent palaeothermometry meth-ods or simulations using isotopically enabled atmospheric models show that the isotope–temperature relationship can vary through time and space in Greenland, and be signif-icantly lower than the relationship estimated from a the-oretical Rayleigh distillation and from spatial gradients
(∼ 0.8 ‰◦C−1) (Cuffey and Clow, 1997; Masson-Delmotte et al., 2011; Sime et al., 2013). Changes in relationships be-tween the surface and condensation temperature, changes in precipitation seasonality and/or intermittency, and changes in moisture source conditions can indeed cause such deviations (Jouzel et al., 1997; Krinner and Werner, 2003; Persson et al., 2011). During the Holocene, borehole temperature con-straints from other Greenland ice cores (Vinther et al., 2009) suggest a coefficient of 0.5 ‰◦C−1, which was used for the NEEM last interglacial temperature estimate. For warmer than present-day climates, atmospheric models produced a range of coefficients varying from 0.3 to 0.8 ‰◦C−1for cen-tral Greenland, mostly depending on the patterns of North Atlantic and Arctic SST (sea surface temperature) as well as sea ice changes (Masson-Delmotte et al., 2011; Sime et al., 2013). At NEEM, independent temperature estimates have been obtained during glacial abrupt events, based on gas ther-mal fractionation in the firn. During the last deglaciation and during several Dansgaard–Oeschger warming events, these data have revealed a higher δ18O–temperature coefficient (∼ 0.6 ‰◦C−1) than identified in other Greenland ice cores under glacial conditions (Guillevic et al., 2013; Buizert et al., 2014).
This state of the art has motivated specific studies in or-der to better document and unor-derstand the processes control-ling the variability of snow isotopic composition at NEEM for interglacial conditions. For this purpose, and in paral-lel with deep-drilling operations, the NEEM isotope consor-tium implemented a surface programme in order to moni-tor the isotopic composition of surface water vapour, precip-itation and surface snow, and retrieve pits and shallow ice cores. Measurements of water vapour isotopic composition performed during four summers (2008, 2010–2012) (Steen-Larsen et al., 2011, 2013, 2014) have evidenced a strong re-lationship between surface vapour δ18O, local humidity and surface air temperature. The observed vapour δ18O is charac-terised by a linear regression slope of 0.80 to 0.85 ‰◦C−1. These data also stress the distinct fingerprint of Arctic (sub-tropical) air masses through high (low) deuterium excess (Steen-Larsen et al., 2013, 2014; Bonne et al., 2015). It is conventionally assumed that the isotopic composition of sur-face snow reflects a precipitation-weighted climate signal. Yet, observations have also revealed that the isotopic compo-sition of surface snow in the upper 5 mm varies in-between snowfall events and incorporates changes in surface vapour isotopic composition through surface snow metamorphism (Steen-Larsen et al., 2014). The isotopic exchange between the snow surface and the atmosphere is also consistent with 17O-excess measurements (Landais et al., 2012). These data suggest that the NEEM ice cores may record climatic vari-ations more regularly than during snowfall events, at least during summer.
The first NEEM shallow ice core drilled in 2007 during site survey covered years 1960 to 2007 (Steen-Larsen et al., 2011). The data showed a recent δ18O increasing trend,
which, using a slope of 0.8 ‰◦C−1, was translated to a local warming of ∼ 3◦C. This record showed weak relationships
with the closest coastal meteorological station temperature records and no significant correlation with the winter index of the North Atlantic Oscillation (NAO). This is in contrast with the strong NAO imprint identified in south and cen-tral Greenland meteorological data and ice cores (Hanna and Cappelen, 2003; Vinther et al., 2003, 2010; Casado et al., 2013; Ortega et al., 2014). Atmospheric circulation models showed that the north-west sector of Greenland encompass-ing NEEM is characterised by a seasonal maximum of pre-cipitation during summer, which may explain such a weak fingerprint of the winter NAO (Ortega et al., 2014). Finally, this first recent NEEM δ18O record revealed a close relation-ship with the Labrador Sea/Baffin Bay sea ice extent, notable in the coldest year recorded: 1983–1984.
Past changes in the Labrador Sea/Baffin Bay sea ice are related to changes in the North Atlantic Ocean circulation. The principal component of 16 Greenland ice cores’ annual
δ18O (Ortega et al., 2014) has evidenced bi-decadal variabil-ity closely linked with the Atlantic Multidecadal Oscillation (AMO) (Enfield et al., 2001; Chylek et al., 2011). Large Pinatubo-like volcanic eruptions act as pacemakers for this bi-decadal variability (Swingedouw et al., 2015). Such mul-tidecadal variability may be recorded particularly strongly at NEEM, as this signal would not be masked by NAO vari-ability. Because the 19th century is marked by repeated large volcanic eruptions, we expect to document their impacts on the regional climate through the NEEM ice core records.
Here, we aim to extend NEEM climatic records back to the 18th century. In order to increase the signal-to-noise ratio known to be low for individual Greenland ice core records (Fisher et al., 1985; White et al., 1997), we combine sev-eral individual shallow ice cores. The records of annual ac-cumulation, δ18O and deuterium excess are compared with stacked records from other Greenland ice cores (Andersen et al., 2006; Vinther et al., 2010; Ortega et al., 2014); grid-ded accumulation and surface air temperature reconstruc-tions produced from interpolation of meteorological and ice core data from multiple sites (Box et al., 2009, 2012; Box, 2013); results from different simulations of the regional mospheric model MAR (Fettweis et al., 2011); and two at-mospheric general circulation models including the represen-tation of water-stable isotopes, LMDZiso (Risi et al., 2010) and ECHAM5-wiso (Werner et al., 2011). The ice core data, reconstructions and simulations are described in Sect. 2. The results of the NEEM shallow ice core data are reported and discussed in Sect. 3, where they are compared to other Greenland ice core records, North Atlantic SST and indices of modes of variability. The comparison of NEEM results with reconstructions and simulations is performed in Sect. 4. This model–data comparison will provide an assessment of model performance at NEEM and an evaluation of the δ18O– temperature relationship at this site. This section also encom-passes a discussion of the implications of the NEEM
shal-low ice core data for recent climate change and for past-temperature reconstructions. This manuscript ends with con-clusions and perspectives (Sect. 5).
2 Material and methods
2.1 NEEM shallow ice core data
Four shallow ice cores (Table 1) were used for this study, with depths ranging from 52.6 to 85.3 m. They were comple-mented by snow pits to extend water-stable isotope records to the year 2011. Altogether, 10 pit profiles were obtained with a depth resolution of 2.5 cm, covering different subin-tervals of the period 2003 to 2011. Because density mea-surements were performed on shallow ice cores and not on pits, accumulation records are only available from the shal-low ice cores. Each shalshal-low ice core was cut into 2 cm sam-ples, stored and melted inside sealed containers, and mea-surements were performed using mass spectrometers and/or laser instruments at Laboratoire des Sciences du Climat et de l’Environnement (LSCE), France; the Centre for Ice and Climate (CPH), Denmark; the Alfred Wegener Institute, Bre-merhaven (AWI), Germany; and the Institute of Earth Sci-ences (IES), Iceland (Table 1). Inter-calibration was achieved using common laboratory reference waters, and measure-ments are reported against V-SMOW-SLAP. The accuracy of δ18O measurements is respectively 0.05 ‰ (LSCE, mass spectrometry), 0.07 ‰ (CPH, mass spectrometry) and 0.1 ‰ (laser instruments, CIC, LSCE, AWI and IES). The accu-racy of δD measurements is 0.7 ‰ (AWI, laser measure-ments; LSCE, mass spectrometry and laser measurements) and ∼ 1 ‰ (CPH laser measurements, IES laser measure-ments and mass spectrometry). As a result, the accuracy of deuterium excess calculations (from measurements of δ18O and δD on the same samples) as estimated using a quadratic error varies between 0.8 and 1.3 ‰. Altogether, we have per-formed isotopic measurements on 10 500 shallow ice core samples.
The dating of the shallow ice cores was performed by counting of seasonal cycles in δ18O and verified using volcanic eruptions identified from electrical conductivity measurements. For an improved identification of individ-ual years, back-diffusion calculation was applied to the
δ18O records (Johnsen, 1977; Johnsen et al., 2000). During the period 1725–2007, the estimated accumulation rate is 20.3 ± 3.2 cm w.e. yr−1 (uncertainty ranges represent inter-annual SD). At NEEM, the accumulation rate is compara-ble to that at Summit/GRIP (Greenland Ice Core Project) (21 cm yr−1), ∼ 15 % higher than at north GRIP (NGRIP) (17.5 cm yr−1) and 40 % lower than in south Greenland (51 cm yr−1at DYE3) (Andersen et al., 2006).
Because the magnitude of seasonal cycles in NEEM water-stable isotopes is strongly affected by diffusion, and therefore
1484 V. Masson-Delmotte et al.: Recent changes in north-west Greenland climate
Table 1. NEEM shallow ice core data: name of the core, depth range (upper to lower depth), time span (start and end years) and laboratory where analyses were performed. Note that the δD measurements of 2007 S3 were performed at LSCE only down to 19.65 m (year 1960.5).
Ice core name 2007 S3 2008 S2 2008 S3 2010 S2
Depth range (m) 1.15–80.05 m 0.025–52.55 m 0.875–85.25 m 1.275–53.9
Time span (years CE) 1739.2–2005.6 1852.5–2008.3 1724.6–2007.4 1852.9–2008.3
Analyses (lab name) CIC/LSCE IES AWI CIC
Number of samples 2938 2101 3376 2106
decreases with depth, we decided here to focus on the annual mean signals.
2.2 Meteorological data and Greenland ice core data The NEEM data are compared with long instrumen-tal records of coasinstrumen-tal Greenland temperature, established through the combined homogenisation of southwest Green-land meteorological measurements (Vinther et al., 2006) and updated until 2013 (Cappelen and Vinther, 2014). Differ-ences between surface air temperature variability at the sur-face of the Greenland ice sheet and coastal sites are expected due to effects associated with coastal sea ice changes (for coastal stations) and to the snow and ice surface properties (for the ice sheet), especially for summer temperature (Hanna et al., 2014). For this purpose, the NEEM ice core data are compared to the local grid point outputs from gridded recon-structions of Greenland ice sheet temperature and accumula-tion, based on a spatial interpolation of weather stations and annual ice core data (Box et al., 2012, 2009; Box, 2013).
The fingerprints of large-scale modes of variability are in-vestigated, using the longest instrumental index of the NAO defined as the standardised difference in sea level pressures between Gibraltar and Iceland (Jones et al., 1997; Vinther et al., 2003), and indices of the AMO based on detrended SST data (Trenberth and Shea, 2006; Enfield et al., 2001) and on proxy evidence (Svendsen et al., 2014). We also explored the relationships with North Atlantic winter and summer weather regimes (NAO+, NAO−, Atlantic Ridge and Scandinavian blocking) as performed for other ice cores (Ortega et al., 2014) and with the Greenland blocking index (Hanna et al., 2013).
The NEEM δ18O and accumulation records are also com-pared with records obtained from other Greenland shallow ice cores (Vinther et al., 2010; Andersen et al., 2006; Ortega et al., 2014). There is heterogeneity in the strength of the signal-to-noise ratio in existing records from ice core sites. Most records were obtained from one single ice core, with a few exceptions where a stacked signal has been extracted from multiple shallow ice cores (GISP2, DYE3). The com-mon signal identified in Greenland ice core δ18O (without NEEM) has been extracted using a principal component anal-ysis (Ortega et al., 2014). The same methodology is applied here for accumulation records (Fig. S1 in the Supplement). We hereafter compare the NEEM records with the first
prin-cipal components (PC1) of Greenland ice core δ18O and ac-cumulation.
2.3 Atmospheric simulations
We use outputs from simulations performed with three at-mospheric models (MAR, LMDZiso and ECHAM5-wiso), the latter two equipped with the explicit modelling of water-stable isotopes, which means that they simulate the water cycle for each water molecule and account for fractionation processes occurring during phase changes. These simulations are used to assess whether the NEEM signals are explained by changes in large-scale atmospheric circulation, to assess whether models can accurately capture the observed changes at NEEM and to explore the magnitude of NEEM warming and the δ18O–temperature relationship.
MAR is a regional atmospheric model including processes specific to the ice sheet surface, specifically adjusted to have a realistic representation of Greenland climate, and widely used to investigate changes in Greenland ice sheet mass bal-ance (Fettweis et al., 2011; Fettweis et al., 2013b). Here, we compare version 3.4 of the MAR model nudged against dif-ferent sets of atmospheric reanalyses: ERA-40 (1958–1979) (Uppala et al., 2005) and ERA-Interim (1979–2014) (Dee et al., 2011), NCEP–NCAR v1 (1948–2013) (Kalnay et al., 1996) NCEP 20CR (1871–2012) (Compo et al., 2011). Here-after, these different simulations are named MARv3.4–ERA, MARv3.4–NCEP and MARv3.4–20CR. The reanalyses are used to force the MAR model every 6 h at the lateral bound-aries of its integration domain with temperature, humidity, pressure and winds at each vertical MAR level as well as over the ocean (SST and sea ice cover).
LMDZiso is the isotopic version (Risi et al., 2010) of the LMDZ4 atmospheric general circulation model (Hourdin et al., 2006). The model has a warm and dry bias at NEEM (Steen-Larsen et al., 2011, 2013). It is run at 2.5◦×3.75◦
resolution, in a nudged simulation, using the Atmospheric Model Intercomparison Project (AMIP) protocol and dif-ferent large-scale atmospheric circulation constraints (ERA and 20CR). Note that, in this case, the average ensemble of all 20CR reanalyses was used to drive LMDZiso. We will hereafter distinguish the different LMDZiso simulations by naming them LMDZiso–ERA and LMDZiso–20CR. In this configuration, it was shown that LMDZiso–ERA is able to resolve intra-seasonal variations in south Greenland and
NEEM present-day water vapour isotopic composition vari-ability for δ18O, but it failed to capture the magnitude of deuterium excess variability especially for Arctic moisture sources (Bonne et al., 2014; Steen-Larsen et al., 2013, 2014). ECHAM5-wiso is the isotope-enabled version of ECHAM5, which has been shown to have good performance for global, European and Siberian precipitation isotopic composition, against IAEA/GNIP precipitation monthly monitoring data (Werner et al., 2011; Butzin et al., 2014). Sensitivity tests have stressed the dependence of model results and performance on spatial resolution. Simulations used here were performed at a T63L31 spectral resolution, corresponding to a grid size of about 1.9◦ by 1.9◦ and 31 vertical levels between surface and 10 hPa. The simulation spanning the years 1957–2013 is also performed follow-ing AMIP guidelines with a nudgfollow-ing technique towards ERA40 reanalyses, which implies relaxation of surface pressure, temperature, divergence and vorticity. This implies a stronger nudging than the one implemented for LMDZiso, which does not take temperature into account. Hereafter, this simulation is named ECHAM5-wiso–ERA. We also briefly discuss the comparison between this T63 simulation and a T106 simulation performed with the same model and nudging method (1980–2011), but using an improved horizontal resolution.
Here, we focus on the comparison between annual mean (or daily-precipitation-weighted) surface air temperature; precipitation; and, for LMDZiso and ECHAM5-wiso only, precipitation-weighted annual mean δ18O and deuterium ex-cess. Post-deposition processes, which may alter the surface snow signals (e.g. wind redistribution, snow metamorphism, sublimation etc.), are not taken into account.
In order to perform model–data comparisons on similar time intervals, we focus on the periods 1958–2007 (which encompasses ERA40 simulations) and 1979–2007 (in order to cover the period when satellite data are used in reanaly-ses). Our comparison ends in 2007 because this is the last year for which the accumulation data are available, and be-cause the NEEM isotopic records of the most recent years are a composite of a different number of snow pit data, with potential inhomogeneities.
3 Results
3.1 NEEM records and signal-to-noise ratio
The mean core-to-core coefficient of determination (R2) is respectively 0.31, 0.07 and 0.30 for δ18O, deuterium excess and accumulation. This leads to respective signal-to-noise ra-tios of 1.3, 0.4 and 1.2 for these three records. We conclude that our set of four cores is sufficient to extract a robust δ18O and accumulation signal but insufficient for deuterium ex-cess, probably due to larger analytical uncertainty, and larger core-to-core variability. Note that the comparison of two
deu-terium excess records obtained at a mean temporal resolution of 2 years at GRIP (Hoffmann et al., 2001) showed a lower signal-to-noise ratio (R2of 0.02 for 1725–1979). Further in-vestigations of deuterium excess will require improving ei-ther the analytical accuracy or the number of ice core records. In the subsequent parts of this manuscript, we will there-fore be cautious not to over-interpret this NEEM deuterium-excess record. Following earlier studies, we have produced a mean record by calculating the average values and displayed the associated inter-core SD (Fig. 2).
For 1958 to 2007 (a period allowing comparison with sim-ulations; see next section), the mean NEEM δ18O value is
−33.4 ± 1.1 ‰. The δ18O record displays stable values in the 18th century, followed by a decrease at the beginning of the 19th century, with the most depleted (coldest) decades be-ing in the 1810s and 1830s. This cold phase is followed by a steady increase until the 1870s. During the 20th century, NEEM δ18O displays high values in the 1920s and a strong increase during the most recent decades (+0.77 ‰ decade−1 in 1979–2007), as already identified from the first shal-low ice core (Steen-Larsen et al., 2011). The most enriched (warmest) decade is observed at the beginning of the 21st century (2000–2011). The highest δ18O annual mean value is however encountered in 1928, followed by 2010 (−29.9 and −30.6 ‰, respectively). The lowest δ18O values appear in 1835 and 1983 (−37.0 and −36.5 ‰, respectively). We will further investigate the spatial structure of climatic and isotopic anomalies of these 2 years in Sect. 4.5.2, including a discussion of the corresponding large-scale modes of vari-ability.
The accumulation record appears very similar to the δ18O record with respect to multidecadal changes (R2=0.36 from 11-year smoothed data). It is reported here in centimetres of water equivalent per year. The mean value over 1725–2007 is 20.3 ± 3.1 cm yr−1, in perfect agreement with the mean value for the past 3000 years inferred from the NEEM ice core chronology, of 20.3 ± 0.3 cm w.e. yr−1 (Rasmussen et al., 2013); in the latter estimate, the uncertainty indicates 1σ on the mean value based on Monte Carlo simulations. The ac-cumulation record also depicts strong decadal minima in the first half of the 19th century and decadal maxima in the 1920s and 2000s. It however shows weaker multidecadal trends, both in the second part of the 19th century and during the last decades. From 1979 to 2007, accumulation has increased by 1.6 cm yr−1, per decade. However, the accumulation rate in the beginning of the 21st century (2000–2011) lies within the average values encountered in the 1920s and 1870s. Sim-ilarly, while the δ18O record displays a much more pro-nounced minimum in 1836–1846 compared to 1815–1825, the accumulation record shows similar magnitudes for these two minima (Fig. 3). Note also that record years do not al-ways coincide in δ18O and accumulation. For instance, peak accumulation is encountered in 1933, followed by 1928. A remarkable dry and cold year appears to be 1983, while the years 1878, 1933, 2001, 1892 and 1928 appear
partic-1486 V. Masson-Delmotte et al.: Recent changes in north-west Greenland climate 8 6 4 2 0 N c ore s 2000 1950 1900 1850 1800 1750 1700 Date (CE) -39 -38 -37 -36 -35 -34 -33 -32 -31 -30 -29 δ 18O 15 14 13 12 11 10 9 8 7 d 8 6 4 2 0 N c ore s 0.35 0.30 0.25 0.20 0.15 0.10 0.05 A cc um ul at ion (m /yr) 8 6 4 2 0 N c ore s
Figure 2. NEEM records from shallow ice cores and snow pits;
from top to bottom: δ18O, deuterium excess (“d”) (both reported in
‰) and accumulation (in m yr−1). The thin coloured lines
repre-sent annual averages, and the shading the standard deviation within individual ice core records. The thick lines display 11-year bino-mial smoothing. The horizontal dotted line shows the average val-ues from 1850 to 2011. The dashed black lines display the number of shallow ice core records through time (from 1 to 4) as well as the number of pit records (from 1 to 10) spanning 2003–2011. No ac-cumulation estimate is available from these pit data due to the lack of systematic density measurements.
ularly warm and wet. We will further investigate the spatial structure of remarkable wet years, and cold and dry decades in Sects. 4.5.2 and 4.5.3.
For the period 1958–2007, this close relationship between accumulation and δ18O has a slope of 1.8 ± 0.3 cm yr−1‰−1 (R = 0.63). It is smaller than the one obtained from multi-site decadal averages in NW Greenland (Camp Century, NEEM, NGRIP and B26) (2.1 cm w.e. yr−1‰−1) (Buchardt et al., 2012).
The power spectra of accumulation and δ18O have differ-ent properties. Accumulation has white-noise characteristics and exhibits significant periodicities at 19 years (99 % confi-dence level, tested using MTM and SSA methods), 7.8 years and 4.3 years (90 to 95 % confidence level). In contrast, the power spectrum of δ18O is characteristic of a red-noise pro-cess. Significant periodicities are detected again at 19 years
(90 % confidence level), and also at 5 years (95 %) and
∼4 years (99 % confidence). The coherence between these two records is maximum and significant at the 99 % confi-dence level at the inter-annual scale (3–5 years) and at the bi-decadal scale (Fig. 3). The relationship between accumu-lation and δ18O will be further discussed and compared with model results in Sect. 4.1.
The deuterium excess stack appears quite flat, with no remarkable long-term trend, consistent with the GRIP deu-terium excess low-resolution record obtained from two cores (Hoffmann et al., 2001). For the common period (1725– 1979), our NEEM record shows 2.3 times more variance (from 2-year-average data) than this GRIP stack. There was no correlation between the original GRIP source records (when considering mean values over 2 to 20 years). Note that the quality of the NEEM stacked record is lower prior to 1958 due to the use of only three shallow ice cores. For 1958– 2007, the stack NEEM deuterium excess has a mean value of 10.9 ± 0.6 ‰. In Greenland surface snow, deuterium excess generally increases with δ18O depletion (Masson-Delmotte et al., 2005). NEEM deviates from this overall spatial pat-tern by its high deuterium excess level for the correspond-ing mean δ18O level. It also displays multidecadal variability with maximum values in the 1790s, 1820s, 1850s and 1920s, and it shows low values during the period 2005–2010, al-though such values are not unusual in the context of earlier decadal minima (e.g. 1940s). From 1979 to 2007, no trend is detected in deuterium excess. No significant statistical rela-tionship emerges between NEEM deuterium excess and δ18O or accumulation records. The lack of strong signals in recent deuterium excess is surprising, as one could have expected a relationship with recent changes in Arctic sea ice cover (Ku-rita, 2011; Steen-Larsen et al., 2013). It could arise from the low signal-to-noise ratio. If the lack of long-term trend is a robust feature, this would rule out major changes in moisture origin during the past centuries. We note that – in the com-bination of δ18O, accumulation and deuterium excess – there is no earlier analogue to the values observed during the last decade (record high δ18O together with high accumulation and low deuterium excess).
3.2 Comparison with other Greenland ice core records We have calculated the inter-annual correlation coefficients of NEEM δ18O and accumulation with other Greenland records, as well as with their respective PC1, for the period 1761–1966. We have also tested correlation calculations with de-trended records. Tables S1 and S2 in the Supplement re-port the detailed results.
For δ18O (Table S1 in the Supplement, Fig. 4), NEEM data are, as expected, weakly correlated with data from south or east Greenland (R = 0.15 to 0.25) and more strongly cor-related with data from central Greenland (R = 0.30 with GISP2) and specifically with the closest north-west Green-land records (R > 0.40 with B29 and NGRIP). Note that the
-4 -2 0 2 4 z-score 2000 1950 1900 1850 1800 1750 1700 Year CE δ18O accumulation
MTM accumulation Frequency Reshaped MTM AR(1) 90% 0 0.05 0.1 0.15 0.2 0.25 0.3 0.35 0.4 0.45 0.0001 0.001 0.01 MTM oxygen Frequency Power Reshaped MTM AR(1) 90% 0 0.05 0.1 0.15 0.2 0.25 0.3 0.35 0.4 0.45 0.1 1 10 mtm-acc Frequency Coherence 90% 0 0.05 0.1 0.15 0.2 0.25 0.3 0.35 0.4 0.45 0.01 0.1 1 (a) (b)
Figure 3. (a) Comparison of z scores of accumulation (blue) and δ18O (red) (dashed lines: annual values; thick solid lines: 11-year-average
values). Power spectrum of accumulation (b), δ18O (c) and coherency (d) calculated using the multitaper method (resolution of 2, three
tapers, adaptative spectrum in blue, tested against compatible white- or red-noise processes shown here in red at 90 % confidence level). Harmonic signals (spikes in the spectrum corresponding to a periodic or quasi-periodic signal in frequency, amplitude and phase) are shown with a black rectangle.
strength of this correlation also depends on the signal-to-noise ratio of each ice core record and is therefore enhanced when comparing NEEM results with stacks obtained from multiple shallow ice cores (e.g. GRIP).
The correlation coefficient between NEEM δ18O and the PC1 of all Greenland annual δ18O records spanning 1761 to 1966 (Ortega et al., 2014) is 0.48 at annual scale and in-creases to 0.67 for 5-year-average data. NEEM δ18O and Greenland δ18O PC1 (Fig. 5) share common inter-annual (R2=0.24) and multidecadal (R2=0.51) variations.
Altogether, the spatial patterns of correlations with NEEM accumulation are similar but with smaller strength than those of δ18O (Fig. 4). The NEEM accumulation record (Table S2 in the Supplement, Fig. 4) is only weakly correlated (at an-nual scale) with records from south Greenland (e.g. R = 0.11 with DYE2, p = 0.05) and central Greenland (e.g. R = 0.15 with GRIP, p = 0.01). We again observe the strongest re-lationship with the closest ice cores (B29, Camp Century and NGRIP) where correlation coefficients reach R = 0.38 (p = 0.000), albeit with one exception (B26, insignificant
1488 V. Masson-Delmotte et al.: Recent changes in north-west Greenland climate
56
85 80 75 70 65 60 -80 -70 -60 -50 -40 -30 -20 -10 NEEM PC1 1.0 0.8 0.6 0.4 0.2 C o rr el at io n c o ef fic ie n t 85 80 75 70 65 60 -80 -70 -60 -50 -40 -30 -20 -10 NEEM PC1 1.0 0.8 0.6 0.4 0.2 C o rr el ati o n c o ef fic ie n tFigure 4. Spatial distribution of correlation coefficients between NEEM accumulation (top) and other Greenland accumulation records, and
between NEEM δ18O (bottom) and other Greenland temperature and δ18O records. We have also displayed the correlation with the PC1 of
other Greenland records (white rectangle) and the correlation with SW Greenland instrumental temperature data (repeating the same value for the three coastal sites used to make the temperature stack record) (white rectangles). We used correlation coefficients for the same period (1761–1966), without detrending (Tables S1, S2 and S3 in the Supplement). Note that insignificant correlations are represented by the white filled circles. -4 -2 0 2 4 A nnua l δ18 Ο P C1 2000 1950 1900 1850 1800 1750 Year CE -4 -2 0 2 4 NEEM δ 18Ο -4 -2 0 2 4 N E E M a cc um ul at ion -4 -2 0 2 4 A nnua l a cc um ul ati on P C1 PC1 NEEM z-score 1 year : R2=0.24 11 year smoothing : R2=0.51 1 year : R2=0.15 11 year smoothing : R2=0.30
Figure 5. Top: comparison between NEEM δ18O z score (red, no
unit) with the first principal component (PC1) of 16 Greenland
an-nual δ18O records (Ortega et al., 2014) (black, no unit). Bottom:
comparison between NEEM δ18O z score (red, no unit) with the
first principal component (PC1) of 13 Greenland annual
accumula-tion records (common with those used for δ18O) calculated using
the same methodology as published for δ18O (black, no unit; see
Fig. S1 in the Supplement). Annual mean data are shown as dot-ted lines, and 11-year binomial averages are shown as bold lines. We also report the respective coefficients of determination between the annual mean NEEM data and the PC1 (p values are lower than
10−9).
correlation). By contrast, the correlation with Camp Century is stronger for accumulation than for δ18O. These correla-tions increase for low frequencies (R = 0.63 with NGRIP for 5-year-average data).
The correlation between NEEM accumulation and the Greenland accumulation stack (Andersen et al., 2006), which mostly relies on ice cores from south and central Green-land, is only 0.28 at annual scale and 0.27 for 5-year-average data (not shown). Both the NEEM accumulation record and the Greenland accumulation stack depict an increase in mul-tidecadal variability in the 19th century, but they diverge in the 1970s (not shown). This would deserve to be fur-ther explored, for instance by investigating patterns of mois-ture transport towards NEEM during this time period, which is marked by a retreat of Baffin Bay sea ice cover and out-of-phase changes between the Labrador and Norwegian seas (Drinkwater et al., 2013). The correlation between the NEEM accumulation record and the PC1 of accumulation is much higher than with the south-central Greenland accumu-lation stack (Table S2 in the Supplement). This coherency is maximum at the decadal scale, reaching R2=0.30 (Fig. 5). At this decadal scale, we note that both NEEM accumula-tion and accumulaaccumula-tion PC1 depict a sharper minimum in the 1810s compared to the 1830s, in contrast with the δ18O data. We also observe that the coherency between NEEM and ac-cumulation PC1 is less good in the most recent overlapping period (1940s to 1960s), without identifying a clear explana-tion for this feature.
This comparison stresses the quality of the Greenland-scale climate information archived in the NEEM stack δ18O and accumulation records, and it identifies specific features of NEEM regional variability. These specificities will be fur-ther explored in Section 4.4 by mapping the spatial structure associated with remarkable cold-dry and warm-wet years and decades.
3.3 Comparison with regional climate
In this section and the following parts of this manuscript, we systematically report correlation coefficients (R) and not de-termination coefficients (R2) as results of statistical analyses, to inform as well about the sign of the relationship.
The NEEM δ18O and accumulation records are signif-icantly correlated with the historical record of south-west Greenland instrumental temperature (Table S3 in the Supple-ment). For accumulation, correlation coefficients are com-parable for winter (DJFM) and summer (JJAS), around
R =0.25. For δ18O, stronger correlation coefficients are identified, from 0.32 (DJFM) to 0.49 (JJAS) (Table S3 in the Supplement), with 0.44 for annual mean temperature (not shown). We note that the strength of the correlation of NEEM
δ18O with coastal SW Greenland temperature is comparable to the strength of its correlation with the δ18O PC1.
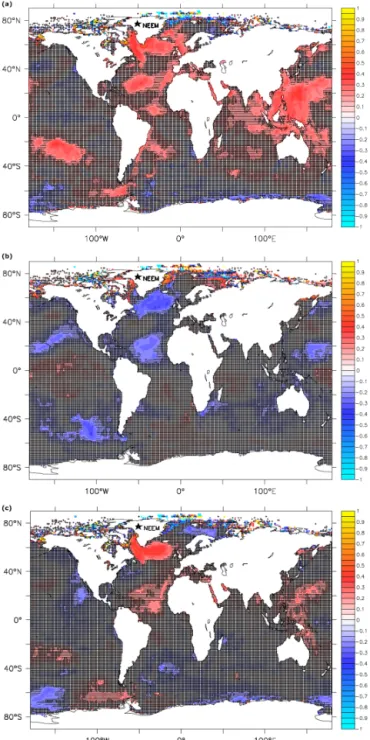
The NEEM δ18O, deuterium excess and accumulation are also significantly correlated with North Atlantic SST (Fig. 6). The correlation patterns are similar when using annual, 5-and 10-year smoothed data, 5-and the strength of the correla-tion is larger for 5- and 10-year smoothed data. NEEM δ18O and accumulation are positively related to SST in the subpo-lar gyre, with a stronger relationship for δ18O than for ac-cumulation. Deuterium excess is negatively related to SST, with a weak correlation coefficient which may arise from the low signal-to-noise level in our data set (Fig. 6). This can be understood through the fact that a warmer North Atlantic favours enhanced evaporation and subsequently becomes a dominant moisture source to NEEM. A larger contribution of nearby moisture sources is expected to favour warmer and wetter conditions, reduced en-route distillation and less depleted δ18O than for long-distance moisture transport, or for Arctic moisture. Similarly, a larger contribution of North Atlantic moisture formed under relatively wet evaporation conditions is expected to produce a smaller deuterium ex-cess than for Arctic air masses, associated with stronger ki-netic evaporation at sea ice margins, and therefore higher deuterium excess. We assume that surface humidity effects would be dominant over surface temperature effects. These patterns are fully consistent with the information provided by surface water vapour monitoring recently achieved in south Greenland (Bonne et al., 2014) and at NEEM (Steen-Larsen et al., 2013), which support this interpretation.
These analyses confirm that the NEEM ice cores record large-scale temperature information. In the next section, we will therefore investigate the relationship between NEEM records and modes of variability.
3.4 Comparison with modes of variability
NEEM accumulation and δ18O records only display a weak but significant anti-correlation with winter and summer NAO (Table S3 in the Supplement), much smaller than for south Greenland ice cores, where the correlation coefficient is
be-Figure 6. Correlation coefficients between NEEM δ18O,
accumu-lation and deuterium excess records and HadSST gridded SST data, using 5-year smoothed data, for the period 1870–2010. The hatch-ing highlights areas where correlation coefficients are not
signifi-cant at the 95 % confidence level. From top to bottom: (a) δ18O,
(b) accumulation and (c) deuterium excess.
low −0.3 (Vinther et al., 2003; Ortega et al., 2014). The sta-tistical relationship between the NEEM and south Greenland ice cores may therefore arise from this simultaneous impact of the NAO imprint in each region.
The last decade is marked by changes in circulation pat-terns, with the emergence of the Arctic dipole (Zhang et al.,
1490 V. Masson-Delmotte et al.: Recent changes in north-west Greenland climate 2008). In order to investigate the fingerprints of large-scale
Arctic atmospheric circulation in Greenland ice cores, we have performed a linear correlation analysis of the two first principal components of sea level pressure north of 70◦N and NEEM records (Table S4 in the Supplement). The first component is related to the Arctic Oscillation (AO), while the second component is related to the Arctic dipole (not shown). Due to uncertainties in the early part of the pressure data set (prior to 1930), we have tested the robustness of correlations for two time periods (1870–2010 and 1930–2010) and for different data smoothing (no smoothing, 3 and 5 years). Cor-relations are strongest and most stable (R > 0.3) for NEEM
δ18O and accumulation with AO and the Arctic dipole at 3–5 year smoothing, while, despite its low signal-to-noise ratio, deuterium excess is only significantly correlated with AO at 5 year smoothing.
We have also investigated the statistical linear relation-ships between NEEM records and the four main North Atlantic weather regimes for winter (DJFM) and summer (JJAS) (Table S5 in the Supplement). For winter weather regimes, the only statistically significant correlation emerges for δ18O with the Atlantic Ridge regime, thus confirming its influence over northern Greenland (Ortega et al., 2014). For summer weather regimes, despite its low signal-to-noise ratio, deuterium excess is significantly anti-correlated with Scandinavian blocking, while no robust feature emerges for NEEM accumulation, and NEEM δ18O is significantly cor-related with NAO− and anti-corcor-related with NAO+ (Ta-ble S5 in the Supplement). We have also tested the corre-lation of NEEM records with Greenland blocking (Hanna et al., 2013), which is known to have a strong imprint on coastal Greenland summer temperature and melting. We also detect a significant positive correlation between the Greenland block-ing index (same as in Hanna et al., 2013) and both NEEM annual mean δ18O (1948–2011, R = 0.29) and NEEM accu-mulation (1948–2007, R = 0.26) (not shown).
We conclude that the inter-annual climate variability at NEEM is only weakly driven by North Atlantic or Arctic weather regimes and atmospheric modes of variability. This variability seems more likely dominated by changes in the sub-polar North Atlantic.
As expected from the spatial patterns of correlation be-tween NEEM data and North Atlantic SST (Fig. 6), signifi-cant correlation is detected between NEEM records and dif-ferent indices of the Atlantic Multidecadal Oscillation. The strength of this correlation increases using low-pass filtered data, and it peaks with a 2-year lag. For 11-year running averages (not shown), it reaches up to 0.44 for δ18O, and it is slightly lower for accumulation. A recent proxy-based AMO reconstruction (AMO3) only shows significant corre-lation with deuterium excess. This is consistent with observa-tions showing large changes in deuterium excess, with lower values for North Atlantic moisture and higher values for Arc-tic moisture (Kurita, 2011; Bonne et al., 2014; Steen-Larsen et al., 2013).
At multi-annual and longer timescales, the NEEM ice core records may therefore be closely related to changes in North Atlantic Ocean circulation. This provides an explanation for the close relationship between NEEM records and the PC1 of other Greenland ice cores, in which contrasted regional impacts of weather regimes are damped.
4 Discussion: comparison of NEEM data with reconstructions and simulations
4.1 Accumulation
We first compare the NEEM accumulation record with out-puts of the Greenland gridded accumulation reconstruction – as well as with annual mean precipitation from nudged simu-lations performed with MAR, ECHAM5-wiso and LMDZiso – at the grid points closest to NEEM (Fig. 7). We note that the use of precipitation instead of the net surface mass bal-ance introduces artefacts in this comparison, as we do not account for sublimation, deposition or wind erosion. Subli-mation is negligible in all simulations. Only MAR accounts for deposition and wind erosion effects. In this model, depo-sition represents an additional mass gain of 12 % at NEEM (not shown).
While average precipitation in the different sets of MAR simulation is in very good agreement with NEEM data, we observe a dry bias in the gridded reconstruction and in both LMDZiso simulations, as well as a wet bias for ECHAM5-wiso–ERA. The magnitude of the inter-annual standard devi-ation appears proportional to the mean accumuldevi-ation value, and therefore the inter-annual variability is underestimated for models with a dry bias and overestimated for those with a wet bias. The inter-annual variability of MAR-simulated pre-cipitation is larger (13 to 29 %) than the observed variability of NEEM accumulation.
The correlation coefficient between the NEEM record and these data sets (Table 2) varies from 0.5 (LMDZiso–20CR and reconstruction) to 0.8 (MAR and ECHAM5-wiso us-ing ERA atmospheric fields). Prior to 1958, the historical LMDziso–20CR simulation and the reconstruction perform quite poorly. Within the time interval common to all simu-lations, better agreement is observed when using ERA then when using NCEP or 20CR reanalyses (based on LMDZiso and MAR simulations).
We observe an increasing trend from 1979 to 2007 by 1.6 cm w.e. yr−1, per decade (Table 2). This increasing trend is well captured by all MAR simulations and LMDZ– ERA, underestimated by LMDZiso–20CR (which has a dry bias), and slightly overestimated (but within uncertainties) by ECHAM5-wiso–ERA (which has a wet bias).
4.2 δ18O and deuterium excess
We now compare the NEEM δ18O record with precipitation-weighted δ18O from nudged simulations performed with the
Table 2. Comparison of NEEM accumulation (cm water equivalent per year) with gridded data from the reconstruction (Box et al., 2012) and from simulations. The mean values and standard deviations are reported for 1958–2007.
Accumulation Mean Standard deviation R Rbefore 1958 Trend per decade
(cm w.e. yr−1) 1958–2007 1958–2007 1958–2007 1979–2007 NEEM 20.2 3.1 1.6 ± 0.7 MARv3.4–ERA (1958–2007) 19.5 4.0 0.79 (p = 0.000) 1.8 ± 0.8 MARv3.4–NCEP (1948–2007) 20.6 3.6 0.68 (p = 0.000) 0.61 (p = 0.027) 1.4 ± 0.8 MARv3.4–20CR (1871–2007) 19.8 4.2 0.71 (p = 0.000) 0.57 (p = 0.000) 1.7 ± 0.9 ECHAM5-wiso–ERA (1958–2007) 29.1 5.4 0.76 (p = 0.000) 2.0 ± 1.2 LMDZiso–20CR (1871–2007) 14.0 2.3 0.53 (p = 0.000) 0.23 (p = 0.003) 0.7 ± 0.5 LMDZiso–20CR (1979–2007) 14.0 2.4 0.69 (p = 0.000) 0.7 ± 0.5 LMDZiso–ERA (1979–2007) 16.0 2.3 0.59 (p = 0.000) 1.3 ± 0.5
Reconstruction (1840–1999) 21.4 2.3 0.53 (p = 0.000) 0.19 (p = 0.018) not available
up to 2007
Table 3. Comparison of NEEM δ18O with simulations.
δ18O ‰ Mean Standard R Trend per decade
deviation 1979–2007 NEEM (1958–2007) −33.4 1.1 0.77 ± 0.25 ECHAM5-wiso–ERA (1958–2007) −29.0 1.0 0.68 (p = 0.000) 0.69 ± 0.18 LMDZiso–20CR (1958–2007) −26.8 0.6 0.41 (p = 0.002) 0.19 ± 0.12 LMDZiso–20CR (1979–2007) −26.6 0.5 0.40 (p = 0.015) 0.19 ± 0.12 LMDZiso–ERA (1979–2007) −26.3 1.0 0.75 (p = 0.000) 0.82 ± 0.17
models resolving water-stable isotopes (ECHAM5-wiso and LMDZiso), at the grid points closest to NEEM (Fig. 8, Ta-ble 3). Models underestimate the δ18O depletion at NEEM by 4.4 ‰ (ECHAM5-wiso–ERA) to 6.8 ‰ (LMDZiso–20CR). The correlation coefficient between the simulated and ob-served δ18O is 0.68 (1958–2007) for ECHAM5-wiso–ERA, and 0.75 (1979–2007) with LMDZiso–ERA. The LMDZiso– 20CR simulation underestimates isotopic variability by a fac-tor of 2, shows a comparatively lower correlation (R = 0.41, 1958–2007) and does not reproduce the recent increasing trend. The correlation strength between LMDZiso–20CR and NEEM δ18O is stable at R = 0.40 from 1930 onward; prior to 1930, it drops to about R = 0.20 (with or without de-trending). All the other simulations perform reasonably well in terms of their ability to capture the observed trend from 1979 to 2007 (0.77 ± 0.25 ‰ per decade). Again, simulations nudged to ERA perform better than those nudged to 20CR.
One reason for the specific features of the LMDZiso– 20CR simulation lies in the atmospheric reanalyses them-selves. The 20CR reanalyses provide an ensemble of re-alisations which are consistent with the assimilated data. The nudging of LMDZiso was performed using the av-erage winds of all 20CR ensemble members, leading to a strong smoothing of synoptic variability. An alternative choice could be to drive the atmospheric model using a ran-domly selected member of the 20CR ensemble.
40 30 20 10 0 A cc um ul at ion (c m /ye ar) 2000 1950 1900 1850 1800 1750 1700 Year CE MAR/ERA MAR/20CR MAR NCEP ECHAM5wiso/ERA LMDZiso/20CR LMDZiso/ERA Reconstruction NEEM stack
Figure 7. Comparison of NEEM accumulation with the reconstruc-tion and precipitareconstruc-tion from simulareconstruc-tions, in cm of water equivalent per year. Results are shown for annual averages, as well as for a 11-year binomial smoothing.
We can also compare the accumulation–δ18O rela-tionships from NEEM with those from the simulations (Fig. 9). In addition to its wet and δ18O-enriched bias, ECHAM5-wiso–ERA produces a stronger accumulation–
1492 V. Masson-Delmotte et al.: Recent changes in north-west Greenland climate
Table 4. Comparison of NEEM deuterium excess with simulations, performed for 1958–2007 and for 1979–2007.
Time span Deuterium excess (‰) Mean Standard Rwith NEEM
deviation 1958–2007 NEEM 10.9 0.6 1958–2007 ECHAM5-wiso ERA 10.8 0.6 0.47 (p = 0.000) 1958–2007 LMDZiso 20CR 11.7 0.4 0.27 (p = 0.029) 1979–2007 LMDZiso 20CR 11.5 0.3 0.34 (p = 0.035) 1979–2007 LMDZiso ERA 3.8 0.6 −0.32 (p = 0.045) -36 -34 -32 -30 -28 -26 -24 -22 δ 18Ο 2000 1950 1900 1850 1800 1750 Year CE ECHAM5-wiso LMDZiso/20CR LMDZiso/ERA NEEM stack
Figure 8. Comparison of NEEM δ18O with δ18O simulations
(in ‰).
to 1.8 ± 0.3 cm yr−1‰−1from NEEM data, 1958–2007) but shows more dispersion (R = 0.44) than observed (R = 0.63) (not shown). In ECHAM5-wiso, model biases are at least partly related to the coarse resolution of the T63 simula-tion. This is demonstrated for the period 1980–2012 through the comparison of a T63 and a T106 simulation (both nudged to ERA-Interim). At NEEM, the T106 simulation (not shown) produces lower temperatures (1 = −2.9◦C) and more depleted (1δ18O = −1.7 ‰) and slightly reduced precipitation amounts (1 = −0.8 cm yr−1) compared to the T63 simulation. LMDZiso–ERA strongly underestimates the strength of the observed relationship, with a slope of 1.1 ± 0.4 cm yr−1‰−1(1979–2007, R = 0.44), as compared with the observed slope (2.0 ± 0.4 cm yr−1‰−1, 1979– 2007, R = 0.69 for NEEM); in the LMDZiso–20CR simu-lation, no relationship is observed between these two vari-ables. This again suggests a better representation of synoptic weather systems in ERA than 20CR, and caveats in mois-ture advection towards north-west Greenland in LMDZiso and ECHAM5-wiso at T63 resolution, possibly related to the low spatial resolution of the models, which may not resolve correctly the small-scale storms observed in this area.
We finally note that the observed and simulated recent accumulation–δ18O temporal relationship differs from the re-lationship inferred from the the Holocene NEEM chronology (2.5 cm water equivalent according to S. L. Buchardt, 2014).
50 40 30 20 10 0 P re cipi ta tion or a cc um ul ation (c m /ye ar) -38 -36 -34 -32 -30 -28 -26 -24 -22 δ18Ο NEEM ECHAM5-wiso/ERA LMDZiso/20CR LMDZiso/20CR (1958-2009) LMDZiso/ERA 1979-2009)
Figure 9. Relationship between accumulation or precipitation (cm
water equivalent per year) and δ18O (‰) in NEEM ice core stack
(red) and in different simulations (colours).
The comparison between simulations and NEEM deu-terium excess data (Fig. 10, Table 4) raises further ques-tions. We have already stressed the weak signal-to-noise ra-tio within the individual NEEM shallow ice core records. With this caveat in mind, we note that ECHAM5-wiso–ERA correctly captures the mean level and variance of deuterium excess at NEEM for 1958–2007, despite its wet and δ18 O-enriched biases. LMDZiso again underestimates the variance using the 20CR simulation and produces very low deuterium excess levels in the ERA simulation. The correlation coeffi-cient is low for all LMDZiso outputs. We observe a signif-icant correlation between ECHAM5-wiso–ERA deuterium excess and NEEM data (R = 0.47). Despite the low signal-to-noise ratio in our record, this suggests that there could be information on large-scale moisture transport in NEEM deu-terium excess, as also suggested by its correlation with NAO. Finally, both ECHAM5-wiso–ERA and LMDZiso–ERA produce a decreasing trend in deuterium excess during 1979– 2007, while no trend is observed in our NEEM records. This may suggest that models simulate changes in north-west Greenland moisture sources associated with recent warming, which are not supported by the (noisy) NEEM data. Model– data comparisons with in situ surface water vapour monitor-ing have shown the caveats of these models which fail to cor-rectly simulate the high deuterium excess associated with air mass trajectories from the Arctic (Steen-Larsen et al., 2013). Issues may also arise from post-deposition effects which are
Table 5. Comparison of NEEM δ18O with temperature reconstructions and simulations.
Temperature Mean Standard deviation Rwith NEEM Rwith NEEM Rwith NEEM Trend per decade (◦C) 1958–2007 1958–2007 δ18O (T) 1958–2007 δ18O (weighted T) δ18O before 1958 1979–2007 MARv3.4–ERA −27.5 1.0 0.31 0.25 0.58 ± 0.22 1958–2007 (p = 0.0015) (p = 0.045) MARv3.4–NCEP −27.1 1.1 0.21 0.26 0.62 0.63 ± 0.24 1948–2007 (p = 0.077) (p = 0.034) (p = 0.024) MARv3.4–20CR −26.4 1.0 0.23 0.21 0.33 0.58 ± 0.21 1871–2007 (p = 0.051) (p = 0.074) (p = 0.000) ECHAM5-wiso–ERA −23.0 1.2 0.43 0.59 0.81 ± 0.24 1958–2007 (p = 0.001) (p = 0.000) LMDZiso–20CR −19.8 0.8 0.08 0.44 0.08 0.19 ± 0.18 1958–2007 (p = 0.290) (p = 0.001) (p = 0.231) LMDZiso–20CR −19.8 0.8 0.27 0.41 0.19 ± 0.18 1979–2007 (p = 0.078) (p = 0.013) LMDZiso–ERA −21.2 1.1 0.49 0.67 0.65 ± 0.22 1979–2007 (p = 0.003) (p = 0.000) Reconstruction −31.1 1.2 0.37 0.42 0.98 ± 0.22 1840–2007 (p = 0.004) (p = 0.000) SW coastal Greenland T DJFM −8.6 2.8 0.01 (p = 0.473) 0.35 (p = 0.000) 0.95 ± 0.69 JJAS 5.7 0.9 0.42 (p = 0.001) 0.46 (p = 0.000) 0.61 ± 0.18 ANN 1784–2007 −1.6 1.4 0.22 (p = 0.062) 0.45 (p = 0.000) 0.83 ± 0.32 12 10 8 6 4 d 2010 2000 1990 1980 1970 1960 1950 Year CE ECHAM5-wiso LMDZiso/20CR LMDZiso/ERA NEEM stack
Figure 10. Comparison of NEEM deuterium excess (d, in ‰) with simulations.
not understood (Steen-Larsen et al., 2014). Further investi-gations are needed, especially with respect to the seasonal trends in deuterium excess in the simulations and ice core records, with the challenge of diffusion effects. Our conclu-sions are limited by the large inter-core deviations and the low signal-to-noise ratio in the stack deuterium excess sig-nal.
4.3 Surface air temperature and relationship with δ18O Here, we compare the NEEM δ18O with temperature data from the composite record of coastal stations (Vinther et al., 2006), the gridded reconstruction based on the interpolation of coastal and Greenland automatic weather station informa-tion (Box et al., 2009), and simulainforma-tions performed with the different atmospheric models.
We first discuss the annual mean temperature. For the period 1958–2011, annual mean surface snow temperature is estimated at −28.15 ± 0.13◦C from the least-square in-version of NEEM borehole temperature measurements. The annual mean temperature estimate from PARCA AWS (au-tomatic weather station) surface air temperature measure-ments, available for 2009–2011, is −26.8 ± 1.8◦C. This range is consistent with the mean surface air temperature in the MAR simulation, as well as the temperature recon-struction updated from (Box et al., 2009), scaled against an-other regional model and independent of NEEM ice core data. However, the atmospheric general circulation models have warm biases (about 2◦C for ECHAM5-wiso–ERA at T106, 5◦C for ECHAM5-wiso–ERA at T63 and up to 8◦C for LMDZiso–20CR), consistent with the lack of depletion for the simulated δ18O. While the NCEP nudging leads to an underestimation of variance, the observed variance is well captured using the ERA forcing for all models.
Before comparing the NEEM ice core records with the model outputs, we first compare the representation of annual mean precipitation δ18O and temperature in the LMDZiso– ERA and ECHAM5-wiso–ERA simulations. The model re-sults are significantly correlated at the inter-annual scale from 1979 to 2007, with a correlation coefficient of 0.95 for surface air temperature and 0.83 for precipitation δ18O. They however produce different trends and different re-sults for specific warm/cold years. As a result, they sim-ulate different relationships between δ18O and tempera-ture. At the inter-annual scale, LMDZiso–ERA produces a slope of 0.5 ‰◦C−1, with a correlation coefficient of 0.59; ECHAM5-wiso–ERA produces a slope of 0.8 ‰◦C−1, with
1494 V. Masson-Delmotte et al.: Recent changes in north-west Greenland climate
Table 6. Calculations of NEEM – δ18O temporal slope for the period 1979–2007 using all sources of information (six temperature estimates
and three δ18O estimates). For each data source, the slope is calculated based on the ratio of the multidecadal trends for δ18O and for
temperature. The reported statistics are the mean and standard deviation of trends and slopes calculated for all listed source data sets. Here, NEEM temperature reconstruction refers to the data set of Box et al. (2009).
Source Temperature trend δ18O trend Ratio
data (◦C decade−1) (‰ decade−1) ‰◦C−1
NEEM δ18O 0.83 ± 0.32 0.77 ± 0.25 0.93 annual mean SW coastal temperature NEEM δ18O 0.98 ± 0.27 0.77 ± 0.25 0.79 NEEM temperature reconstruction NEEM δ18O 0.96 ± 0.02 0.77 ± 0.25 0.80 NEEM borehole temperature inversion NEEM δ18O 0.58 ± 0.22 0.77 ± 0.25 1.33 MARv3.4–ERA temperature NEEM δ18O 0.63 ± 0.24 0.77 ± 0.25 1.22 MARv3.4–NCEP temperature NEEM δ18O 0.58 ± 0.21 0.77 ± 0.25 1.33 MARv3.4–20CR temperature NEEM δ18O 0.65 ± 0.22 0.77 ± 0.25 1.18 LMDZiso–ERA temperature NEEM δ18O 0.81 ± 0.24 0.77 ± 0.25 0.95 ECHAM-5wiso–ERA temperature LMDZiso–ERA δ18O 0.65 ± 0.22 0.82 ± 0.17 1.26 and temperature ECHAM5-wiso–ERA δ18O 0.81 ± 0.24 0.69 ± 0.18 0.85 and temperature Statistics 0.74 ± 0.14 0.76 ± 0.07 1.05 ± 0.23 (n = 10) (n = 3) (n = 10)
a stronger correlation coefficient (0.79). These results are strongly constrained by the cold event of 1982–1983. When focusing on the multidecadal scale, the two models produce different amplitudes of temperature and δ18O trends (Ta-ble 6). ECHAM5-wiso–ERA produces a multidecadal slope of 0.85 ‰◦C−1, while LMDZiso–ERA produces a slope of 1.26 ‰◦C−1.
The inter-annual correlation coefficient between annual mean temperature and NEEM ice core δ18O (Table 5) is very weak for the LMDZiso–20CR simulation and varies from 0.31 to 0.49 for the ERA-nudged simulations with MAR, ECHAM5-wiso and LMDZiso. Such correlation strengths are comparable to those obtained within each simulation, and comparable to those obtained between the NEEM ice core δ18O and the simulated δ18O. For ECHAM5-wiso and LMDZiso, we observe a stronger correlation
with precipitation-weighted temperatures (calculated from monthly outputs) than with annual mean temperature (R in-creases up to 0.67 in LMDZiso). This is not consistent with the recent finding that the isotopic composition of summer surface snow may record a continuous signal due to ex-changes with the surface vapour isotopic composition, itself related to temperature, rather than a precipitation-weighted signal (Steen-Larsen et al., 2014).
Correlations calculated from the gridded reconstruction are comparable to those obtained using atmospheric model outputs (0.55 for the first reconstruction) and a loss of corre-lation prior to 1958 (down to 0.3–0.4). When considering SW Greenland instrumental temperature, the strength of the cor-relation with NEEM ice core δ18O depends on the season and is strongest in JJAS, as previously reported, where it reaches 0.42 for 1958–2011. Surprisingly, the correlation with DJFM
Table 7. Calculations of NEEM accumulation–surface-air-temperature relationship for the period 1979–2007 using all sources of information.
Source data Accumulation–
temperature
relationship %◦C−1
NEEM accumulation 9.5
Annual mean SW coastal temperature
NEEM accumulation 8.1
NEEM temperature reconstruction
NEEM accumulation 8.2
NEEM borehole temperature inversion
NEEM accumulation 13.6 MARv3.4–ERA temperature NEEM accumulation 12.6 MARv3.4–NCEP temperature NEEM accumulation 13.6 MARv3.4–20CR temperature NEEM accumulation 12.2 LMDZiso–ERA temperature NEEM accumulation 9.8 ECHAM-5wiso–ERA temperature MARv3.4–ERA precipitation 15.9 and temperature MARv3.4–NCEP precipitation 10.8 and temperature MARv3.4–20CR precipitation 14.8 and temperature LMDZiso–ERA precipitation 12.5 and temperature ECHAM5-wiso–ERA precipitation 8.5 and temperature
Statistics for all 11.6 ± 2.6 (n = 13)
sources of information
temperature reported for the whole common time span (back to 1780) has vanished during the most recent decades, sug-gesting a decoupling between the drivers of winter coastal surface air temperature and ice sheet δ18O, possibly associ-ated with the impacts of coastal sea ice retreat near meteoro-logical stations.
During the recent period (1979 to 2007), all the temper-ature data from reconstructions and simulations depict an increasing trend (Table 5), with a magnitude ranging from 0.58◦C per decade (MAR) to 0.81◦C (ECHAM5-wiso– ERA) and up to 0.98◦C using the updated gridded recon-struction (Box et al., 2009). The high end is consistent with the temperature trend inferred from the NEEM borehole
tem--34 -32 -30 -28 -26 -24 -22 -20 -18 S urfa ce a ir t em pe ra ture 2000 1950 1900 1850 1800 1750 1700 Year CE -36 -34 -32 -30 δ18 O NEEM MAR/20CR MAR/ERA MAR/NCEP ECHAM5-wiso/ERA LMDZiso/20CR LMDZiso/ERA Reconstruction
Figure 11. Comparison of NEEM δ18O (red, in ‰) with gridded
temperature reconstructions and simulations (in◦C).
perature profile using 1000 Monte Carlo type simulations, estimated at 0.96 ± 0.02◦C per decade (1979–2011). For SW coastal Greenland instrumental temperature, the warm-ing is stronger in winter (0.95◦C per decade) than in summer (0.61◦C per decade). This may arise from associated changes in local sea ice cover.
Greenland warming since 1979 is strongly driven by changes in large-scale atmospheric circulation (Fettweis et al., 2013a; Hanna et al., 2013, 2014), possibly arising from internal variability (Ding et al., 2014). We now take ad-vantage of this recent increase in both δ18O and tempera-ture to estimate a multidecadal temporal δ18O–temperature relationship at NEEM. For this purpose, we can calculate this slope from LMDZiso–ERA and ECHAM5-wiso–ERA simulations, based on multidecadal trends in each parame-ter; we can also calculate the slope using NEEM δ18O and all reconstructions and simulations for the magnitude of the temperature trend (Fig. 11, Table 6). The resulting ranges of slopes converge within 1.05 ± 0.2 ‰◦C−1; this uncer-tainty does not account for the unceruncer-tainty associated with the estimation of each trend. From the longest temperature data set available from the MAR-20CR simulation and from the reconstruction, and the NEEM ice core δ18O data (not shown), it appears that the isotope–temperature relationship is not stable through time. When calculated over running 30-year periods, the inter-annual slope has an average value of 0.4 ± 0.3 ‰◦C−1(R = 0.32). It is strongly enhanced in the last decades as well as during the 1920s (up to 0.8 ‰◦C−1 using the reconstruction and 1 ‰◦C−1using MAR).
This slope is unusually strong, as it is even higher than spatial gradients in Greenland (Sjolte et al., 2011; Masson-Delmotte et al., 2011) and higher than the large slope re-cently observed in surface water vapour at NEEM (Steen-Larsen et al., 2014). Both the correlations with temperature and the magnitude of the slope are stronger than observed
1496 V. Masson-Delmotte et al.: Recent changes in north-west Greenland climate
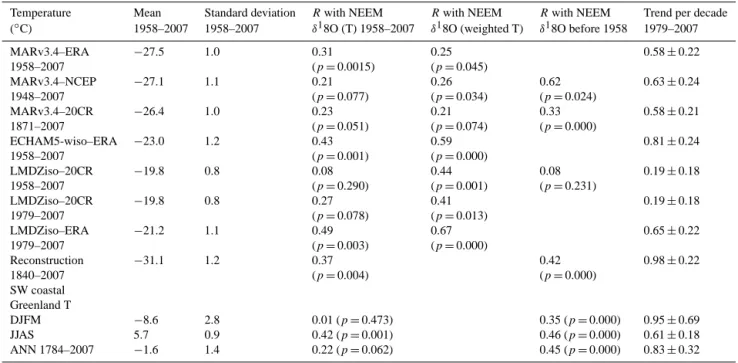
Figure 12. Map of surface air temperature change calculated from 1979 to 2011 (a) NCEP, (b) MAR-NCEP, (c) ERA-Interim, (d) MAR-ERA.
from vapour data in south Greenland (Bonne et al., 2014) and inter-annual variations during the last decades using long precipitation isotopic time series, e.g. in Europe (Rozanski et al., 1992) or Canada (Birks and Edwards, 2009), which usually show slopes of less than 0.5 ‰◦C−1. This suggests that specific amplifying processes are at play around NEEM, which increase the sensitivity of vapour and snowfall isotopic composition to local surface air temperature changes. The first potential candidate is the change in precipitation inter-mittency/seasonality. If the recent warming is associated with enhanced summer snowfall to the expense of winter snowfall, then this will also produce an enrichment of δ18O. However, none of the atmospheric simulations exploited here depicts any significant trend in the fraction of summer to annual pre-cipitation during 1979–2007. Another potential amplifier lies in the retreat of the sea ice cover in the Labrador Sea/Baffin Bay. A reduced sea ice cover may amplify regional temper-ature changes and favour enhanced storminess and enhanced precipitation (Noël, 2014), thus bringing more local moisture during summer. A stronger contribution from such nearby moisture sources is expected to enrich δ18O, in contrast with long-distance transport of moisture from the North At-lantic, associated with strong distillation (Bonne et al., 2014, 2015). Water tagging simulations performed within high-resolution atmospheric models could help to test the validity of this hypothesis. Indeed, sensitivity tests performed under warmer-than-present boundary conditions derived from cli-mate projections show that Greenland δ18O–temperature re-lationships are sensitive to patterns of nearby SST and sea ice changes (Sime et al., 2013). We suspect that differences in simulated moisture origin may also account for the 50 % difference in the simulated temporal δ18O–temperature rela-tionship at NEEM in LMDZiso–ERA and ECHAM5-wiso–
ERA for 1979–2007, and for the model–data mismatch for deuterium excess.
4.4 Relationship between surface air temperature and accumulation
Using the temperature trends from 1979 to 2007 described in Table 6, and the accumulation trend from the NEEM ice core data or from the different models, we can also estimate the multidecadal relationship between surface air tempera-ture and accumulation/precipitation (Table 7). It is reported in percentage of accumulation or precipitation increase per degree Celsius (◦C).
Large differences emerge within the different atmo-spheric simulations, with the lowest slope in ECHAM5-wiso (8.5 %◦C−1) and the highest one from MAR–ERA (15.9 %◦C−1). When using the NEEM accumulation data with the three temperature time series inferred from obser-vations (the coastal instrumental record, the gridded recon-struction and the borehole profile inversion), the estimated slope is 8.6 ± 0.8 %◦C−1. Larger values are systematically obtained when using temperature outputs from the atmo-spheric models. When considering all sources of informa-tion, we obtain a relationship of 11 ± 3 %◦C−1.
At NEEM, this estimated multidecadal accumulation sen-sitivity to temperature is significantly larger than expected from thermodynamical effects at the global scale for water vapour (+7 %◦C−1) and than simulated by global climate models for precipitation at the global scale (+3 %◦C−1) (IPCC, 2013). This implies that, at NEEM, accumulation sensitivity to temperature is driven by dynamical processes associated with storm track changes.
We therefore identify unusually strong responses of both
δ18O and accumulation to the local temperature increase over the past decades. Further investigations of moisture transport changes are needed to explore the processes at play, such as changes in storm tracks associated with sea ice retreat in the Baffin Bay area.
4.5 Implications of NEEM shallow ice core data for recent climate change
Here, we discuss results obtained at NEEM in a broader Greenland context. First, we report the spatial patterns of Greenland surface warming. Second, we investigate the strength of extreme warm-wet years identified in our NEEM ice core records (1928 and 2010 temperature anomalies; 1933 accumulation anomaly) in other Greenland records. Third, we compare the cold-dry decades of 1815–1825 and 1836–1846 in different ice core records. Finally, we investi-gate the response to volcanic eruptions in the NEEM records.
0 0.5 1 1.5 2 2.5 3 0.5 1 1.5 2 2.5 3 Jan Feb Mar Apr May Jun Jul Aug Sep Oct Nov Dec 1928 2010 85 80 75 70 65 60 -80 -70 -60 -50 -40 -30 -20 -10 NEEM PC1 3.0 2.5 2.0 1.5 1.0 0.5 0.0 1 9 2 8 te m p er atu re a n o m al y ( st an d ar d d ev u n it)
Figure 13. Temperature and δ18O anomalies during 1928. Left: comparison of seasonal temperature anomalies in 1928 and 2010. Polar graph showing the anomaly of SW Greenland temperature with respect to the average values of the earlier 30 years (1898–1927 and 1980–2009) in standard deviation units (scaled to the respective standard deviation of each 30-year interval), for 1928 (blue) and 2010 (red), as a function of the month (angle). The angle represents the month (anti-clockwise, from January to December); the distance to the disk centre represents standard deviation units (extreme monthly values will therefore be located on the outer part of the disk, with a radius above 1). Right: map
showing the strength of the 1928 temperature and δ18O anomalies for SW coastal temperature (white rectangle), for the PC1 of Greenland
δ18O (white rectangle labelled PC1) and for each ice core site, with respect to the average values in 1898–1927 and expressed in standard
deviation units.
4.5.1 Spatial patterns of recent Greenland surface warming
In the previous section, we used different model results to provide estimates of recent temperature change at NEEM. Figure 12 compares the spatial pattern of annual mean Greenland warming directly from NCEP and ERA reanal-yses, as well as MAR driven by these reanalreanal-yses, from 1979 to 2011. In reanalyses, very large surface warming trends are depicted in south, west and east Greenland (+2.4◦C). However, smaller trends are produced in places where mete-orological data are assimilated (e.g. the south Greenland tip or Summit station), suggesting that reanalyses may overes-timate the overall surface warming trend. Such caveats may arise from parameterisations of boundary layer processes and interactions between the atmosphere and the snow surface. Differences in the spatial pattern of warming are also notice-able, especially in northern Greenland.
By contrast, MAR simulates minimum warming in south-east and central Greenland, and maximum warming in the north and north-east sectors, together with the western coast in the MAR–ERA simulation. The MAR–ERA simulation produces stronger Greenland warming and a “warming hot spot” located in central north Greenland, reaching NEEM.
Evaluating the validity of these simulations (and the ex-act location of the warming hot spot) would require map-ping recent warming using a network of automatic weather stations as well as ice core records (including accumulation,
water-stable isotopes and borehole temperature profiles), for instance by updating measurements at earlier ice core sites. Implementing water-stable isotopes in MAR may also pro-vide an independent validation tool.
4.5.2 Characteristics of extreme warm-wet years: 2010, 1928 and 1933
We now investigate the spatial structure of extreme events as recorded in Greenland, with a focus on 2010 and 1928 for temperature and δ18O, and 1933 for accumulation. In or-der to have common metrics, the strength of each anomaly (calculated with respect to the average values for the earlier 30 years, considered as the background climate) is reported in standard deviation units, calculated for the preceding 3 decades. This approach allows us to make best use of existing data sets.
In NEEM δ18O, 2010 scores 2.1 while 1928 scores 3.1. This differs from the SW Greenland temperature compos-ite, where 2010 scores 2.8, as compared with 2.1 for 1928. Only during July does 1928 have a stronger expression than 2010 in southern Greenland monthly temperature (Fig. 13, left panel). The fact that NEEM ice core δ18O records 1928 with the most enriched value is consistent with the known large fraction of snowfall deposited in summer at NEEM, leading to a summer bias in δ18O. Alternatively, it is also possible that feedbacks acting above the ice sheet ampli-fied summer warming during 1928 with respect to the


![[PDF] Circuits et architecture des ordinateurs](data:image/gif;base64,R0lGODlhAQABAIAAAP///wAAACH5BAEAAAAALAAAAAABAAEAAAICRAEAOw==)