HAL Id: hal-01330735
https://hal.inria.fr/hal-01330735
Submitted on 29 Jun 2016
HAL is a multi-disciplinary open access
archive for the deposit and dissemination of
sci-entific research documents, whether they are
pub-lished or not. The documents may come from
teaching and research institutions in France or
L’archive ouverte pluridisciplinaire HAL, est
destinée au dépôt et à la diffusion de documents
scientifiques de niveau recherche, publiés ou non,
émanant des établissements d’enseignement et de
recherche français ou étrangers, des laboratoires
HPC systems
Matthieu Dorier, Orcun Yildiz, Shadi Ibrahim, Anne-Cécile Orgerie, Gabriel
Antoniu
To cite this version:
Matthieu Dorier, Orcun Yildiz, Shadi Ibrahim, Anne-Cécile Orgerie, Gabriel Antoniu. On the
en-ergy footprint of I/O management in Exascale HPC systems. Future Generation Computer Systems,
Elsevier, 2016, 62, pp.17-28. �10.1016/j.future.2016.03.002�. �hal-01330735�
Future Generation Computer Systems 00 (2016) 1–17
Computer Systems
On the Energy Footprint of I
/O Management
in Exascale HPC Systems
Matthieu Dorier
a,b, Orcun Yildiz
c, Shadi Ibrahim
c,∗, Anne-C´ecile Orgerie
d, Gabriel
Antoniu
caENS Rennes, IRISA, Rennes, France
bArgonne National Laboratory, IL 60439, USA
cInria Rennes - Bretagne Atlantique, France
dCNRS, IRISA, Rennes, France
Abstract
The advent of unprecedentedly scalable yet energy hungry Exascale supercomputers poses a major challenge in sustaining a high
performance-per-watt ratio. With I/O management acquiring a crucial role in supporting scientific simulations, various I/O management approaches have
been proposed to achieve high performance and scalability. However, the details of how these approaches affect energy consumption have not
been studied yet. Therefore, this paper aims to explore how much energy a supercomputer consumes while running scientific simulations when
adopting various I/O management approaches. In particular, we closely examine three radically different I/O schemes including time partitioning,
dedicated cores, and dedicated nodes. To do so, we implement the three approaches within the Damaris I/O middleware and perform extensive
experiments with one of the target HPC applications of the Blue Waters sustained-petaflop supercomputer project: the CM1 atmospheric model. Our experimental results obtained on the French Grid’5000 platform highlight the differences among these three approaches and illustrate in which way various configurations of the application and of the system can impact performance and energy consumption. Moreover, we propose and
validate a mathematical model that estimates the energy consumption of a HPC simulation under different I/O approaches. Our proposed model
gives hints to pre-select the most energy-efficient I/O approach for a particular simulation on a particular HPC system and therefore provides a step
towards energy-efficient HPC simulations in Exascale systems. To the best of our knowledge, our work provides the first in-depth look into the
energy-performance tradeoffs of I/O management approaches.
Keywords: Exascale Computing, Energy, I/O, Dedicated Cores, Dedicated Nodes, Damaris
1. Introduction
The energy consumption of next-generation supercomputers is a rising concern in the HPC community. While current Petascale machines consume around 10 MW, the US Defense Advanced Research Projects Agency (DARPA) has set a 20 MW power budget for Exascale machines [1]. This represents a twofold increase of energy consumption for a thousandfold increase of computation performance. This target will be achieved not only through hardware improvements, but also with novel, energy-efficient software approaches.
The increasing gap between computation performance and the performance of storage subsystems dramatically limits the scalability of many scientific simulations that have to write large amounts of data for checkpoint-based fault
The first two authors contributed equally to this work.
This work was carried out while the first author was affiliated with ENS Rennes/IRISA, France.
∗
Corresponding author
(a) Time Partitioning (b) Dedicated Cores (c) Dedicated Nodes Figure 1. Three approaches to I/O for HPC applications.
tolerance or for subsequent analysis. This lack of scalability leads to increased run times and a potential waste of energy.
Large-scale simulations traditionally exhibit a periodic behavior, alternating between computation phases, during which a set of equations is solved, and I/O phases, during which data are written out to a parallel file system. These I/O phases are commonly performed in a time-partitioning manner; all processes stop their computation and perform I/O operations at the same time either individually –each process accesses its own file (as illustrated in Figure 1 (a))– or in a collective way –all processes synchronize to access a shared file.
While many researchers have tried to enable better performance of the time-partitioning I/O approach by improv-ing collective I/O algorithms [2, 3, 4], by leveragimprov-ing subfilimprov-ing [5, 6] or by improvimprov-ing the way parallel file systems react to particular I/O patterns [7, 8], others have proposed radically different approaches. These alternative solutions can be grouped in two categories.
Dedicated cores have been proposed in large multicore nodes to offload I/O tasks to a subset of cores in each node. These cores only perform I/O on behalf of the other cores running the application. Dedicated cores have the advantage of being close to the simulation, where data is produced, thus enabling fast data transfers through shared memory [9], MPI communications [10] or a FUSE interface [11]. However, dedicated cores share the simulation’s resources, including its computational power and its local memory. Figure 1 (b) illustrates this approach.
Dedicated nodes represent another alternative approach that leverages a set of nodes dedicated to I/O operations, rather than a set of cores. These nodes access the simulation’s data through standard network communica-tions [12] or remote direct memory accesses [13]. Since dedicated nodes are better decoupled from applica-tions, they can either be deployed along with the application [14], or be integrated as part of the I/O subsystem of the platform [15], serving multiple applications. Compared with dedicated cores, however, dedicated nodes may have a larger impact on the simulation due to the necessity for communications across a network. Figure 1 (c) illustrates this approach.
Contributions. With the rise of these new I/O approaches leveraging dedicated resources, it becomes important to understand their impact not only on performance, but also on the energy consumption. In this paper, we precisely aim to evaluate the performance and the energy consumption of a simulation when using each of the aforementioned approaches: time partitioning (TP), dedicated cores (DC) and dedicated nodes (DN). To this end, we leverage the Damaris middleware [9, 16], which enables all the three approaches in one single, configurable I/O library. Our contribution is threefold.
• We first present an experimental insight into the performance and energy consumption of the CM1 atmospheric simulation [17, 18] under the three aforementioned approaches on several clusters of the French Grid’5000 [19] testbed. These experiments extend our previous study on the tradeoffs between performance and energy con-sumption [20].
• Considering that choosing the most energy-efficient approach for a particular simulation on a particular machine can be a daunting task, we provide a model to estimate the energy consumption of a simulation under different I/O approaches.
• We validate the accuracy of our proposed model using a real-life HPC application (CM1) and two different clusters provisioned on the Grid’5000 testbed. The estimated energy consumptions are within 5.7% of the measured ones for all I/O approaches.
Methodology. Our methodology in this paper is as follows. (1) We first show that some parameters including the I/O approach, the I/O frequency, the amount of data and the platform used, influence the energy consumed by an HPC application. (2) These experiments motivate the formulation of a model. We introduce some conditions on the application and some assumptions to make our model simple enough, carefully justifying that these assumptions match our experimental results. (3) We calibrate our model by measuring the scalability of the application on one hand, and the power consumption of the platform on the other. (4) We use the calibrated model to predict the energy consumption of our application under different I/O approaches and on different platforms. (5) We validate our model by comparing these predictions with experimental results.
The rest of this paper is organized as follows. Section 2 presents our experimental insight on energy consumption and performance with the TP, DC and DN approaches to I/O. Section 3 presents the model to assess the energy consumption of approaches based on dedicated resources (DC and DN). This model is validated in Section 4. We then discuss related work in Section 5, before concluding and opening to future work.
2. Experimental Insight into the Energy and Performance
In this section, we experimentally highlight the existence of a tradeoff between performance (i.e., run time) and energy consumption when using the different I/O approaches described earlier. First we present the methodology used to carry out our experiments. We then provide a detailed analysis of key results.
2.1. Tools and Platforms
Our experiments use the CM1 application with the Damaris middleware on several platforms of the Grid’5000 testbed. The following sections describe these tools in more detail.
2.1.1. The Damaris Middleware
Damaris [16] is a middleware for efficient data management in large-scale HPC simulations. It initially proposed to dedicate one core in multicore nodes to offload I/O tasks and overlap these I/O tasks with the simulation, using shared memory to transfer data from the cores running the simulation to the cores running the I/O tasks.
Over the years, Damaris has grown into a stable and well-documented software that enables any kind of data-related operations through a plugin system and a high-level, XML-based description of data structures making its API simple to use. We used Damaris in our previous work [9] to improve the I/O performance of the CM1 simulation on almost 10,000 cores of NICS’s Kraken supercomputer, achieving a more than 3.5× speedup of the simulation compared to the traditional Collective I/O approach, and a 15× improvement of aggregate I/O throughput. We also used Damaris to enable simulation/visualization coupling (in situ visualization) of the CM1 [17, 18] and Nek5000 [21] simulations on NCSA’s Blue Waters petascale computer [22].
As of today, Damaris 1.0 not only enables any number of cores to be dedicated to various data management tasks, such as I/O, compression, analysis and in situ visualization, it was also extended to support the use of dedicated nodes, and to run data management tasks in a synchronous way without dedicated resources.
To our knowledge, Damaris is the first middleware available to the community that enables all three aforemen-tioned approaches –time partitioning, dedicated cores and dedicated nodes– with the possibility to switch among them through a simple configuration file. We therefore used it in the experiments that follow.
2.1.2. Platforms
We run our experiments on the Rennes and Nancy sites of the Grid’5000 testbed [19], which include several clusters equipped with hardware for measuring the energy consumption.
On the Nancy site: we use the graphene cluster. Each node of this cluster consists of a 4-core Intel Xeon 2.53 GHz CPU with 16 GB of RAM. Intra-cluster communication is done through a 1G Ethernet network. A 20G InfiniBand network is used between these nodes and the PVFS file system deployed on 6 I/O servers. 40 nodes of the cluster are equipped with power monitoring hardware consisting of 2 Power Distribution Units (EATON PDUs), each hosting 20 outlets mapped to a specific node.
On the Rennes site: we use the parapluie cluster. Each node of this cluster has two 12-core AMD 1.7 GHz CPU with 48 GB of RAM. The nodes communicate with one another through a 1G Ethernet network and with a PVFS file system deployed on 3 I/O servers across a 20G InfiniBand network. 40 nodes of this cluster are equipped with power monitoring hardware consisting of 4 EATON PDUs, each hosting 10 outlets mapped to a specific node.
We acquire coarse and fine-grained power monitoring information from PDUs using the Simple Network Man-agement Protocol (SNMP). We measure the energy consumption with a resolution of one second.
2.1.3. The CM1 Application
We use the CM1 application for our experiments. CM1 is used for atmospheric research and is suitable for modeling small-scale atmospheric phenomena such as thunderstorms and tornadoes. It follows a typical behavior of scientific simulations, which alternate computation phases and I/O phases. The simulated domain is a regular 3D grid representing part of the atmosphere. Each point in this domain is characterized by a set of variables such as local temperatureor wind speed. CM1 is written in Fortran 90. Parallelization is done using MPI, by distributing the 3D array along a 2D grid of equally-sized subdomains, each of which is handled by a process. The I/O phase leverages either HDF5 to write one file per process, or pHDF5 [23] to write in a shared file in a collective manner. Since the file-per-process approach yielded better results than the Collective I/O approach on our platform, we extracted the I/O part of CM1 and transformed it into a plugin for Damaris. We then replaced calls to HDF5 in CM1 by the appropriate calls to Damaris, thus enabling the TP, DC and DN approaches in CM1 with the same plugin. Using this plugin, Damaris is able to aggregate datasets into bigger HDF5 files when dedicated resources are used, rather than producing one file per simulation process.
2.1.4. Overview of Investigated Parameters
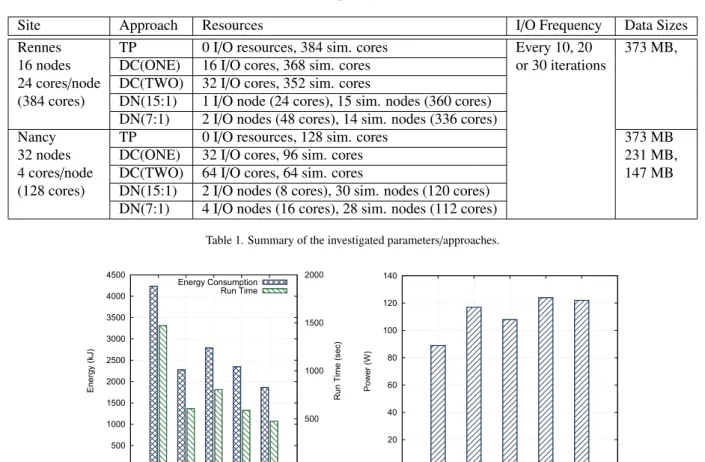
We deploy CM1 on 32 nodes (128 cores) on the Nancy site. On the Rennes site, we deploy it on 16 nodes (384 cores). In both cases, we configure CM1 to complete 2520 time steps. We vary its output frequency, using 10, 20 or 30 time steps between each output. CM1 is configured to write 373 MB of data at each iteration, using the HDF5 format. Damaris is configured to run with CM1 in five different scenarios that cover the three I/O approaches considered: time partitioning (TP), dedicated cores (one or two – DC(ONE) and DC(TWO)), and dedicated nodes using a ratio of 7:1 (DN(7:1), 7 simulation nodes for one dedicated node) or 15:1 (DN(15:1), 15 simulation nodes for one dedicated node). DN(7:1) thus uses four dedicated nodes on the Nancy site, two on the Rennes site. DN(15:1) dedicates two nodes on the Nancy site, one on the Rennes site.
In our first set of experiments, performed on Nancy, the output frequency is set to 10 time steps. In order to understand the impact of the output frequency, we modify it to 20 and 30 in our second set of experiments. The third set of experiments varies the amount of data output by CM1. Finally to illustrate the impact of the system’s architecture, the third set of experiments consists of running the first set of experiments on the Rennes site and compare the results with the Nancy site. Table 1 summarizes the configurations we investigated.
2.2. Experimental Results
The following sections discuss our experimental results. 2.2.1. Impact of the I/O Approach
This first set of experiments is carried out on Nancy. We aim to show the impact of the I/O approach chosen on the overall performance and energy consumption.
Site Approach Resources I/O Frequency Data Sizes
Rennes TP 0 I/O resources, 384 sim. cores Every 10, 20 373 MB,
16 nodes DC(ONE) 16 I/O cores, 368 sim. cores or 30 iterations
24 cores/node DC(TWO) 32 I/O cores, 352 sim. cores
(384 cores) DN(15:1) 1 I/O node (24 cores), 15 sim. nodes (360 cores) DN(7:1) 2 I/O nodes (48 cores), 14 sim. nodes (336 cores)
Nancy TP 0 I/O resources, 128 sim. cores 373 MB
32 nodes DC(ONE) 32 I/O cores, 96 sim. cores 231 MB,
4 cores/node DC(TWO) 64 I/O cores, 64 sim. cores 147 MB
(128 cores) DN(15:1) 2 I/O nodes (8 cores), 30 sim. nodes (120 cores) DN(7:1) 4 I/O nodes (16 cores), 28 sim. nodes (112 cores)
Table 1. Summary of the investigated parameters/approaches.
0 500 1000 1500 2000 2500 3000 3500 4000 4500 TP DC(ONE) DC(TWO) DN(15:1) DN(7:1) 0 500 1000 1500 2000 Energy (kJ)
Run Time (sec)
Energy Consumption Run Time
(a) Energy vs. Completion Time
0 20 40 60 80 100 120 140 TP DC(ONE) DC(TWO) DN(15:1) DN(7:1) Power (W)
(b) Average Power Usage
Figure 2. Energy consumption, completion time and power usage of the different I/O approaches on the Nancy site of Grid’5000, with CM1.
Results Discussion. In terms of performance, Figure 2 (a) shows that the time-partitioning approach performs poorly; an observation already made in our previous work [9], and that initially motivated the development of Damaris. This poor performance results from the contention for the access to the storage system, which causes a high variability of write time across processes. As a result, all processes have to wait for the slowest one to complete its I/O before starting the next iteration. This variability also results in significant waste of energy, as idle cores remain powered on while waiting.
On the other hand, approaches that perform I/O asynchronously achieve considerably better performance. Among these approaches, dedicating nodes with a 7:1 ratio outperforms the other configurations in terms of run time. The larger impact of approaches based on dedicated cores on the simulation’s run time can be explained by the small num-ber of cores per node. Dedicating even one of these cores already removes a substantial fraction of the computation capacity (25% when dedicating one core, 50% when dedicating two) from the simulation. In approaches based on dedicated nodes, the ratio between computation nodes and I/O nodes is important: when only two nodes are dedi-cated (i.e., with the 15:1 ratio), a bottleneck appears in the I/O nodes because they are not able to complete their I/O operations in the time the simulation takes to complete 10 time steps. Therefore, the simulation has to block.
In terms of energy consumption, Figure 2 (a) shows a correlation between completion time and energy consump-tion. We also note that the DC(ONE) and DN(15:1) configurations exhibit very similar performance both in terms of run time and energy consumption, although one uses dedicated cores while the other leverages dedicated nodes.
Figure 2 (b) illustrates the power behavior of the different configurations by showing the average power usage (energy consumption divided by run time). The power usage of the time-partitioning configuration is lower than that
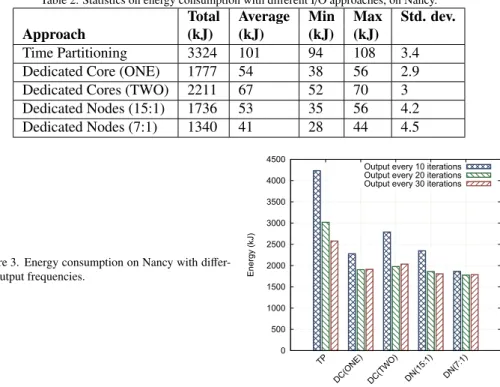
Table 2. Statistics on energy consumption with different I/O approaches, on Nancy.
Total Average Min Max Std. dev.
Approach (kJ) (kJ) (kJ) (kJ)
Time Partitioning 3324 101 94 108 3.4
Dedicated Core (ONE) 1777 54 38 56 2.9
Dedicated Cores (TWO) 2211 67 52 70 3
Dedicated Nodes (15:1) 1736 53 35 56 4.2
Dedicated Nodes (7:1) 1340 41 28 44 4.5
Figure 3. Energy consumption on Nancy with di
ffer-ent output frequencies.
0 500 1000 1500 2000 2500 3000 3500 4000 4500 TP DC(ONE) DC(TWO) DN(15:1) DN(7:1) Energy (kJ)
Output every 10 iterations Output every 20 iterations Output every 30 iterations
of other approaches. This is a direct consequence of the I/O performance variability across processes: many processes indeed remain idle while waiting for the I/O phase to complete. The power usage of an idle core is lower than the power usage of a core performing computation, which leads to a lower average power usage.
Table 2 shows statistics on the cluster-wide energy consumption, including the minimum, maximum and standard deviation of energy consumption across nodes. We observe a higher variability in energy consumption with the dedicated-node approach (standard deviation of 4.5). This variability results from the fact that nodes running the simulation and dedicated nodes do not have the same workload to complete.
Offloading I/O to dedicated resources allows the cores running the simulation to keep performing computation without waiting, increasing their average power usage. The variability in power usage is offloaded as well to dedicated resources, as they spend most of their time idle, waiting for data to be sent by the simulation, or waiting for their I/O to complete. Therefore, we observe a similar power usage among these configurations.
2.2.2. Impact of the Output Frequency
How frequently a simulation outputs data is also a factor to consider when looking for the best I/O approach. We therefore varied the output frequency of the CM1 application by making it output data every 10, 20 or 30 time steps. Results Discussion. Figure 3 shows the total energy consumption with all five configurations with these different out-put frequencies. Unsurprisingly, these results show a correlation between energy consumption and outout-put frequency with the time-partitioning approach: the more frequently the simulation produces data, the longer its run time and therefore, the higher its energy consumption.
In configurations that use dedicated resources, there is no clear difference between the last two output frequencies (i.e., every 20 and 30 iterations). This is due to the fact that in both cases, I/O tasks for an iteration are completed by dedicated resources before the next iteration of data is produced by the simulation, thus the run time is the same and the energy consumption is similar. We observe an increase in the energy consumption only when the frequency is high enough to start impacting the simulation, that is, when dedicated resources do not have enough time to complete the I/O tasks in the interval between two output from the simulation. Only, DN(7:1) seems to provide enough resources to sustain such a high output frequency without impacting the simulation in terms of energy consumption.
0 500 1000 1500 2000 2500 3000 3500 TP DC(ONE) DC(TWO) DN(15:1) DN(7:1) Energy (kJ) 373 MB 231 MB 147 MB
(a) Energy Comsumption
0 100 200 300 400 500 600 700 800 900 1000 TP DC(ONE) DC(TWO) DN(15:1) DN(7:1)
Run time (sec)
373 MB 231 MB 147 MB
(b) Completion Time
Figure 4. Energy consumption and run time of the application on Nancy with different data volumes per iteration, using different approaches to I/O.
2.2.3. Impact of the amount of data
The amount of data output by the simulation may have an impact on the energy consumption depending on the I/O approach used. For instance with a time-partitioning approach, a larger amount of data imposes a longer run time, and therefore a higher energy consumption. To evaluate this impact, we run CM1 on the Nancy site with different amounts of data (set by disabling some of the variables from the output): 373 MB, 231 MB and 147 MB per iteration. Figure 4 shows the resulting energy consumption and run time. An expected result is that the amount of data has an impact on the run time when using time-partitioning, but not when using dedicated resources. This leads to an increase of energy consumption as the amount of data increases with a time-partitioning approach. An unexpected result, however, is the increase of energy consumption in dedicated cores when the amount of data decreases. After discussions with the Mpich developers, we found that this increase is due to the way MPI Waitany is implemented in Mpich (this function is used by dedicated cores to wait for incoming data from the simulation). Because of the different communication channels used by Mpich (shared-memory-based inside a node, network-based outside) MPI Waitany has to deal with communications from different types of channels and therefore enters an active loop that consumes more energy than making the process wait for an interruption. Overall, the more time dedicated cores spend doing I/O, the less they spend in this active loop that consumes energy.
2.2.4. Impact of the System’s Architecture
Our last set of experiments aims to show the effect of the system’s architecture on the performance and energy consumption. We therefore reproduced on the Rennes site the experiments carried out in Section 2.2.1 on the Nancy site.
Results Discussion. Figure 5 (a) presents the energy consumption and performance of the five configurations. This time, dedicating one core per node outperforms the other configurations both in terms of performance and energy consumption. The reason behind this result is a lower impact on the simulation when 1 core out of 24 is dedicated to I/O, compared to dedicating 1 core out of 4 on the Nancy site. Dedicating nodes seems to lower the performance of the simulation and increase its energy consumption compared to dedicating cores. We explain this result by the fact that a larger number of cores in computation nodes send their data to dedicated nodes, which leads to a higher network contention and, thus, an increase of the simulation’s run time.
Figure 5 (b) presents the related power usage. Again, we notice a similar behavior among approaches that leverage dedicated resources, while the average power usage of the time-partitioning configuration is much lower.
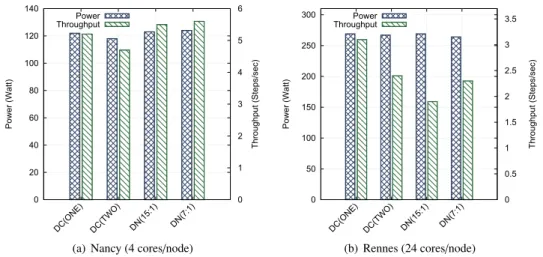
Figure 6 compares the energy consumption on the Nancy and Rennes sites, and Figure 7 depicts the performance (in number of steps per second) and average power usage during the simulation using the two system architectures. The results indicate that the comparative behavior of the different approaches with respect to performance and energy
0 2000 4000 6000 8000 10000 12000 14000 16000 TP DC(ONE)DC(TWO) DN(15:1) DN(7:1) 0 1000 2000 3000 4000 5000 Energy (kJ)
Run Time (sec)
Energy Consumption Run Time
(a) Energy vs. Completion Time
0 50 100 150 200 250 300 TP DC(ONE) DC(TWO) DN(15:1) DN(7:1) Power (W)
(b) Average Power Usage
Figure 5. Energy consumption, completion time and power usage of the different I/O approaches on the Rennes site of Grid’5000, with CM1.
Figure 6. Energy consumption on Nancy and Rennes
sites with different I/O approaches.
1500 2000 2500 3000 3500 4000 4500 5000 5500 6000 DC(ONE) DC(TWO) DN(15:1) DN(7:1) Energy (kJ) 4 Cores/Node 24 Cores/Node
0 20 40 60 80 100 120 140 DC(ONE) DC(TWO) DN(15:1) DN(7:1) 0 1 2 3 4 5 6 Power (Watt) Throughput (Steps/sec ) Power Throughput
(a) Nancy (4 cores/node)
0 50 100 150 200 250 300 DC(ONE) DC(TWO) DN(15:1) DN(7:1) 0 0.5 1 1.5 2 2.5 3 3.5 Power (Watt) Throughput (Steps/sec ) Power Throughput (b) Rennes (24 cores/node)
Figure 7. Average power usage and throughput with different I/O approaches on the Nancy and Rennes sites of Grid’5000.
efficiency depends on the system on which they run. With a larger number of cores per node, it becomes more efficient both in terms of run time and energy consumption to dedicate some of these cores to perform I/O tasks. Platforms with a lower number of cores per node, on the other hand, benefit from a configuration based on dedicated nodes. Besides the number of cores per node, we can also attribute these different behaviors to the different hardware used on each site (i.e., Intel 2.53 GHz CPU on Nancy and AMD 1.7 GHz CPU on Rennes).
2.2.5. Conclusion
While a time-partitioning configuration always appears to perform poorly and to consume more energy, the choice of the appropriate configuration, whether one targets lower energy consumption or smaller run time, depends on many factors, including the output frequency, the amount of data and the system’s architecture. In the following section, our goal is precisely to provide a model of energy consumption that will help users select the best configuration.
3. Model of Energy Consumption for I/O Approaches
Having measured the energy consumption of a simulation under different I/O approaches and illustrated the influ-ence of various parameters, we now aim to provide a model capable of predicting this energy consumption.
3.1. Intuition
The model we develop aims to provide an estimation of the energy consumed by an application under different I/O approaches and configurations of these approaches. The key idea of our model is that I/O approaches based on dedicated resources have an impact on the way the simulation scales and utilizes its resources (cores and nodes). Additionally, these resources have a different behavior when used to perform computation or to perform other tasks such as I/O. Understanding these behaviors and how the application scales on a given platform will help understand the energy consumption.
As an example, if the application scales poorly across the cores of a single node (e.g., as a result of memory contention) but makes a good utilization of the network and scales well across a large number of nodes, using dedicated I/O cores should lead to a smaller run time than using dedicated I/O nodes, and thus to a lower energy consumption. But if at the same time the platform on which the application runs is very efficient at conserving energy on nodes that stay idle most of the time (such as I/O nodes), we may be inclined to leverage dedicated nodes rather than dedicated cores. The choice of an I/O approach over the other is therefore not obvious, and must be based on several factors, including not only the scalability of the application, but also the power consumption of the platform under different behaviors exhibited by the application. Our model precisely aims at taking all these factors into account and combines them to give an accurate prediction of the power consumption of the application under each I/O approach.
3.2. Model Formulation
Our model only addresses the energy consumption of approaches based on dedicated resources. Indeed, the time-partitioning approach suffers from a high I/O variability due to I/O contention across processes of the simulation as well as across distinct applications sharing the access to the file system. This high variability prevents us from properly predicting the time taken by I/O phases in a time-partitioning setting.
We start by assuming that any approach that uses dedicated cores or nodes perfectly hides the I/O time from the point of view of the simulation. This implies that (1) the communication cost between the simulation and dedicated nodes, or the cost of memory copies in dedicated cores, is negligible, and (2) the actual I/O time in dedicated resources is smaller than the duration of an iteration in the simulation, so the simulation does not block waiting for dedicated resources to complete their I/O. These assumptions are realistic for computation-intensive, periodic applications, that is, applications whose primary task is to solve equations on in-memory data and periodically checkpoint some results, with an I/O time that is intended to be substantially smaller than the computation time. CM1, like most HPC simulations, falls into this category of applications and experimentally verifies our assumptions.
Under these assumptions, the energy consumption can be expressed as follows:
E= Tsim× Psim (1)
where Tsim is the total execution time of the simulation and Psimis the average power consumption during this
ex-ecution. Therefore, estimating E can be done by estimating the execution time Tsim and the average power usage
Psim.
3.2.1. Estimating the Execution Time
The execution time depends on the number of nodes (nnodes) on which the simulation runs, the number of cores
per node (ncores) used by the simulation, and the scalability of the application with respect to these numbers. We
call scores(k) the scalability of the application when using k cores on a single node, and snodes(k) the scalability of the
application when deployed on k nodes. The scalability is defined as a value between 0 and 1, 1 representing a perfect scaling of the application across the specified number of cores or nodes, that is, a task distributed on twice as many resources will take half the time to complete. We call niterthe number of iterations that the application executes, and
Tbasethe time to complete one iteration on one single core of one node. Putting everything together,
Tsim=
Tbase
(ncores× scores(ncores))(nnodes× snodes(nnodes))
(2) This formula assumes an independence between the scalability across cores and across nodes. The scalability functions scoresand snodes, as well as Tbase, have to be profiled by running the simulation on different numbers of cores
and nodes without I/O.
3.2.2. Estimating the Power Usage
A node can be either computing or idle. These two states lead to two power usage metrics Pmaxand Pidle. Their
respective values can be obtained through hardware profiling, and will be used to estimate the power consumption Psimof the simulation during its run.
Since communication tasks constitute a very small part of computation-intensive applications, we consider that its related power consumption does not change significantly with the different number of nodes involved. Modeling the energy actually consumed by communications is outside the scope of this work. The effect of communication phases on the simulation’s run time is however still present in our model through the scalability functions, since these functions depend on the scalability of communication phases as well.
When using dedicated nodes, the nodes running the simulation have a power behavior different from that of a dedicated node. We call cnthe number of nodes used by the simulation, and dnthe number of dedicated nodes. We
derive:
Psim=
cnPmax+12(Pidle+ Pmax)dn
cn+ dn
(3) To simplify our model, we set the power consumption of a dedicated node to the average between Pmax and
0 5 10 15 20 25 0 5 10 15 20 250 2 4 6 8 10 12 14 16 18 20
Speedup Time (sec)
Number of Cores Perfect Scaling
Time Speedup
(a) Scalability with respect to the number of cores within a node. 1 2 3 4 5 6 7 8 1 2 3 4 5 6 7 80.1 0.2 0.3 0.4 0.5 0.6 0.7 0.8 0.9 1
Speedup Time (sec)
Number of Nodes Perfect Scaling
Time Speedup
(b) Scalability with respect to the number of nodes.
Figure 8. Scalability of CM1 with respect to the number of cores and with respect to the number of nodes. Experiments done on the Rennes site of Grid’5000.
simplification. A more precise model would require to take into account the power usage when a node is performing I/O, and the ratio between I/O time and idle time in dedicated nodes.
Using dedicated cores, all nodes are used for computation. We argue that the presence of dedicated cores does not significantly change the power consumption of the node, especially when the nodes feature a large number of cores. In fact, this assumption matches the fact that the active loop in dedicated cores (explained in Section 2.2.3) keeps the core busy most of the time. Therefore our model slightly overestimates the energy consumption and defines its power behavior as:
Psim= Pmax (4)
3.3. Application and Hardware Profiling
Our model is based on several parameters that depend on the considered application (the scalability functions scores
and snodes), and on the hardware on which the application runs (the power usage Pmaxand Pidle). We perform a set of
microbenchmarks to obtain these values. We provide profiling results on Grid’5000’s parapluie cluster, described in Section 2.1.
3.3.1. Application Scalability
To assess the scalability of CM1, we run it on different numbers of cores and nodes. Figure 8 (a) shows the run time and the speedup as a function of the number of cores. It shows that CM1 presents a speedup that is better than linear scaling for 2 to 12 cores. Since the same simulation domain is spread across more cores, we hypothesize that this unexpectedly better-than-optimal speedup stems from better memory usage. Indeed as we increase the number of cores, each core has a smaller domain to work on, and thus can better use its cache. When going beyond 16 cores however, the speedup starts becoming sublinear because of the overhead in communications.
Figure 8 (b) presents the run time and the speedup as a function of the number of nodes. Here the speedup is always sublinear, which stems from communication overheads. Similar strong-scaling tests (i.e., measured performance with different numbers of nodes for a fixed global domain size) have been conducted by the developers of CM1.3
Note that these figures present the speedup, that is, the part of the formulas corresponding to ncores× scores(ncores)
and nnodes× snodes(nnodes). The scalability functions scoreand snodecan be derived by dividing the measured speedup
by the cores (for scores) or nodes (for snodes). From these runs, we obtain Tbase= 18.1 seconds as the computation time
with one core on one node.
160 180 200 220 240 260 280 300
node1 node2 node3 node4 node5 node6 node7 node8
Power (Watts)
(a) Idle power usage.
160 180 200 220 240 260 280 300
node1 node2 node3 node4 node5 node6 node7 node8
Power (Watts)
(b) Average power usage during the simulation. Figure 9. Power usage of the parapluie cluster of Grid’5000 when the nodes are idle and when they run the simulation
3.3.2. Power Usage
To profile Pidleand Pmaxwe use the PDUs attached to some of the nodes. We retrieve the power measurements
using the Simple Network Management Protocol (SNMP) with a resolution of 1 second.
Figure 9 (a) presents the idle power consumption of a set of 8 nodes instrumented with such PDUs. Figure 9 (b) shows the power consumption of the same 8 nodes when they run the simulation.
After performing these measurements, we take their average as values for Pidleand Pmax. The significant variance
in the power used by the nodes of the same cluster shows the importance of profiling on several nodes. A long-running HPC application can amortize the cost of our profiling approach, which is performed only once for a particular hardware.
4. Model Validation
In this section, we validate our model by evaluating it against experimental results on the Rennes and Nancy clusters of the Grid’5000.
4.1. Rennes Cluster
In order to validate our model, we perform a set of experiments on the parapluie cluster of Grid’5000 (Rennes). We configure CM1 to run 2520 iterations on 16 nodes (384 cores), writing data every 30 iterations. 3 other nodes are used by the PVFS file system.
Damaris uses one of four configurations: dedicating one (DC(ONE)) or two cores (DC(TWO)), and dedicating one (DN(15:1)) or two nodes (DN(7:1)). As our model does not include the time-partitioning approach, we left it out in our validation.
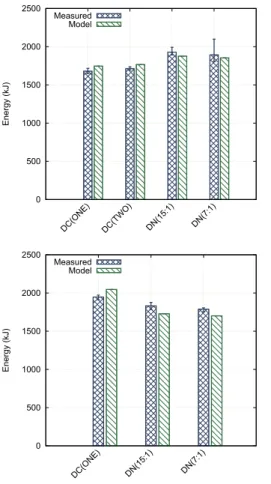
We measure the energy consumption for each configuration. Each experiment is repeated five times. Figure 10 shows the results of these experiments and the estimations provided by the model. The worst relative difference we observe between our model and the experimental results is 4%, when employing one dedicated core per node (i.e., DC(ONE)). We observe a greater variability across experiments with the DN(7:1) configuration. This is due to a few iterations during which the network bandwidth of the system dropped, most probably because of contention with other users of the cluster, causing dedicated nodes to spend more time writing data than the time needed for the application to complete 30 iterations.
One major result here is that our model is able to predict the best I/O approach among the four proposed ones. In this case, dedicating one core per node appears to be the best approach in terms of energy consumption.
0 500 1000 1500 2000 2500 DC(ONE) DC(TWO) DN(15:1) DN(7:1) Energy (kJ) Measured Model
Figure 10. Observed and estimated energy consump-tion with different I/O approaches on the Rennes site
of Grid’5000. Error bars represent minimum and
maximum measured values out of five runs.
0 500 1000 1500 2000 2500 DC(ONE) DN(15:1) DN(7:1) Energy (kJ) Measured Model
Figure 11. Observed and estimated energy
consump-tion with different I/O approaches on the Nancy site of
Grid’5000. Error bars represent minimum and maxi-mum measured values our of five runs.
4.2. Nancy Cluster
To further test our model’s accuracy, we conduct a set of experiments on the graphene cluster of Grid’5000 (Nancy). We run CM1 on 32 nodes (128 cores) with 6 additional nodes for PVFS. We use the configuration of CM1 presented earlier. Damaris is configured to run with either one dedicated core per node (DC(ONE)), or one or two dedicated nodes (respectively DN(15:1) and DN(7:1)). We left out the configuration featuring two dedicated cores, as it has a large performance impact on a 4-core/node cluster (the performance of CM1 would drop by half). We employ the same type of profiling method as described in Section 3.3.
Each experiment is repeated five times. Figure 11 shows the observed energy consumption for each approach, as well as the estimations of our model. The worst relative difference observed is 5.7%, when using one dedicated node (DN(15:1) configuration). Our model is again able to predict the best configuration. In this case, the best configuration consists of using one dedicated node. Here given the small number of cores per node, dedicating one core (i.e. 1 out of 4) to I/O is not the best approach.
Table 3 summarizes the accuracy of our model on the two platforms and with all tested configurations.
Site Approach Accuracy
Rennes Dedicated Core (ONE) 96.0%
Dedicated Cores (TWO) 96.9% Dedicated Nodes (15:1) 97.3% Dedicated Nodes (7:1) 98.0%
Nancy Dedicated Core (ONE) 95.0%
Dedicated Nodes (15:1) 94.3% Dedicated Nodes (7:1) 95.0%
Table 3. Accuracy of the model on Rennes and Nancy sites with all configurations tested.
5. Discussion and Related Work
5.1. Profiling Energy Consumption of HPC Simulations
Gamell et al. [24] provide a power model for the in situ analysis of the S3D turbulent combustion code. They investigate the roles of the system’s architecture, the algorithm design and various deployment options. In their power model, they use the Byfl compiler analysis tool [25] to obtain the application’s behavior. While they explore the power behaviors of the S3D code under different scenarios, they do not address the impact of these different scenarios in terms of performance.
Kamil et al. [26] extrapolate the power consumption of the machine from that of a single rack, with AC to DC conversion in mind. They use the High Performance Linpack (HPL) benchmark, which they claim to have a similar power behavior to other compute-intensive scientific workloads. However, they also indicate that HPL is not an ideal workload for performance measurements. Therefore, while they target power efficiency in their work, their contribution is limited to the exploration of power behaviors of computation-intensive workloads. Additionally, they run the benchmarks for three minutes, which from our experience is not sufficient to represent the power behavior of an application.
Song et al. [27] present a power performance profiling framework, PowerPack, to study the power behavior of HPC Challenge benchmarks (HPCC). They focus on applications’ memory access patterns and the impact of the system size on the energy efficiency. They find that workloads that have high temporal and spatial locality spend little time waiting for data and consume more processor power compared to other workloads. In their HPCC tests, they observe that memory is the second largest power consumer after CPU. For the energy profiling, they find that embarrassingly parallel codes achieve better energy efficiency as the size of the system increases. However, for codes that are not embarrassingly parallel, the energy consumption increases faster than the performance of the workload. With the MPI FFT code they exemplify an energy consumption proportional to the number of node, while performance remains sub-linear. Therefore, they indicate that the size of the system is an important factor to consider along with application characteristics when trying to achieve efficient energy consumption.
5.2. Saving Energy
Orgerie et al. conducted a survey on the methods for improving the energy efficiency in large-scale systems [28]. It discusses methods to evaluate and model the energy consumed by computing and network resources and indicates that system energy consists of two parts: static and dynamic. The former one depends on the system size and type of components while the latter one results from the usage of the resources. A conclusion is that energy efficiency can be improved by minimizing the static part and by obtaining more performance in proportion to the dynamic part of the system. The energy consumption of computing resources is modeled, then several techniques are proposed to save energy, such as Dynamic Voltage Frequency Scaling (DVFS) [29, 30, 31, 32], software improvements [33] and hardware capabilities [34]. For networking resources, a finding is that switch fabrics are an important part of the power consumption of the network, e.g., 90% for IBM InfiniBand routers. Similarly to computing resources, the energy consumption of networking devices is not proportional to their usage.
Laros et al. [35] present the impact of CPU frequency and network bandwidth scaling on energy efficiency. They apply static changes in the CPU frequency to save energy at the cost of performance degradations. They find that the impact of the CPU frequency scaling depends on the type of workload. While computation-intensive workloads suffer from a big degradation of their performance, the energy consumption of communication-intensive workloads can be greatly improved.
A similar work has been carried out by Springer et al. [36]. They demonstrate that significant potential exists for saving energy in HPC applications without sacrificing performance. They apply dynamic frequency scaling by shifting the gears which represent the different levels of CPU frequencies. They observe that well-tuned programs such as NAS benchmarks can benefit from their approach especially during their idle time resulting from communications. The biggest contribution of their work is to be able to apply switch energy gears dynamically by observing the pressure on the memory and the location of MPI calls in the program to obtain better energy efficiency.
Fault-tolerance protocols can also be subject to optimizations of their energy efficiency. Diouri et al. [37] estimate the energy usage of different fault-tolerance protocols, including protocols based on checkpoint/restart. They study the influence of various parameters such as the checkpointing interval, number of processes, message size and number, etc. as well as hardware parameters (number of cores per node, disk type, memory, etc.). They use a calibration
approach that inspired our profiling approach, in order to take into consideration the specific hardware used in their energy estimations. Besides energy estimations, they also apply power saving techniques to improve energy efficiency. Contrary to our work however, they do not study different I/O approaches such as using dedicated cores or nodes, and the impact of these approaches on energy consumption.
Most of the studies on energy efficiency in HPC target the entire system’s power. Gamell et al. [24] separate the network component in their model, however they make assumptions for the related component type since power information for every component (in particular the NIC) is not available. Son et al. [38] target the power usage of disks. They use the SPEC2000 floating benchmark suite and generate statistical data for performance and energy consumption via a simulator similar to DiskSim. They apply proactive disk power management and also make use of code restructuring, which results in up to 43% of energy savings compared to traditional power management. This work shows that, along with hardware improvements and component-center solutions, software-driven approaches can lead to significant energy savings. This conclusion inspired us in proposing such a solution targeting I/O management strategies for HPC simulations, and we came to the same conclusion. Although the approach proposed in this paper is only relying on a software-driven strategy, it can be combined with hardware improvements (like more energy-efficient storage devices) and component-center solutions (eg. DVFS for reducing the energy consumption of CPUs) in order to further decrease the energy consumed by HPC systems.
5.3. Power Measurement Methods
The aforementioned works also differ in the methodology that they apply for power measurements. Kamil et al. [26] investigate various power measurement methodologies such as line meters, clamp meters, integrated meters and power panels, and opt for power panels in their work. Other methods can be applied, including voltage regulator models that provide current and voltage readings at node level [35], cluster specifications [24], simulators [38] and wattmeters [37]. While there is a wide range of options for measuring the power, most of them are subject to mea-surement errors. Therefore, power meamea-surements are generally multiplied to reduce the impact of the meamea-surement error. We also follow the same trend in our work.
6. Conclusion
Power consumption has started to severely constrain the design of HPC systems and starts influencing software solutions as well. As the amount of data produced by large-scale simulations explodes, it becomes necessary to find solutions to I/O that are not only fast, but also energy efficient.
Our detailed study of three I/O approaches, all implemented in the Damaris framework, reveals significant differ-ences in the performance of the CM1 application as well as its energy consumption. Four factors at least contribute to such differences. First, the adopted I/O approach and its configuration. Second, the output frequency. Third, the amount of data output, and finally fourth, the architecture on which the application runs, and in particular the number of cores per multicore node.
As choosing the right I/O approach to save energy for a particular scenario can be difficult, we provided a model that helps scientist to estimate the energy consumption of their application on a particular platform and under di ffer-ent data managemffer-ent approaches. The accuracy of our model (96.1% on average) and its validation with the CM1 application shows that it can effectively guide the user toward the most energy-efficient configuration.
As future work, we plan to explore the use of dedicated resources to implement energy-saving approaches. In particular, dedicated resources could benefit from DVFS techniques, or be more productively used by enabling com-pression to reduce the amount of data and thus lower the energy consumption originating from data transfers.
A second direction that we will investigate thus concerns the tradeoff between performance and energy consump-tion in a context where data compression is leveraged on dedicated resources. I/O approaches based on dedicated resources indeed offer the possibility to run post-processing tasks without slowing down the simulation. On one hand, compression reduces the amount of data transferred and thus, the network traffic, which leads to lower energy con-sumption from data movements. On the other hand, compressing data requires more computation time and higher energy consumption as a result of data movement in the local memory hierarchy. We can thus expect again a tradeoff between energy, performance and compression level.
7. Acknowledgment
The experiments presented in this paper were carried out using the Grid’5000/ALADDIN-G5K experimental testbed, an initiative from the French Ministry of Research through the ACI GRID incentive action, INRIA, CNRS and RENATER and other contributing partners (see http://www.grid5000.fr/ for details).
References
[1] J. Hruska, DARPA summons researchers to reinvent computing, http://www.extremetech.com/computing/
116081-darpa-summons-researchers-to-reinvent-computing, viewed on June 2014, 2012.
[2] R. Thakur, W. Gropp, E. Lusk, Data Sieving and Collective I/O in ROMIO, Symposium on the Frontiers of Massively Parallel Processing (1999) 182.
[3] A. Ching, A. Choudhary, W. keng Liao, R. Ross, W. Gropp, Non-Contiguous I/O through PVFS, IEEE Computer Society, Los Alamitos,
CA, USA, 2002, p. 405. doi:http://doi.ieeecomputersociety.org/10.1109/CLUSTR.2002.1137773.
[4] P. M. Dickens, R. Thakur, Evaluation of collective I/O implementations on parallel architectures, Journal of Parallel and Distributed
Computing 61 (2001) 1052 – 1076.
[5] K. Gao, W.-k. Liao, A. Nisar, A. Choudhary, R. Ross, R. Latham, Using subfiling to improve programming flexibility and performance of
parallel shared-file I/O, in: Parallel Processing, 2009. ICPP’09. International Conference on, IEEE, 2009, pp. 470–477.
[6] W. Frings, F. Wolf, V. Petkov, Scalable massively parallel I/O to task-local files, in: Proceedings of the Conference on High Performance
Computing Networking, Storage and Analysis, SC’09, ACM, New York, NY, USA, 2009, pp. 1–17. doi:http://doi.acm.org/10.1145/ 1654059.1654077.
[7] P. Carns, S. Lang, R. Ross, M. Vilayannur, J. Kunkel, T. Ludwig, Small-File Access in Parallel File Systems, International Parallel and Distributed Processing Symposium (2009) 1–11.
[8] J. Bent, G. Gibson, G. Grider, B. McClelland, P. Nowoczynski, J. Nunez, M. Polte, M. Wingate, PLFS: a checkpoint filesystem for parallel
applications, in: ACM/IEEE SC ’09, 2009, pp. 1–12.
[9] M. Dorier, G. Antoniu, F. Cappello, M. Snir, L. Orf (Joint INRIA/UIUC Laboratory for Petascale Computing, Grid’5000), Damaris: How
to Efficiently Leverage Multicore Parallelism to Achieve Scalable, Jitter-free I/O, in: CLUSTER - IEEE International Conference on Cluster
Computing, IEEE, Beijing, Chine, 2012. URL: http://hal.inria.fr/hal-00715252.
[10] X. Ma, J. Lee, M. Winslett, High-level buffering for hiding periodic output cost in scientific simulations, IEEE Transactions on Parallel and
Distributed Systems 17 (2006) 193–204.
[11] M. Li, S. Vazhkudai, A. Butt, F. Meng, X. Ma, Y. Kim, C. Engelmann, G. Shipman, Functional partitioning to optimize end-to-end
per-formance on many-core architectures, in: Proceedings of the 2010 ACM/IEEE International Conference for High Performance Computing,
Networking, Storage and Analysis, IEEE Computer Society, 2010, pp. 1–12.
[12] F. Isaila, J. G. Blas, J. Carretero, R. Latham, R. Ross, Design and evaluation of multiple level data staging for Blue Gene systems, IEEE Transactions on Parallel and Distributed Systems 99 (2010).
[13] C. Docan, M. Parashar, S. Klasky, Enabling high-speed asynchronous data extraction and transfer using DART, Concurrency and Computa-tion: Practice and Experience (2010) 1181–1204.
[14] H. Abbasi, M. Wolf, G. Eisenhauer, S. Klasky, K. Schwan, F. Zheng, DataStager: Scalable data staging services for petascale applications, in: Proceedings of the 18th ACM international symposium on High performance distributed computing, HPDC’09, ACM, New York, NY, USA, 2009, pp. 39–48. doi:http://doi.acm.org/10.1145/1551609.1551618.
[15] N. Ali, P. Carns, K. Iskra, D. Kimpe, S. Lang, R. Latham, R. Ross, L. Ward, P. Sadayappan, Scalable I/O forwarding framework for high-performance computing systems, in: IEEE International Conference on Cluster Computing and Workshops, 2009. CLUSTER ’09., 2009, pp. 1–10. doi:10.1109/CLUSTR.2009.5289188.
[16] Inria, Damaris http://damaris.gforge.inria.fr, 2015.
[17] Georges Bryan, UCAR, CM1 http://www.mmm.ucar.edu/people/bryan/cm1/, 2015.
[18] G. H. Bryan, J. M. Fritsch, A benchmark simulation for moist nonhydrostatic numerical models, Monthly Weather Review 130 (2002) 2917–2928.
[19] INRIA, Aladdin Grid’5000: http://www.grid5000.fr, 2015.
[20] O. Yildiz, M. Dorier, S. Ibrahim, G. Antoniu, A Performance and Energy Analysis of I/O Management Approaches for Exascale Systems, in:
DIDC ’14 Proceedings of the sixth international workshop on Data Intensive Distributed Computing, Vancouver, Canada, 2014, pp. 35–40. URL: https://hal.inria.fr/hal-01076522. doi:10.1145/2608020.2608026.
[21] J. W. L. P. F. Fischer, S. G. Kerkemeier, Nek5000 Web page, 2008. http://nek5000.mcs.anl.gov.
[22] M. Dorier, R. Sisneros, Roberto, T. Peterka, G. Antoniu, B. Semeraro, Dave, Damaris/Viz: a Nonintrusive, Adaptable and User-Friendly In
Situ Visualization Framework, in: LDAV - IEEE Symposium on Large-Scale Data Analysis and Visualization, Atlanta, United States, 2013. URL: https://hal.inria.fr/hal-00859603.
[23] C. M. Chilan, M. Yang, A. Cheng, L. Arber, Parallel I/O performance study with hdf5, a scientific data package, TeraGrid 2006: Advancing Scientific Discovery (2006).
[24] M. Gamell, I. Rodero, M. Parashar, J. C. Bennett, H. Kolla, J. Chen, P.-T. Bremer, A. G. Landge, A. Gyulassy, P. McCormick, S. Pakin,
V. Pascucci, S. Klasky, Exploring power behaviors and trade-offs of in-situ data analytics, in: Proceedings of the International Conference
on High Performance Computing, Networking, Storage and Analysis, SC ’13, ACM, New York, NY, USA, 2013, pp. 1–12. URL: http: //doi.acm.org/10.1145/2503210.2503303. doi:10.1145/2503210.2503303.
[25] S. Pakin, P. McCormick, Byfl: Compiler-based application analysis, https://github.com/losalamos/Byfl, April 2013.
[26] S. Kamil, J. Shalf, E. Strohmaier, Power efficiency in high performance computing, in: IEEE International Symposium on Parallel and
[27] S. Song, R. Ge, X. Feng, K. W. Cameron, Energy profiling and analysis of the hpc challenge benchmarks, International Journal of High Performance Computing Applications (2009).
[28] A.-C. Orgerie, M. D. d. Assuncao, L. Lefevre, A survey on techniques for improving the energy efficiency of large-scale distributed systems,
ACM Computing Surveys (CSUR) 46 (2014) 47.
[29] N. Kappiah, V. W. Freeh, D. K. Lowenthal, Just in time dynamic voltage scaling: Exploiting inter-node slack to save energy in MPI programs, in: Proceedings of the 2005 ACM/IEEE conference on Supercomputing, IEEE Computer Society, 2005, p. 33.
[30] M. Y. Lim, V. W. Freeh, D. K. Lowenthal, Adaptive, transparent frequency and voltage scaling of communication phases in MPI programs,
in: SC 2006 Conference, Proceedings of the ACM/IEEE, IEEE, 2006, pp. 14–14.
[31] D. C. Snowdon, S. Ruocco, G. Heiser, Power management and dynamic voltage scaling: Myths and facts (2005).
[32] S. Ibrahim, T.-D. Phan, A. Carpen-Amarie, H.-E. Chihoub, D. Moise, G. Antoniu, Governing energy consumption in hadoop through cpu frequency scaling: An analysis, Future Generation Computer Systems (2016) 219–232.
[33] J. Steele, Acpi thermal sensing and control in the pc, in: Wescon/98, 1998, pp. 169–182. doi:10.1109/WESCON.1998.716441.
[34] E. V. Carrera, E. Pinheiro, R. Bianchini, Conserving disk energy in network servers, in: Proceedings of the 17th annual international conference on Supercomputing, ACM, 2003, pp. 86–97.
[35] J. H. Laros, III, K. T. Pedretti, S. M. Kelly, W. Shu, C. T. Vaughan, Energy based performance tuning for large scale high performance computing systems, in: Proceedings of the 2012 Symposium on High Performance Computing, HPC ’12, Society for Computer Simulation International, San Diego, CA, USA, 2012, pp. 6:1–6:10. URL: http://dl.acm.org/citation.cfm?id=2338816.2338822.
[36] R. Springer, D. K. Lowenthal, B. Rountree, V. W. Freeh, Minimizing execution time in MPI programs on an energy-constrained, power-scalable cluster, in: Proceedings of the eleventh ACM SIGPLAN symposium on Principles and practice of parallel programming, ACM, 2006, pp. 230–238.
[37] M. E. Diouri, G. L. T. Chetsa, O. Gl¨uck, L. Lefevre, J.-M. Pierson, P. Stolf, G. Da Costa, Energy efficiency in high-performance computing
with and without knowledge of applications and services, International Journal of High Performance Computing Applications 27 (2013) 232–243.
[38] S. W. Son, G. Chen, M. Kandemir, A. Choudhary, Exposing disk layout to compiler for reducing energy consumption of parallel disk based systems, in: Proceedings of the tenth ACM SIGPLAN symposium on Principles and practice of parallel programming, ACM, 2005, pp. 174–185.