HAL Id: hal-02053251
https://hal.archives-ouvertes.fr/hal-02053251
Submitted on 1 Mar 2019
HAL is a multi-disciplinary open access
archive for the deposit and dissemination of
sci-entific research documents, whether they are
pub-lished or not. The documents may come from
teaching and research institutions in France or
abroad, or from public or private research centers.
L’archive ouverte pluridisciplinaire HAL, est
destinée au dépôt et à la diffusion de documents
scientifiques de niveau recherche, publiés ou non,
émanant des établissements d’enseignement et de
recherche français ou étrangers, des laboratoires
publics ou privés.
Numerical modeling of impact on wood-based sandwich
structures
John Susainathan, Florent Eyma, Emmanuel de Luycker, Arthur Cantarel,
Bruno Castanié
To cite this version:
John Susainathan, Florent Eyma, Emmanuel de Luycker, Arthur Cantarel, Bruno Castanié.
Numer-ical modeling of impact on wood-based sandwich structures. Mechanics of Advanced Materials and
Structures, Taylor & Francis, 2019, pp.0. �10.1080/15376494.2018.1519619�. �hal-02053251�
an author's http://oatao.univ-toulouse.fr/21651
https://doi.org/10.1080/15376494.2018.1519619
Susainathan, John and Eyma, Florent and De Luycker, Emmanuel and Cantarel, Arthur and Castanié, Bruno Numerical modeling of impact on wood-based sandwich structures. (2019) Mechanics of Advanced Materials and Structures. ISSN 1537-6494
Numerical
modeling of impact on wood-based sandwich structures
John Susainathana, Florent Eymaa, Emmanuel DE Luyckera,b, Arthur Cantarela, and Bruno Castaniea
a
CNRS UMR 5312-INSA-ISAE-Mines Albi-UPS, Institut Cl!ement Ader (ICA), Universit!e de Toulouse, Toulouse, France;b
EA 1905 INP-ENIT, Laboratoire G!enie de Production (LGP), Universit!e de Toulouse, Tarbes, France
ABSTRACT
The impact behavior of innovative wood based sandwich structures with plywood core and skins made either of aluminum or of fiber reinforced polymer (carbon, glass, or flax composite skins) was investigated numerically. The wood based sandwich structures were subjected to low-vel-ocity/low-energy impacts. An explicit nonlinear numerical model based on volume elements with a cohesive layer was developed. A plastic wood law already implemented in LS-DYNA was used in association with composite type damage criteria. Comparisons with experiments in terms of layer deformations and overall contact laws during impact showed satisfactory results.
KEYWORDS
Wood; impact; sandwich; damage; finite
element model
1. Introduction
Sandwich structures are well known, efficient structures that are widely used in numerous sectors such as the automotive, aerospace, marine and energy industries, due to their high spe-cific bending strength and stiffness, excellent damping and thermal insulation. Their main drawback is their naturally complex mechanical behavior, such as local buckling, which leads to cautious designs with large safety margins [1]. Another drawback is their cost and the authors have already presented a low cost sandwich structure based on a plywood core and stiffer skins made of aluminum alloy or composite [2]. The develop-ment of such structures requires many investigations before their dissemination. After a first static analysis [2], the authors focused on the issue of low-velocity/low-energy impact, which is a major concern for the sizing of sandwich structures [3–5]. The main results of the experimental part of that study are shown in reference [6] and thus the aim of the present paper is to model impact for those particular sandwich structures.
Many modeling strategies have been developed to model impacts on sandwich structures. Among others, Aminanda et al. [7, 8] have developed a discrete model of honeycomb core which is based on the understanding of postbuckling behavior during crushing of Nomex. It allows indentation, low velocity impact, residual dent and compression after impact strength to be finely captured for sandwiches with metallic skins. Different strategies must be used for other cores, such as foams, mainly using Continuum Damage Mechanics and ad-hoc laws to capture the nonlinear behav-ior [9–13]. More complex behaviors of skins are involved in the case of composite skins and very advanced models can now capture the discrete nature of the failure scenarios [14–19]. However, these models remain very complex and
require in-house finite elements or software. In our case, a robust strategy, available in commercial software, is required to model damage in the skins and in the plywood core. For the skins, it is now common to use PFA (Progressive Failure Analysis) and the results are often acceptable [20–24]. For the plywood core, a specific approach must be chosen.
Many authors have studied the behavior of wood but rarely under dynamic loading [25]. Polocos,er et al. made a
comprehensive review of dynamic testing on solid wood [26]. They argue that, due to the complexity of wood behav-ior, including viscoelastic effects, progress still needs to be made to enhance tests and to interpret the results finely.
The most common wood studied in sandwich composites under impact is balsa but it is mostly investigated from an experimental point of view or for comparison purposes, for example [27–29]. However, several authors have focused more precisely on the modeling of the crushing of wood. Toson et al. [30] studied balsa used as an energy absorber and developed a model taking account of the principal phenomena observed experimentally. The complex nonlinear properties of wood, such as non-isotropy, non-linear compressibility, softening, densifica-tion, and rate-dependency, were considered for the states of compression and shear over a large range of strain rates. Vural and Ravichandran [31] studied the dynamic behavior of balsa with Hopkinson’s bars, analyzing and modeling compression and kink band formation in the cell walls. However, these mod-els are better suited to large strain rates, which are not reached in low-velocity/low-energy impacts. Thus, a comprehensive model describing the behavior of wood, and already implemented in LS-DYNA code by Murray, is used in our context [32,33].
The experimental results presented in [6] support the modeling strategy presented in this research. A 10 mm ply-wood core was considered in order to be able to compare
the effects of skins made of aluminum alloy, and composites reinforced with glass, carbon fibers or flax, on their impact behavior (see [2] for manufacturing details and issues). These materials were impacted at energies of 5 J, 10 J, and 15 J using a drop-weight impact test. A comparison based on the force–displacement response and failure modes of the panels will be recalled briefly in the following subsection, together with additional results. Damage resistance and fail-ure modes of wood based sandwich structfail-ures under low energy impact will be described using post impact tomog-raphy analysis. Numerical modeling of the impact response of these panels will be performed using the finite element software LS-DYNA to correlate experimental results.
2. Experimental investigations
2.1. Specimens and tests
Two different plywoods and six different configurations of wood based sandwich structures were used and manufactured as noted inTable 1(for more detailed information see [2,6, 33]). The stacking patterns of the plywood are shown inTable 2. Skins were made of aluminum or a composite of polymer reinforced with fibers of carbon, glass or flax. Large plates of dimensions 500! 500 mm2 were manufactured and then cut into 150! 100 mm2samples for impact testing so as to follow AIRBUS standard AITM 1-0010. For each material configur-ation, three tests were performed: at 5 J, 10 J and 15 J (one spe-cimen per configuration and energy level). Impact tests were performed using a drop weight apparatus (Figure 1), the same device as used in [34], followed by tomography analysis. The main characteristics of our test are recalled below:
" A mass of about 2.08 kg. This mass value was set so as to achieve high enough impact energy with speeds of up to 5 m/s.
" A load sensor located under the mass, which measured the force between the impactor and the specimen during the impact;
" A 16 mm diameter hemispherical impactor;
" An optical sensor that measured the speed of the impactor immediately before impact
" A support window, of internal dimensions 125 ! 75 mm2, on which the specimen was laid (standard speci-men dispeci-mensions: 100! 150 mm2 based on Airbus
stand-ards AITM 1-0010).
" A clamping window with inner dimensions identical to those of the lower window (125 ! 75 mm2) to hold the specimen during impact.
" A kickback system to prevent multiple shocks to the specimen;
Low velocity impact tests were carried out at various impact energies: 5 J, 10 J and 15 J. These energy levels corres-pond to impacts due to the dropping of tools, for example. The orientation of the top plies of the sample served as a refer-ence for the longitudinal and transverse directions. Typical experimental force-displacement curves are shown Figure 2 for an impact at 10 J (see [6] and [33] for more details).
2.2. Additional experimental results
A typical post-impact pattern is presented in Figure 3. It can be seen that each ply undergoes severe transverse com-pression. It is pertinent to analyze the behavior of the ply-wood using the deformation of each ply. This analysis will be useful for numerical comparisons. The thickness after impact and the percentage of thickness decrease between the pristine state and after impact are provide in Tables 3–10 for the eight configurations tested.
3. Numerical model description
3.1. Overall model description
This section presents the numerical simulation of the impact tests carried out in LS-DYNA. Eight-node solid finite ele-ments with one integration point were used. A quarter sym-metric model was considered as shown in Figure 4. The support and impactor were taken to be rigid (i.e. undeform-able). The impactor was modeled with 1,952 solid elements. An initial velocity Vimp was imposed on the impactor, as
measured during experiments, and the impactor mass was chosen in order to respect its experimental kinetic energy. In the case of plywood structures, twenty elements were
Table 1. Manufactured specimens.
Core Skin Process Relative density Total Thickness (mm) Process specification
Plywood A – – 0.461 10 –
Plywood B – – 0.433 10 –
Plywood A Aluminum – 0.678 11 –
Plywood A Glass Vacuum bag molding - Prepreg 0.638 12 At 160#C for 3 h
Carbon 0.569 At 90#C for 30 min then at 125#C for 1 h
Plywood B Flax Thermo-compression - Prepreg 0.488 12 At 120#C with pressure of 4 bar for 1 h
Carbon 0.614 At 90#C for 30 min then at 120#C for 1 h,
all with pressure of 4 bar
Glass 0.609 At 160#C with pressure of 4 bar for 3 h
Table 2. Plywood A and B stacking.
Type Plies Orientation Thickness (mm) Plywood - A Okoume 0# 1 Okoume 90# 1 Poplar 0# 2 Poplar 90# 2 Poplar 0# 2 Okoume 90# 1 Okoume 0# 1 Plywood - B Okoume 0# 1 Poplar 90# 3 Okoume 0# 2 Poplar 90# 3 Okoume 0# 1
meshed in their total thickness, which means 2 elements per mm in the thickness. So, in the case of the plywood core sandwich, total plywood core A or B was meshed with 33,920 elements (Figure 4). The transverse isotropic wood material model (MAT_143) available in LS-DYNA was used to model each ply of the plywood core. A local in-plane mesh refinement was used in the impact region, as shown in Figure 4, to obtain precise strain and stress gradients. The sandwich structures with plywood core and aluminum skin were composed of one layer of aluminum for the top and bottom skins and a plywood core A, having four okoume plies and three poplar plies with different fiber ori-entations as shown in Figure 5. The mesh geometry of the 0.5 mm thick skins was designed with two elements in the thickness. Each skin was modeled with 3,392 elements. For plywood structures with composite skins, such as carbon, glass, and flax, the same impact model as shown inFigure 4 was used. The same mesh geometry for plywood A or B core led to the same number of elements (33,920 elements). The top and bottom composite skins were modeled with six elements in the thickness, so 10,176 elements were used for each composite skin. A layer of four nodes with zero thick-ness cohesive elements was inserted between the plies of
different fiber orientation composing the skins and also between the skins and the core as shown in red inFigure 5.
For all types of plywood sandwich with different skins, Tied_Nodes_To_Surface offset was utilized in the plywood core between plies of different fiber orientation. A layer of 4 point cohesive elements was used between the skins and the core as illustrated inFigure 5. These cohesive elements share nodes with the solid elements. When failure occurs, the cohe-sive elements are deleted from the simulation. To avoid errors due to negative element volume, a type 5 hourglass control and energy (HGE) coefficient value of 0.03 was used in the plywood core. An automatic_surface_to_surface contact, suitable for low energy/low velocity impact, was defined between the impactor and the top ply of the core and also at the interface between plies of plywood core in order to implement non-erosion.
Eroding single surface contact is strongly preferred between solid and cohesive elements, which can enable the model to establish contact between the surfaces through dele-tion of cohesive elements upon failure [35]. Hence, Eroding_Single_Surface contact was used between the cohe-sive layers and the skins and also between the core and the cohesive layers. An Automatic_surface_to_surface contact was defined between plies, which became active when a cohe-sive element was deleted using eroding contact. The same contact type was also used between the skin and the impactor.
3.2. Material laws used and identification of mechanical characteristics for plywoods and skins
The elastic and other material characteristics of each ply of the plywood core and of the skins were found semi-empirically by
Figure 1. Drop-weight impact test set-up and aluminum wood specimen installed.
Figure 2.Typical load displacement curves for 10 J impacts for the eight con-figurations tested.
Figure 3.Tomography images of the center of impacted plywood with alumi-num skin – Failure pattern at 15 J.
Table 3. Ply thickness analysis after impact for Plywood A.
Plywood - A Orientation Reference thickness (mm)
Thickness (mm) Thickness drop (%) 5 J 10 J 15 J 5 J 10 J 15 J Okoume 0 0.69 0.42 0.33 40 52 Okoume 90 0.94 0.72 0.70 23 26 Poplar 0 1.94 1.07 0.99 45 49 Poplar 90 2.05 1.55 1.34 24 35 Poplar 0 1.91 1.91 1.73 0 10 Okoume 90 0.89 0.89 0.89 0 0 Okoume 0 0.66 0.66 0.66 0 0
Table 4. Ply thickness analysis after impact for Plywood B.
Plywood - B Orientation Reference thickness (mm)
Thickness Thickness drop (%) 5 J 10 J 15 J 5 J 10 J 15 J Okoume 0 0.97 0.42 0.67 57 31 Poplar 90 2.89 1.80 1.47 38 49 Okoume 90 1.84 1.67 1.56 9 15 Poplar 90 2.94 2.94 2.84 0 3 Okoume 0 0.95 0.95 0.94 0 1
Table 5. Ply thickness analysis after impact for Plywood A with aluminum skins.
Plywood - A/Al Orientation Reference thickness (mm)
Thickness (mm) Thickness drop (%) 5 J 10 J 15 J 5 J 10 J 15 J Al 0.5 0.49 0.47 0.47 3 6 6 Okoume 0 0.69 0.40 0.47 0.45 41 32 35 Okoume 90 0.94 0.38 0.34 0.32 59 64 66 Poplar 0 1.94 0.71 0.67 0.62 64 65 68 Poplar 90 2.05 1.80 1.53 1.52 12 25 26 Poplar 0 1.91 1.91 1.91 1.70 0 0 11 Okoume 90 0.89 0.89 0.89 0.89 0 0 0 Okoume 0 0.66 0.66 0.66 0.66 0 0 0 Al 0.5 0.50 0.50 0.50 0 0 0
Table 6. Ply thickness analysis after impact for Plywood A with carbon skins.
Plywood - A/Carbon Orientation Reference thickness (mm)
Thickness (mm) Thickness drop (%) 5 J 10 J 15 J 5 J 10 J 15 J Carbon 0.85 0.80 0.80 0.76 6 6 11 Okoume 0 0.53 0.44 0.44 0.41 16 17 22 Okoume 90 0.95 0.84 0.80 0.79 11 15 17 Poplar 0 1.94 1.75 1.69 1.65 10 13 15 Poplar 90 2.00 1.99 1.84 1.72 0 8 14 Poplar 0 1.99 1.99 1.99 1.99 0 0 0 Okoume 90 0.99 0.99 0.99 0.99 0 0 0 Okoume 0 0.58 0.58 0.58 0.58 0 0 0 Carbon 0.91 0.91 0.91 0.91 0 0 0
Table 7. Ply thickness analysis after impact for Plywood B with carbon skins.
Plywood - B/Carbon Orientation Reference thickness (mm)
Thickness Thickness drop (%) 5J 10J 15J 5J 10J 15J Carbon 0.78 0.77 0.76 0.76 1 3 3 Okoume 0 0.91 0.77 0.77 0.69 15 16 24 Poplar 90 2.89 2.67 2.65 2.24 8 8 23 Okoume 0 1.89 1.89 1.89 1.76 0 0 7 Poplar 90 2.94 2.94 2.94 2.94 0 0 0 Okoume 0 0.79 0.79 0.79 0.79 0 0 0 Carbon 0.78 0.78 0.78 0.78 0 0 0
reverse identification with the help of the three point bend-ing tests carried out by the authors [2]. Individual identifi-cation of each linear and nonlinear characteristic would have been too long and complex and beyond the scope of the present study. The initial material constants for the numerical impact model were chosen from the literature, for example [36].
3.2.1. Damage laws for plywood core
The elastic and plastic properties of wood are different in the longitudinal, tangential, and radial directions. This is naturally represented by orthotropic behavior. At a macro-scopic scale, wood can be considered as a continuous, homogenous material, especially when dealing with first grade plywood materials where knots and heterogeneities
Table 8. Ply thickness analysis after impact for Plywood A with glass skins.
Plywood - A/Glass Orientation Reference thickness (mm)
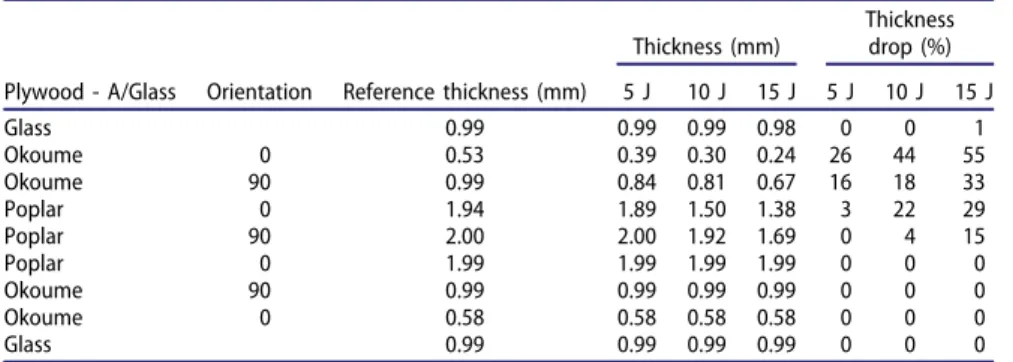
Thickness (mm) Thickness drop (%) 5 J 10 J 15 J 5 J 10 J 15 J Glass 0.99 0.99 0.99 0.98 0 0 1 Okoume 0 0.53 0.39 0.30 0.24 26 44 55 Okoume 90 0.99 0.84 0.81 0.67 16 18 33 Poplar 0 1.94 1.89 1.50 1.38 3 22 29 Poplar 90 2.00 2.00 1.92 1.69 0 4 15 Poplar 0 1.99 1.99 1.99 1.99 0 0 0 Okoume 90 0.99 0.99 0.99 0.99 0 0 0 Okoume 0 0.58 0.58 0.58 0.58 0 0 0 Glass 0.99 0.99 0.99 0.99 0 0 0
Table 9. Ply thickness analysis after impact for Plywood B with glass skins.
Plywood - B/Glass Orientation Reference thickness (mm)
Thickness (mm) Thickness drop (%) 5 J 10 J 15 J 5 J 10 J 15 J Glass 0.99 0.97 0.95 0.88 2 4 11 Okoume 0 0.97 0.97 0.88 0.88 0 9 9 Poplar 90 2.89 2.89 2.43 2.18 0 16 25 Okoume 0 1.87 1.87 1.84 1.74 0 2 7 Poplar 90 2.94 2.94 2.94 2.62 0 0 11 Okoume 0 0.95 0.95 0.95 0.95 0 0 0 Glass 0.99 0.99 0.99 0.99 0 0 0
Table 10. Ply thickness analysis after impact for Plywood B with flax skins.
Plywood - B/Flax Orientation Reference thickness (mm)
Thickness (mm) Thickness drop (%) 5 J 10 J 15 J 5 J 10 J 15 J Flax 0.78 0.75 0.74 0.72 5 6 8 Okoume 0 0.97 0.75 0.62 0.61 23 36 37 Poplar 90 2.89 2.02 1.87 1.57 30 36 46 Okoume 0 1.84 1.84 1.66 1.57 0 10 14 Poplar 90 2.94 2.94 2.94 2.94 0 0 0 Okoume 0 0.95 0.95 0.95 0.95 0 0 0 Flax 0.78 0.78 0.78 0.78 0 0 0
have been carefully removed. The longitudinal direction in wood is always much stiffer and stronger than the other two, which have comparable behavior. Hence, transverse isotropic material behavior can efficiently reproduce the main behav-ior of wood. Considering the compressive response of wood, four main stages can be distinguished [37]: first, an elastic part ended by a softening where the wood cell wall starts to collapse, then a plateau, where the crushing of wood cells continues, and, finally, a densification. At micro level, wood has a cellular structure similar to honeycomb [7].
Micro-buckling of tracheid (cell walls) occurs during longitudinal compression and this mechanism can be compared to the macro-buckling of cell walls in metallic square tube struc-tures [37] used for dissipating energy in a crash-box. Hence, Maillot et al. [38] compare three different material models in
LS-DYNA, such as the honeycomb material model
(MAT_26), the modified honeycomb material model
(MAT_126) and the Wood material model (MAT_143), in order to improve the modeling of the longitudinal compres-sion response of balsa wood. Maillot et al. found that the
Figure 5. Cohesive element locations (red lines – color figure available online).
current wood material model (MAT_143) could only tune the transition between an elastic and a plastic phase. It repre-sents wood behavior as elastic-perfectly plastic and unable to include the softening behavior preceding the plateau in com-pression along the fiber direction (seeFigure 6). Their com-parative study leads to an improved and more representative wood material model able to represent softening behavior in FE models. For plywood structures, fiber fracture, debond-ing, crushing and transverse shear are identified as primary failure modes under low-velocity/low-energy impact [6]. In order to represent the above failure modes, each ply of the plywood core is modeled with the wood material model (MAT_143) in LS-DYNA. In this model, transverse isotropic behavior is considered with a modified Hashin failure criter-ion. In this criterion, compressive and shear stresses are assumed to be mutually weakening, so a compressive parallel and perpendicular criterion similar to that for tensile loading can be assumed. Damage evolution is computed through parallel and perpendicular mode fracture energy parameters, which are obtained from stress intensity factors in modes I and II in the parallel and perpendicular directions [32].
Parallel tensile and compressive failure mode: F¼r 2 11 X2 þ r2 12þ r213 ! " S2k ' 1 X ¼ XT ðr11>0Þ XC ðr11<0Þ ; F¼ F1 ðTensileÞ F2 ðCompressiveÞ ( ( (1)
Perpendicular tensile and compressive failure mode: F¼ðr22þ r33Þ 2 Y2 þ r2 23*r22r33 ! " S2? þ r2 12þ r213 ! " S2k ' 1 where Y¼ YT ððr22þ r33Þ>0Þ YC ððr22þ r33Þ<0Þ ; ( F¼ F3 ðTensileÞ F4 ðCompressiveÞ ( (2)
with XT ; YT * Longitudinal and transverse tensile
strength respectively
XC; YC * Longitudinal and transverse compressive
strength respectively
Sk; S?* Longitudinal and transverse shear strength
respectively
F1, F2, F3, F4- Failure index
Parallel damage evolution: Damage function d s! ð Þk "¼ dmaxk B 1þ B 1þ Be*A sðk*s0kÞ*1 " # (3) where Damage parameter Að Þ ¼ s0kL 1þ B BGfk " # log 1ð þ BÞ (4)
Strain energy threshold sð Þk
¼ ffiffiffiffiffiffiffiffiffiffiffiffiffiffiffiffiffiffiffiffiffiffiffiffiffiffiffiffiffiffiffiffiffiffiffiffiffiffiffiffiffiffiffiffiffiffiffiffiffiffiffiffi r11, e11þ 2 rð ,12e12þ r,13e13Þ p e11' 0 ffiffiffiffiffiffiffiffiffiffiffiffiffiffiffiffiffiffiffiffiffiffiffiffiffiffiffiffiffiffiffiffiffiffiffi 2 r, 12e12þ r,13e13 ð Þ p e11<0 ( (5)
Initial strain energy threshold sð Þ0k
¼ sk* ffiffiffiffiffiffiffi E11 p x*x0 L ( ) (6)
Parallel fracture energy G! f k"
¼ GfIk r2 11 X2 T ! þ GfIIk r2 12þ r213 S2 k ! r11' 0 GfIIk S2k r2 12þ r213 ! r11<0 8 > > > > > < > > > > > : (7)
Parallel fracture energy in mode I GfIk
! "
¼ CIK2Ik (8)
Parallel fracture energy in mode II GfIIk
! "¼ C
IK2IIk (9)
with Mode I – Stress intensity factor in parallel direc-tion (KIkÞ . 7KI?
Mode II – Stress intensity factor in parallel direc-tion (KIIkÞ . 7KII?
B and dmaxII– User defined parallel softening parameter
and parallel maximum damage respectively
X and X0 - Initial displacement and displacement at peak
strength respectively. L – Element length
Perpendicular damage evolution: Damage function d s! ð Þ? " ¼dmaxD ? 1þ D 1þ De*C sð?*s0?Þ*1 ( ) (10) where Damage parameter ðCÞ¼ s0?L 1þ D DGf? ( ) log 1ð þ DÞ (11)
Strain energy threshold sð Þ?
¼ ffiffiffiffiffiffiffiffiffiffiffiffiffiffiffiffiffiffiffiffiffiffiffiffiffiffiffiffiffiffiffiffiffiffiffiffiffiffiffiffiffiffiffiffiffiffiffiffiffi r,22e22þ r,33e33þ 2r,23e23 p e22þ e33' 0 ffiffiffiffiffiffiffiffiffiffiffiffiffiffi 2r, 23e23 p e22þ e33<0 ( (12)
Initial strain energy threshold sð 0?Þ ¼ s?*
ffiffiffiffiffiffiffi E22 p x*x0 L ( ) (13) Perpendicular fracture energy Gð f?Þ
¼ GfI? r2 22þr233 Y2 T ! þGfII? r2 23*r22r33 S2 ? ! r22þr33'0 GfII? S2? r2 23*r22r33 ! r22þr33<0 (14) 8 > > > > > < > > > > > :
Perpendicular fracture energy in mode I Gð fI?Þ¼ CIK
2 I?
(15) Perpendicular fracture energy in mode II Gð fII?Þ¼ CIK
2 II? (16) CI¼ ffiffiffiffiffiffiffiffiffiffiffiffiffiffiffiffiffiffiffiffiffiffiffiffiffiffiffiffiffiffiffiffiffiffiffiffiffiffiffiffiffiffiffiffiffiffiffiffiffiffiffiffiffiffiffiffiffiffiffiffiffiffiffiffiffiffiffiffiffiffiffi C11C22 2 0 1 C22 C11 0 1 þ 2C12þC66 2C11 0 1 ( ) s (17) CII¼ C11 ffiffiffi 2 p 0 1 ffiffiffiffiffiffiffiffiffiffiffiffiffiffiffiffiffiffiffiffiffiffiffiffiffiffiffiffiffiffiffiffiffiffiffiffiffiffiffiffiffiffiffiffiffiffiffiffiffiffiffiC 22 C11 0 1 þ 2C12þC66 2C11 0 1 ( ) s (18) C11¼ 1 E11 ; C22¼ 1 E22 ; C12¼*$11 E22 ; C66¼ 1 G12 (19) with KI?¼ Mode I – Stress intensity in perpendicular mode
KII?¼ Mode II ‒ Stress intensity in perpendicular mode
D and dmaxII ‒ User defined perpendicular softening parameter and perpendicular maximum damage respectively.
L ‒ Element length
X and X0 ‒ Initial displacement and displacement at peak strength respectively.
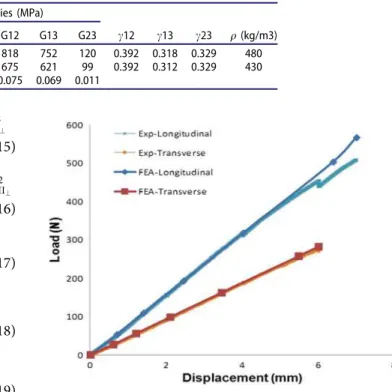
3.2.2. Calibration of plywood core elastic behavior
The identification procedure was carried out with material constants from the literature [36] as shown in Table 11. Then each elastic constant was calculated from E11
accord-ing to a fixed ratio [36].
A numerical model for three point bending on a plywood structure without damage was used to calibrate the elastic behavior. For plywood core A, each ply of the core was meshed with 1,100 solid brick elements. ABAQUS (Implicit) was used for the simulation. As the sandwich plate geom-etry, boundary conditions and loading were symmetrical, only 1/4 of the specimen was computed. The final load was corrected by considering 4 times the calculated result.Figure 7 shows the quarter symmetric model considered. The top roller and bottom roller support were modeled with 900 and 1,800 solid elements respectively. A vertical displacement was applied to the top roller while the bottom one was clamped.
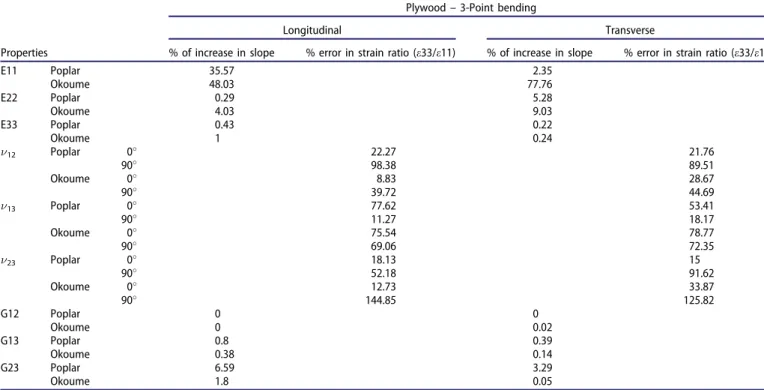
Then, a comparison was made with the results of three point bending experiments performed by the authors in [2]. A sensitivity study was performed to build an identification strategy. The sensitivity of each measurable quantity of each elastic constant was evaluated by considering a 10% increase. Table 12 presents results concerning the slope of the load/ displacement curve for three and four point bending tests in the longitudinal and transverse directions and the ratio of
normal to longitudinal strain, which was obtained through digital image correlation used in three point bending tests on a lateral face of the sample near the plane of symmetry.
Finally, the longitudinal modulus of Okoume (E11) had a
significant influence on the predicted stiffness because of its top position which situated it farther from the neutral plane of the plywood structure. The Poisson ratio of Okoume ($23) was more sensitive to the predicted ratio of normal
strain to longitudinal strain at the middle of the numerical model (see Table 12). The material properties identified are shown in Table 15, keeping the same ratios to E11 as
pre-sented in Table 11. The corresponding load/displacement numerical responses are compared to experimental results for longitudinal and transverse samples inFigure 7.
3.2.3. Calibration of plywood core plastic behavior and aluminum skin elasto-plastic behavior
For plywood structures with aluminum skin, debonding, transverse shear and fiber fracture were identified as the predominant failure modes under low-velocity impact [6]. In order to simulate and represent the above failure modes along with non-linear behavior of the skin, the aluminum skin of the sandwich structure was modeled with material model MAT_98 (Simplified Johnson Cook) of the LS-DYNA software, without including thermal effects on the behavior. Johnson Cook expresses the flow stress through the follow-ing equation. Failure occurs when the effective plastic strain exceeds PSFAILð"ePÞ.
ry¼ A þ B"eð PnÞ
1þ C ln _"e e0
0 1
(20) where A and B are input constants, C is strain rate sensitiv-ity, n is the strain hardening factor, "eP is the maximum
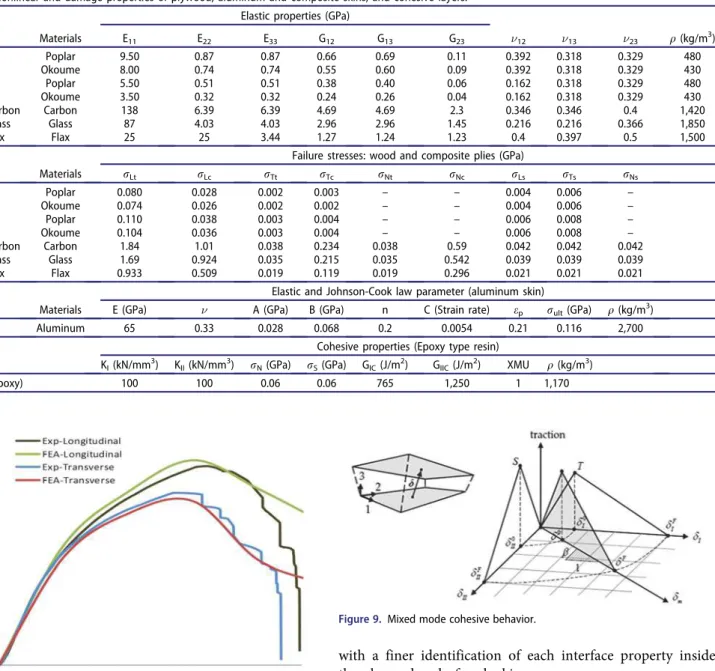
Table 11. Initial elastic properties of poplar and okoume [36].
Material Properties
Elastic properties (MPa)
c12 c13 c23 q(kg/m3) E11 E22 E33 G12 G13 G23
Poplar 10,900 1,003 469 818 752 120 0.392 0.318 0.329 480 Okoume 9,000 828 387 675 621 99 0.392 0.312 0.329 430 Ratios to E11 0.092 0.043 0.075 0.069 0.011
effective plastic strain, _"e is the maximum effective plastic strain rate, and e0 is the reference strain rate.
The law was calibrated in the same way as for plywood alone, using the results in bending obtained for plywood with aluminum skins [2] and an explicit finite element model including damage to calibrate elastic and plastic behavior of the skins. The same geometry as Figure 7, with a quarter of the symmetric model, was considered. Here, each aluminum skin was modeled with two layers of solid elements through the thickness while continuum shell ele-ments were used for the plywood core. We used the cali-brated elastic properties obtained from the previous model for the plywood core and initiated the identification process with damage property data from the literature for both the plywood core [32, 36 and39] and the skins [28] (seeTables 13 and 14). Then we identified plastic and damage proper-ties for both the plywood core and aluminum skins after a sensitivity study on the three point bending test. The final elastic damage properties are shown inTable 15.
Figure 8 compares the numerical model (with improved materials data (see Table 15)) and experimental load/dis-placement responses for longitudinal and transverse samples
of plywood structures with aluminum skin. Good correlation can be seen in terms of initial slope, stiffness loss and max-imum load for both longitudinal and transverse samples. On the other hand, failure of the sample is not captured by the model.
3.2.4. Cohesive layer behavior
For cohesive layers, cohesive mixed mode MAT_138 was used in order to simulate delamination and debonding between skins and core. Mixed mode cohesive behavior is now commonly used for modeling delamination as in [14, 15]. The law is shown Figure 9, using the following equations. dF¼2 1þ b 2 ! " d0 EN GIC 0 1XMU þ ET! b 2 GIIC 0 1XMU " #*XMU1 (21) d0¼ d0Id 0 II ffiffiffiffiffiffiffiffiffiffiffiffiffiffiffiffiffiffiffiffiffiffiffiffiffiffiffiffiffiffiffiffiffiffiffiffiffiffiffi 1þ b2 d0II ! "2 þ bd0II ! "2 ! v u u t (22)
Table 12. Sensitivity analysis on material parameters of plywood layers.
Plywood – 3-Point bending
Longitudinal Transverse
Properties % of increase in slope % error in strain ratio (e33/e11) % of increase in slope % error in strain ratio (e33/e11)
E11 Poplar 35.57 2.35 Okoume 48.03 77.76 E22 Poplar 0.29 5.28 Okoume 4.03 9.03 E33 Poplar 0.43 0.22 Okoume 1 0.24 $12 Poplar 0# 22.27 21.76 90# 98.38 89.51 Okoume 0# 8.83 28.67 90# 39.72 44.69 $13 Poplar 0# 77.62 53.41 90# 11.27 18.17 Okoume 0# 75.54 78.77 90# 69.06 72.35 $23 Poplar 0# 18.13 15 90# 52.18 91.62 Okoume 0# 12.73 33.87 90# 144.85 125.82 G12 Poplar 0 0 Okoume 0 0.02 G13 Poplar 0.8 0.39 Okoume 0.38 0.14 G23 Poplar 6.59 3.29 Okoume 1.8 0.05
Table 13. Initial damage properties (Plywood A).
Materials
Failure stresses (MPa) – (Hashin damage) Fracture energy (N/mm)
rlt rlc rtt rtc rls rts
Perpendicular Parallel
GLR(I)–Tension GLR (II)- Shear GLT(I)- Tension GLT (II)- Shear
Poplar 109.6 38.2 3.4 3.7 6.2 8.2 0.40 8.3 20.1 41.4 Okoume 103.6 36.1 3.2 3.5 5.8 7.8 0.34 6.9 16.7 34.9
Table 14. Initial plastic damage properties for aluminum [40].
E (GPa) $ A (GPa) B (GPa) n (hardening parameter) C (Strain rate-constant) ep(Maximum plastic strain) rult(GPa)
where d0I ¼ T EN;d 0 II¼ TS ET; b¼ dII dI
with T and S the Peak tractions in the normal and tangen-tial directions respectively, EN and ET the unit stiffness in the normal and tangential directions, respectively, and GIC
and GIIC the critical energy release rates in mode I and
mode II respectively.
XMU – the exponent of mixed mode criteria – was set to 1 in accordance with [14, 15]
dFis the ultimate mixed-mode displacement.
The cohesive behavior presented in Table 15, in which values are taken from [40], will be used for interfaces inside composite skins or between skins and plywood encountered in this work. Of course, better accuracy would be obtained
with a finer identification of each interface property inside the plywood and of each skin.
3.2.5. Composite skin damage behavior
For plywood structures with composite skins, delamination, transverse shear of the core, fiber fracture, debonding and matrix cracking were identified as predominant failure modes under low-velocity/low-energy impact. Several material models are available in LS-DYNA to model continuous fiber composite laminate. Each material model utilizes a different model strat-egy to predict failure initiation, and for material properties and degradation schemes. The material model used in this study is an orthotropic material model that takes the maximum stress failure criterion for tension failure, compressive failure, shear failure and delamination. This material model has been used to simulate impact and crash response of thick composite struc-tures with solid elements. Each failure mode is classified according to the fiber direction. (Here, the subscripts 1, 2, and 3 denote the longitudinal, transverse, and normal directions). The failure criterion of this material model is given as follows:
Table 15. Nonlinear and damage properties of plywood, aluminum and composite skins, and cohesive layers.
Panels Materials
Elastic properties (GPa)
$12 $13 $23 q(kg/m3) E11 E22 E33 G12 G13 G23 Ply - A Poplar 9.50 0.87 0.87 0.66 0.69 0.11 0.392 0.318 0.329 480 Okoume 8.00 0.74 0.74 0.55 0.60 0.09 0.392 0.318 0.329 430 Ply - B Poplar 5.50 0.51 0.51 0.38 0.40 0.06 0.162 0.318 0.329 480 Okoume 3.50 0.32 0.32 0.24 0.26 0.04 0.162 0.318 0.329 430 Ply - A / Carbon Carbon 138 6.39 6.39 4.69 4.69 2.3 0.346 0.346 0.4 1,420 Ply - A / Glass Glass 87 4.03 4.03 2.96 2.96 1.45 0.216 0.216 0.366 1,850 Ply - B / Flax Flax 25 25 3.44 1.27 1.24 1.23 0.4 0.397 0.5 1,500
Failure stresses: wood and composite plies (GPa)
Panels Materials rLt rLc rTt rTc rNt rNc rLs rTs rNs
Ply -A Poplar 0.080 0.028 0.002 0.003 – – 0.004 0.006 – Okoume 0.074 0.026 0.002 0.002 – – 0.004 0.006 – Ply -B Poplar 0.110 0.038 0.003 0.004 – – 0.006 0.008 – Okoume 0.104 0.036 0.003 0.004 – – 0.006 0.008 – Ply - A / Carbon Carbon 1.84 1.01 0.038 0.234 0.038 0.59 0.042 0.042 0.042 Ply - A / Glass Glass 1.69 0.924 0.035 0.215 0.035 0.542 0.039 0.039 0.039 Ply - B / Flax Flax 0.933 0.509 0.019 0.119 0.019 0.296 0.021 0.021 0.021
Elastic and Johnson-Cook law parameter (aluminum skin)
Panels Materials E (GPa) $ A (GPa) B (GPa) n C (Strain rate) ep rult(GPa) q(kg/m3)
Ply - A / Al Aluminum 65 0.33 0.028 0.068 0.2 0.0054 0.21 0.116 2,700 Cohesive properties (Epoxy type resin)
Materials KI(kN/mm3) KII(kN/mm3) rN(GPa) rS(GPa) GIC(J/m2) GIIC(J/m2) XMU q(kg/m3)
Cohesive (Epoxy) 100 100 0.06 0.06 765 1,250 1 1,170
Figure 8. Force–displacement curve (plywood A/aluminum skins) - 3 point bending.
Longitudinal and transverse tensile mode: F¼ r X 0 12 þ r12 S12 0 12 þ s S 0 12 ' 1 (23) where X¼ XT ;r¼ r11;s¼ r13; S¼ S13; F¼ F1 ðr11>0Þ ðLÞ X¼ YT ;r¼ r22;s¼ r23; S¼ S23; F¼ F2 ðr22>0Þ ðTÞ 6
Through thickness shear mode (longitudinal and trans-verse): F¼ r X 0 12 þ s S 0 12 ' 1 X¼ XT;r¼ r11;s¼ r13; S¼ S13; F¼ F3 ð ÞL X¼ YT;r¼ r22;s¼ r23; S¼ S23; F¼ F4 ð Þ (24)T (
Delamination mode (through thickness tensile): F5¼ r33 ZT 0 12 þ r23 S23 0 12 þ r13 S13 0 12 ' 1 rð 33>0Þ (25)
Longitudinal compression mode: F6¼
r11
XC
0 12
' 1 rð 11<0Þ (26)
Transverse compression mode: F7¼ r22 S12þ S23 0 12 þ YC S12þ S23 0 12 * 1 " # r22 jYCj 0 1 þ r12 S12 0 12 þ r23 S23 0 12 ' 1 rð 22<0Þ (27)
Through thickness compression mode: F8¼ r33 S13þ S23 0 12 þ ZC S13þ S23 0 12 * 1 " # r33 jZCj 0 1 þ r13 S13 0 12 þ r23 S23 0 12 ' 1 rð 33<0Þ (28)
We used the calibrated elastic properties obtained from the previous model for the plywood core and initiated the identification process of elastic and damage properties data fromthe literature [40] for the composite skins. Unlike ply-wood A, where elastic constants were identified on the 3 point bending test, plywood B and the composite skin had data constants directly identified from the impact test (ini-tiating the identification from plywood A properties). The calibrated data constants for different composite skins are summarized inTable 15.
4. Comparisons with experimental results
4.1. Case of impacts on plywood a and B alone
The experimental and numerical contact laws for the ply-wood structures alone, impacted under 5 J and 10 J, are shown in Figure 10a and b. At 15 J, correlation is not pos-sible due to perforation. Globally, the numerical prediction is rather good for both plywoods and for 5 J impact, which means that the elastic values were correctly estimated and the damage extension was small. The results are consider-ably less accurate for 10 J in terms of peak load, energy absorbed, final failure and unloading prediction (see also Table 16). So, further investigations are needed to character-ize plywood and plywood component damage parameters and thus enhance the model description.
A comparison ply by ply can also be proposed and the case of 10 J impact for plywood A is shown in Figure 11. Since the error in residual indentation depth in this case is only 16% (Table 16), the proposed numerical model can correctly predict the position of maximum plastic deform-ation, as well as permanent indentdeform-ation, in the specimens. This also shows that the rough hypothesis made in this study can be accurate enough to model the out-of-plane behavior of the plywood alone.
4.2. Case of impacts on plywood a core and aluminum skin
In the cases of sandwich structures using plywood A core and aluminum skin, a simulation was performed of the impact tests for the three energy levels. The correlation between experimental and numerical results was satisfactory,
as shown in Figure 12, where experimental and numerical curves are very similar. This is probably due to the plastic behavior of the skins, which is simple to model. The inden-tation depth and the crushing of each ply are correctly esti-mated, as is the absorbed energy, with an error of between 5 and 15% (Table 16andFigure 13).
4.3. Case of impacts on plywood a and B core and carbon skin
Regarding the sandwich structures with plywood A and B cores and carbon skins, good correlation was obtained in terms of the peak load, initial slope and unloading portion under 5 J and 10 J impact energy (seeFigures 14 and15and Table 16). In particular, the results for maximum deflection and failure by plywood crushing under the skin predicted by numerical simulation were practically the same as those measured in the tests (seeFigure 16). However, the perman-ent indperman-entation was difficult to capture due to the elastic behavior of the skin after impact. However, at this stage of development, the model is able to capture the complex behavior involved [3]. Concerning the simulation of the impact tests at 15 J, good correlation was obtained in the
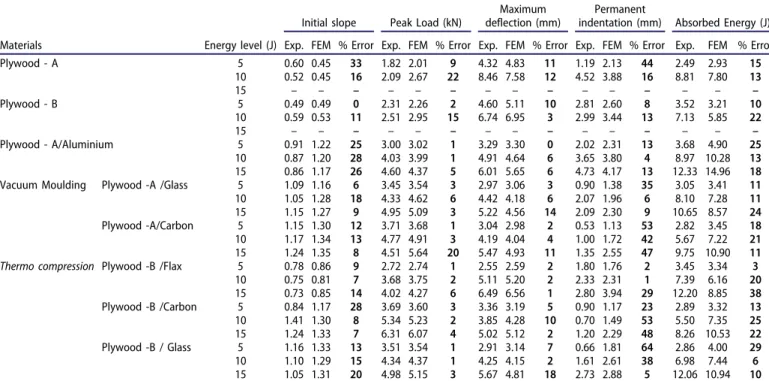
Table 16. Comparison of predicted impact parameters for different wooden sandwich structures (gray cells: Perforation).
Materials Energy level (J)
Initial slope Peak Load (kN)
Maximum deflection (mm)
Permanent
indentation (mm) Absorbed Energy (J) Exp. FEM % Error Exp. FEM % Error Exp. FEM % Error Exp. FEM % Error Exp. FEM % Error Plywood - A 5 0.60 0.45 33 1.82 2.01 9 4.32 4.83 11 1.19 2.13 44 2.49 2.93 15 10 0.52 0.45 16 2.09 2.67 22 8.46 7.58 12 4.52 3.88 16 8.81 7.80 13 15 – – – – – – – – – – – – – – – Plywood - B 5 0.49 0.49 0 2.31 2.26 2 4.60 5.11 10 2.81 2.60 8 3.52 3.21 10 10 0.59 0.53 11 2.51 2.95 15 6.74 6.95 3 2.99 3.44 13 7.13 5.85 22 15 – – – – – – – – – – – – – – – Plywood - A/Aluminium 5 0.91 1.22 25 3.00 3.02 1 3.29 3.30 0 2.02 2.31 13 3.68 4.90 25 10 0.87 1.20 28 4.03 3.99 1 4.91 4.64 6 3.65 3.80 4 8.97 10.28 13 15 0.86 1.17 26 4.60 4.37 5 6.01 5.65 6 4.73 4.17 13 12.33 14.96 18 Vacuum Moulding Plywood -A /Glass 5 1.09 1.16 6 3.45 3.54 3 2.97 3.06 3 0.90 1.38 35 3.05 3.41 11 10 1.05 1.28 18 4.33 4.62 6 4.42 4.18 6 2.07 1.96 6 8.10 7.28 11 15 1.15 1.27 9 4.95 5.09 3 5.22 4.56 14 2.09 2.30 9 10.65 8.57 24 Plywood -A/Carbon 5 1.15 1.30 12 3.71 3.68 1 3.04 2.98 2 0.53 1.13 53 2.82 3.45 18 10 1.17 1.34 13 4.77 4.91 3 4.19 4.04 4 1.00 1.72 42 5.67 7.22 21 15 1.24 1.35 8 4.51 5.64 20 5.47 4.93 11 1.35 2.55 47 9.75 10.90 11 Thermo compression Plywood -B /Flax 5 0.78 0.86 9 2.72 2.74 1 2.55 2.59 2 1.80 1.76 2 3.45 3.34 3
10 0.75 0.81 7 3.68 3.75 2 5.11 5.20 2 2.33 2.31 1 7.39 6.16 20 15 0.73 0.85 14 4.02 4.27 6 6.49 6.56 1 2.80 3.94 29 12.20 8.85 38 Plywood -B /Carbon 5 0.84 1.17 28 3.69 3.60 3 3.36 3.19 5 0.90 1.17 23 2.89 3.32 13 10 1.41 1.30 8 5.34 5.23 2 3.85 4.28 10 0.70 1.49 53 5.50 7.35 25 15 1.24 1.33 7 6.31 6.07 4 5.02 5.12 2 1.20 2.29 48 8.26 10.53 22 Plywood -B / Glass 5 1.16 1.33 13 3.51 3.54 1 2.91 3.14 7 0.66 1.81 64 2.86 4.00 29 10 1.10 1.29 15 4.34 4.37 1 4.25 4.15 2 1.61 2.61 38 6.98 7.44 6 15 1.05 1.31 20 4.98 5.15 3 5.67 4.81 18 2.73 2.88 5 12.06 10.94 10
Figure 11. Comparison of crushing for plywood –A at 10 J (a) experimental, (b) numerical.
Figure 12. Force–displacement plot at 5 J, 10 J and 15 J (plywood A/alumi-num skin).
initial slope and indentation but not in peak load, maximum deflection and unloading portion. With experimental results, we encounter delamination and a spring back effect of the skin with almost no visible indentation at 15 J while marked indentation and delamination is visible at the interface between the core and the top skin (Figure 16). These differ-ences can be explained by poor adhesion between skins and core being obtained in the manufacturing process. The fail-ure of the numerical model to represent this spring back and marked delamination was probably due to a difference between the interface properties and the cohesive behavior used in the simulation. Here, more thorough investigation should be conducted during the manufacturing process to improve the adhesion of the skins or identification of the
cohesive behavior should be compulsory in the numerical model. When the sandwich core was plywood B, excellent correlation between experimental and numerical tests was obtained in terms of initial slope, peak load and maximum deflection at all impact energy levels (see Figure 15 and Table 16) which may be explained by better adhesion being obtained in the thermo-compression process in the case of plywood B/carbon skin and the absence of local delamin-ation under the impactor.
4.4. Case of impacts on plywood a and B cores and glass skins
For the sandwich structures with plywood cores (A or B) and glass skins, impact tests at energy levels of 5 J and of 10 J showed good correlation in terms of peak load, initial
Figure 13.Comparison of plastic deformation and indentation for (plywood a/ aluminum skin) (a) experimental, (b) numerical.
Figure 14. Force-displacement plot at 5 J, 10 J and 15 J (plywood – A/car-bon skins).
Figure 15. Force-displacement plot at 5 J, 10 J and 15 J (plywood – B/car-bon skins).
Figure 16. Comparison of plastic deformation and indentation for (plywood – A/carbon skins) (a) experimental, (b) numerical.
slope, maximum deflection and indentation (see Figures 17, 18 andTable 16). Maximum plastic deformation was located at one-third of the sample thickness (see Figure 19a and b). The conclusion is the same for both numerical and experi-mental cases. In the cases of impact energies of 10 J and of 15 J, the prediction by the numerical model, in terms of fail-ure modes, position of the maximum plastic deformation, initial slope and peak load were confirmed by experimental measurement, but moderate correlation was obtained in terms of unloading and absorbed energy, which may have been due to the better adhesion obtained in thermo-com-pression process. However, regarding permanent indenta-tion, poor correlation was obtained between numerical and experimental results. These remarks may describe a mis-match between interface properties and the cohesive behav-ior used in the simulation. As explained above, the cohesive behavior of the interfaces needs further calibration.
4.5. Case of impacts on plywood B core and flax skins
For the sandwich structures with plywood core B and flax skin, maximum plastic deformation occurred up to the mid-dle section of samples in both numerical and experimental test cases (see Figure 20 and Table 16). Moreover, similar failure modes, such as fiber fracture, were found at higher
energy levels in experimental tests and in numerical simula-tion (Figure 20). Good correlation was obtained for the peak load, initial slope, the position of the maximum plastic deformation in the tested specimen, maximum deflection, and indentation at all impact energy levels (Figure 21 and Table 16). However, weak correlation was obtained in terms of the unloading portion at 10 J and 15 J, which may be explained by insufficient progressive material damage mod-eling in LS-DYNA and incomplete realization of bouncing in simply supported boundary conditions in the numer-ical model.
Figure 17. Force–displacement plot at 5 J, 10 J and 15 J (plywood A/ glass skins).
Figure 18. Force–displacement plot at 5 J, 1 0 J and 15 J (plywood B/ glass skins).
Figure 19. Comparison of plastic deformation and indentation for (plywood A/ glass skins) (a) experimental, (b) numerical.
Figure 20. Force–displacement plot at 5 J, 10 J and 15 J (plywood – B/ flax skins).
5. Conclusions
A numerical model of sandwich structures with plywood cores has been developed to model low velocity, low energy impacts on these structures. Nine configurations were studied at 3 levels of energy. The model uses available material laws for plywood, composite and metallic skins. Due to the large number of materials contained in the ply-wood and in the skins, and the number of damage parame-ters involved, only a rough estimation of the material properties was made. Despite this drawback, the model can predict the impact behaviors correctly, especially for 5 J and 10 J impacts, where damage is limited. Most of the errors in the experimental and numerical results in terms of initial slope, peak load and maximum deflections are lower than 20%. The error in terms of permanent indentation is larger due to the complex behavior involved [41], which is not taken into account correctly in the model. The difference is also more significant in terms of absorbed energy. Material damage model in LS-DYNA does not integrate enough soft-ening effects in the damage process, and some improve-ments will have to be proposed in order to obtain better correlation. In addition, exhaustive nonlinear characteriza-tion and the use of more advanced modeling strategies [14–19] would be relevant. The numerical strategy proposed in this paper is a first approach to highlight the difficulties of impact modeling of these materials with a classical approach available in commercial software.
References
[1] D. Zenkerts, The Handbook of Sandwich Construction. West Midlands: Engineering Materials Advisory Services Ltd, 1997. [2] J. Susainathan, F. Eyma, E. De Luycker, A. Cantarel, and B.
Castani!e, “Manufacturing and quasi-static bending behavior of
wood-based sandwich structures,” Compos. Struct., vol. 182, pp. 487–504, 2017.
[3] S. Abrate, B. Castani!e, and Y. D. S. Rajapakse, Dynamic Failure of Composite and Sandwich Structures. Berlin: Springer 2013. [4] J. Tomblin, T. Lacy, B. Smith, S. Hooper, A. Vizzini, and S.
Lee, “Review of damage tolerance for composite sandwich air-frame structures” FAA Report Number DOT/FAA/AR-99/49. [5] B. Castani!e, Y. Aminanda, C. Bouvet, and J. J. Barrau, “Core
crush criteria to determine the strength of sandwich composite structures subjected to compression after impact,” Compos. Struct., vol. 86, no. 1–3, pp. 243–250, 2008.
[6] J. Susainathan, F. Eyma, E. De Luycker, A. Cantarel, and B. Castani!e, “Experimental investigation of impact behavior of wood-based sandwich structures,” Compos. Part A, vol. 109, pp. 10–19, 2018.
[7] Y. Aminanda, B. Castanie, J. J. Barrau, and P. Thevenet, “Experimental analysis and modeling of the crushing of honey-comb cores,” Appl. Compos. Mater., vol. 12, no. 3–4, pp. 213–217, 2005.
[8] B. Castani!e, C. Bouvet, Y. Aminanda, J. J. Barrau, and P. Thevenet, “Modelling of low energy/low velocity impact on nomex honeycomb sandwich structures with metallic skins,” Int. J. Impact Eng., vol. 35, no. 7, pp. 620–634, 2008.
[9] J. De Lorna, M. Gibson, and F. Ashby, Cellular Solids: Structures and Properties. Cambridge, MA: Cambridge University Press.
[10] S. Long, X. Yao, H. Wang, and X. Zhang, “Failure analysis and modeling of foam sandwich laminates under impact loading,” Compos. Struct., vol. 197, pp. 10–20, 2018.
[11] R. Olsson, and T. B. Block, “Criteria for skin rupture and core shear cracking induced by impact on sandwich panels,” Compos. Struct., vol. 125, pp. 81–87, 2015.
[12] S. Abrate, “Criteria for yielding or failure of cellular materials,” J. Sandwich Struct. Mater., vol. 10, no. 1, pp. 5–51, 2008. [13] J. Aubry et al., “Change of scale strategy for the microstructural
modelling of polymeric rohacell foams,” Comput. Mater. Continua, vol. 39, pp. 21–47, 2014.
[14] C. Bouvet, B. Castani!e, M. Bizeul, and J. J. Barrau, “Low vel-ocity impact modelling in laminate composite panels with dis-crete interface elements,” Int. J. Solids Struct., vol. 46, no. 14–15, pp. 2809–2821, 2009.
[15] V. Achard, C. Bouvet, B. Castani!e, and C. Chirol, “Discrete ply modelling of open hole tensile tests,” Compos. Struct., vol. 113, pp. 369–381, 2014.
[16] F. Pascal, O. Dorival, P. Navarro, S. Marguet, and J. F. Ferrero, “Impact damage prediction in thin woven composite lamina-tes–part I: modeling strategy and validation,” Compos. Struct., vol. 190, pp. 32–42, 2018.
[17] B. Y. Chen, S. T. Pinho, N. V. De Carvalho, P. M. Baiz, and T. E. Tay, “A floating node method for the modelling of dis-continuities in composites,” Eng. Fracture Mech., vol. 127, pp. 104–134, 2014.
[18] X. Lu, B. Y. Chen, V. B. C. Tan, and T. E. Tay, “A separable cohesive element for modelling coupled failure in laminated composite materials,” Compos. Part A, vol. 107, pp. 387–398, 2018.
[19] M. Naderi, J. Jung, and Q. Yang, “A three dimensional aug-mented finite element for modeling arbitrary cracking in sol-ids,” Int. J. Fracture, vol. 197, no. 2, pp. 147–168, 2016. [20] D. W. Sleight, Progressive Failure Analysis Methodology for
Laminated Composite Structures, and NASA/TP-1999-209107. Hampton, VA: Nasa LRC, 1999.
[21] N. Murugesan, and V. Rajamohan, “Prediction of progressive ply failure of laminated composite structures: a review,” Arch. Comput. Methods Eng., vol. 24, no. 4, pp. 841–853, 2017. [22] C.-S. Lee, J.-H. Kim, S.-K. Kim, D.-M. Ryu, and J.-M. Lee,
“Initial and progressive failure analyses for composite laminates using puck failure criterion and damage-coupled finite element method,” Compos. Struct., vol. 121, pp. 406–441, 2015.
Figure 21. Comparison of plastic deformation and indentation for plywood – A/glass skins (a) experimental, (b) numerical.
[23] D. C. Pham, X. S. Sun, V. B. C. Tan, B. Chen, and T. E. Tay, “Progressive failure analysis of scaled double-notched carbon/ epoxy composite laminates,” Int. J. Damage Mech., vol. 21, no. 8, pp. 1154–1185, 2012.
[24] D. Du, Y. Hu, H. Li, C. Liu, and J. Tao, “Open-hole tensile pro-gressive damage and failure prediction of carbon fibre-rein-forced PEEK-titanium laminates,” Compos. Part B, vol. 91, pp. 65–74, 2016.
[25] C. Adalian, and P. Morlier, “A model for the behavior of wood under multiaxial compression,” Compos. Sci. Technol., vol. 20, pp. 404–408, 2001.
[26] T. Polocos,e, B. Kasal, and F. St€ockel, “State-of-the-art:
inter-mediate and high strain rate testing of solid wood,” Wood Sci. Technol., vol. 51, no. 6, pp. 1479–1534, 2017.
[27] F. Chen et al., “Impact properties of bamboo bundle laminated veneer lumber by preprocessing densification technology,” J Wood Sci., vol. 60, no. 6, pp. 421–427, 2014.
[28] H. Wang, K. R. Ramakrishnan, and K. Shankar, “Experimental study of the medium velocity impact response of sandwich pan-els with different cores,” Mater. Design, vol. 99, pp. 68–82, 2016.
[29] N. Jover, B. Shafiq, and U. Vaidya, “Ballistic impact analysis of balsa core sandwich composites,” Compos. Part B, vol. 67, pp. 160–169, 2014.
[30] B. Toson, P. Viot, and J. J. Pesqu!e, “Finite element modeling of balsa wood structures under severe loadings,” Eng. Struct., vol. 70, pp. 36–52, 2014.
[31] M. Vural, and G. Ravichandran, “Dynamic response and energy dissipation characteristics of balsa wood: experiment and analy-sis,” Int. J. Solids Struct., vol. 40, no. 9, pp. 2147–2170, 2003.
[32] Y. Murray, Manual for LS-DYNA wood material. Model 143, Report no. FHWA-HRT-04-097; US departement of transporta-tion, McLean, VA 22101-2296, USA, 2007.
[33] J. P. Susainathan, “Development and characterization of wood based eco-structure,” PhD University of Toulouse, 2017. [34] L. Mezeix, S. Dols, C. Bouvet, B. Castani!e, J. P. Giavarini, and
N. Hongkarnjanakul, “Experimental analysis of impact and post-impact behaviour of inserts in carbon sandwich structures,” J. Sandwich Struct. Mater., 2017. http://dx.doi.org/ 10.1177/1099636216687582.
[35] L. Deka, and U. Vaidya, “LS-DYNAVR impact simulation of
composite sandwich structures with balsa wood core,” 10th International LS-DYNA Users Conference, Detroit, 2008. [36] Forest Products Laborartory, Wood handbook—Wood as an
engineering material. Madison, WI: Forest Products Lab. 2010. [37] A. Da Silva, and S. Kyriakides, “A compressive response and
failure of balsa wood,” Int. J. Solids Struct., vol. 44, no. 25–26, pp. 8685–8717, 2007.
[38] T. Maillot, V. Lapoujade, E. Grippon, B. Toson, N. Bardon, and J. J. Pesque, “Comparative study of material laws available in LS-DYNAVR to improve the modeling of balsa wood,” 13th
International LS-DYNA Users Conference, Michigan, 2014. [39] A. M. Otkur, “Impact modeling and failure modes of composite
plywood,” Master thesis, Texas Tech University, 2010. http:// hdl.handle.net/2346/ETD-TTU-2010-12-1099.
[40] M. Ilyas, “Damage modeling of carbon epoxy laminated compo-sites submitted to impact loading,” Doctoral thesis, Universit!e de Toulouse, France.
[41] C. Bouvet, S. Rivallant, and J. J. Barrau, “Low velocity impact modeling in composite laminates capturing permanent inden-tation,” Compos. Sci. Technol., vol. 72, no. 16, pp. 1977–1988, 2012.
![Figure 6. Uni-axial compressive numerical model [7]. Three point bending numerical model.](https://thumb-eu.123doks.com/thumbv2/123doknet/12582144.346886/8.892.210.656.389.917/figure-axial-compressive-numerical-model-point-bending-numerical.webp)