HAL Id: hal-01539826
https://hal.archives-ouvertes.fr/hal-01539826
Submitted on 15 Jun 2017
HAL is a multi-disciplinary open access
archive for the deposit and dissemination of
sci-entific research documents, whether they are
pub-lished or not. The documents may come from
teaching and research institutions in France or
abroad, or from public or private research centers.
L’archive ouverte pluridisciplinaire HAL, est
destinée au dépôt et à la diffusion de documents
scientifiques de niveau recherche, publiés ou non,
émanant des établissements d’enseignement et de
recherche français ou étrangers, des laboratoires
publics ou privés.
Energy Saving in Carrier-Grade Networks: A Survey
Rihab Maaloul, Lamia Chaari, Bernard Cousin
To cite this version:
Rihab Maaloul, Lamia Chaari, Bernard Cousin. Energy Saving in Carrier-Grade Networks: A Survey.
Computer Standards and Interfaces, Elsevier, 2018, 55, pp.8-26. �10.1016/j.csi.2017.04.001�.
�hal-01539826�
Energy Saving in Carrier-Grade Networks: A Survey
Summary—Energy consumption of large-scale networks has become a primary concern in a society increasingly dependent on information technology. Novel solutions that contribute to achieving energy savings in wired networks have been proposed to mitigate ongoing and alarming climate change and global warming. A detailed survey of relevant power-saving approaches in wired networks is presented here. We give a special focus on carrier-grade networks. At first we perform a comprehensive study of communication infrastructures regarding energy saving. Then, we highlight key issues to enable green networks, ranging from network design to network operation. After that, we present the major contributors to power consumption in wireline networks. Afterwards, we survey, classify, and compare the main energy-aware methods and mechanisms that are the most appropriate for improving the energy efficiency of carrier-grade networks.
Keywords—Green networking; wired networks; energy consumption in network devices; energy-aware traffic engineering; carrier grade networks
I. INTRODUCTION
Reducing electricity bills and energy consumption has become a crucial goal for all industries, including the Information and Communication Technology (ICT) sector, as it is rapidly becoming an important play-actor in daily life [1, 2]. The alarming figures reported by worldwide energy consumption have pushed telecom operators to rethink their network policy [3]. Nowadays, the function of the ICT is progressed by addressing energy awareness in all phases of production and service delivery. Energy-aware studies in communication networks, especially with respect to the environmental conditions, are commonly referred to as green networking.
As the traffic demand continues to grow, it requires additional network resources with higher capacity and faster processing speeds. Moreover, the improvements in network infrastructure drive the quest for green networking. Particularly, transport and carrier grade networks represent permanent and extensive resources of power consumers. For instance, data center operators require a considerable amount of power to operate server stacks, storage equipment, cooling equipment, operation room and so on. Green networking has two main reasons [4]:
1) The enviromental reason: most energy consumption
is accompanied by non-negligible GHG (Green House Gas) emission that has harmful consequences on climate. In addition, a decrease in GHG emission volume between 15–
30 % is required before 2020 to keep the global temperature increase below 2°C [5].
A large set of telecom operators and Internet Service Providers (ISPs) consider GHG reduction and its ecological impacts. In fact, the volume of carbon dioxide emissions produced by the ICT sector alone is estimated to be over 2% of the total world carbon footprint in 2020 [6]. In 2007, this 2% was equivalent to 830 million metric tonnes of carbon dioxide [7] and it would be about 1100 million tonnes by 2020 [8,9].
Statistical reports provided by certain telecom operators state the overall amount of their power requirements and the related carbon footprint [10–12]. All of these studies show that ICT energy consumption represents an important carbon dioxide emission and will increase rapidly if no green technique is adopted. It might account for more than 35.8 TWh by 2020 [196][197].
2) The economic reason: the rapid increasing of
CAPEX (Capital Expenditure) and OPEX (Operational Expenditure) represents a major economical concern. CAPEX is related to network infrastructure establishment cost, whereas OPEX is related to network operation and administration. Energy costs have been investigated by the operators and their financial damage has been put in perspective. Figure 1 shows the constantly rising energy costs. Moreover, [13] anticipates that a one-third reduction of carbon footprint emissions could create an economical benefit greater than the investments required to attain this goal. Table I presents the cost of energy devoted for network devices The estimation of energy consumption is based on the primary/seminal study done by [14], which states the annual electricity consumed by networking devices in the U.S. was 6.06 TWh, which costs USD$1 billion per year and it is equivalent to one nuclear reactor.
As a result of these two reasons, international projects and research bodies have focused on developing green network infrastructures. We show here the key enablers to understand the source of energy waste and by what means energy could be saved. Also we present the most relevant achievements that allow a better ratio of performance to energy consumption in wired networks. The emergence of a multitude of approaches and mechanisms on power saving necessitates a study and an analysis of these different approaches in order to identify and classify the potential mechanisms for different scenarios and network domains.
Rihab Maaloul
Lamia Chaari
Bernard Cousin
National School of Engineering, LETI laboratory,
Sfax, Tunisia
National School of Engineering, LETI laboratory,
Sfax, Tunisia
University of Rennes 1 IRISA,
Rennes, France [email protected] [email protected] <first-name>.<name>@irisa.fr
Figure 1. Estimated OPEX for the European telcos’ network infrastructures in the ”Business-As-Usual” (BAU) and in the Eco sustainable (ECO) scenarios, and cumulative savings between the two
scenarios [4].
We place specific emphasis on energy-saving studies dedicated to carrier-grade transport networks [15, 16]. These networks are energy-hungry infrastructures; they run large-scale systems to deliver internet services. We choose correspondingly to overview approaches that could be helpful and adapted to carrier-grade transport networks. Carrier grade means extremely high reliability and refers to the capability to support thousands if not millions of subscribers [17]. To the best of our knowledge, it doesn't exist any review focalized on carrier-grade networks. A carrier-grade network is not a single technology, but rather a collection of different technologies. A set of functionalities and requirements must be defined in carrier-grade communication: (1) Scalability; (2) Resilience; (3) Quality of service; and (4) Service management. In networks that involve carrier-grade requirements, power saving often induces the reduction of network redundancy or network performance. For instance, in order to meet the resiliency and quality of service requirements, the network should provide fast fault recovery (under 50 ms) through a number of duplicated resources that are not used frequently. Considering the performance trade-off versus power saving, designing efficient power-saving strategies is a real challenge. Nevertheless, the green communications and networking fields are still in their early stages; yet they have already spurred a considerable number of interesting works, which are surveyed and analysed here.
The remainder of this article is organised as follows. Section II provides an understanding of how different parts in the network infrastructure contribute to power consumption. Section III explains the inevitable synergy of several paradigms that reduce energy consumption. Section IV presents the concept of energy profiles for routing equipment. Section V focuses on the frequent network architectures used in carrier-grade networks. Section VI proposes a classification with an analysis of the relevant approaches in the field of green networking. Afterward, the main issues of energy-efficient and operational carrier-grade networks are presented in Section VII. Finally, Section VIII concludes the study.
II. PRINCIPAL CONTRIBUTORS TO NETWORK ENERGY
CONSUMPTION
In order to gain a complete view of the principal contributors to energy consumption, it is crucial to consider the communication networks globally from the user level to the transport level, as shown in Figure 2. We identify three key contributors that consume energy within the overall network infrastructure: network devices, network architecture, and delivered services.
Figure 2. Overall network energy consumption
A. Network devices
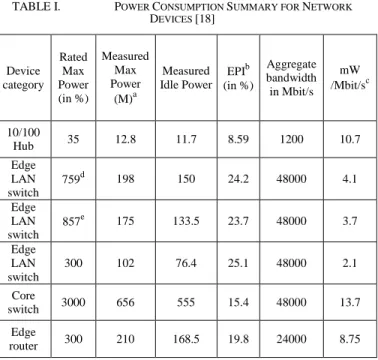
The most important contributor to the power expenditure of network systems are the physical networking devices. This includes elements in different network domains: core, metro, and access networks. Several strategies have been proposed for the energy management of networking devices, ([18] among others).
TABLE I. POWER CONSUMPTION SUMMARY FOR NETWORK
DEVICES [18] Device category Rated Max Power (in %) Measured Max Power (M)a Measured Idle Power EPIb (in %) Aggregate bandwidth in Mbit/s mW /Mbit/sc 10/100 Hub 35 12.8 11.7 8.59 1200 10.7 Edge LAN switch 759d 198 150 24.2 48000 4.1 Edge LAN switch 857e 175 133.5 23.7 48000 3.7 Edge LAN switch 300 102 76.4 25.1 48000 2.1 Core switch 3000 656 555 15.4 48000 13.7 Edge router 300 210 168.5 19.8 24000 8.75 a
M is the amount of the power consumed in W,
b
c
Measured max power in mW / Aggregate bandwidth in Mbit/s. This term is equivalent to Joules per bit.
d including 400 W for PoE (P over Ethernet ) e
including 400 W for PoE .
Each type of network device (hubs, routers, switches …) has its own architecture and functionalities. Hence, each network device presents a power consumption that is influenced by many factors such as manufacturer type, number of active ports, number of line cards, traffic characteristics, and used protocols. Since there is no standard used in powerline measurement of network devices, some benchmarks are used as reference to characterize the power consumption. Indeed, various workers have proposed models to describe the energy consumed by network devices such as hubs, switches, routers, and other network devices, starting from the pioneering work of [14] and following works such as [18– 21]. Table I lists the power consumption of the main network devices, as shown in [18]. We observe that almost every specified device demonstrates non-proportional energy consumption behaviour, as shown by the EPI values. Thus we observe significant independency between the energy consumed and the traffic throughput. However, relying only on the power consumed at the maximum rate reported by data sheets can overestimate the current power consumption. Other studies [22–24] focus on minimizing the power dissipation of specific components such as Network Interface Card (NIC), hard disks, and CPUs. Thus, [25] measure the power consumed by the main components of a typical rack server (Table III).
European Union (EU) has published power consumption guidelines in different updated version of conduct code on energy consumption of broadband equipment. In this respect, we reproduce in Table II the power values for WAN components interfaces [119].
TABLE II. POWER CONSUMPTION FOR MAJOR COMPONENTS OF A
TYPICAL SERVER[25]
Component Peack power (W) Count Total (W) CPU 100 2 200 Memory 20 4 80 Disk 10 1 10 Motherboard 40 1 40 Fan 30 1 30 System total 360
TABLE III. POWER CONSUMPTION FOR WANINTERFACES [119]
Component 2013-2014 Idle-State (W) On-State (W)
Fast Ethernet WAN 2.0 3.0 Gigabit Ethernet WAN 2.5 5.0 FibrePtPFast Ethernet WAN 2.9 5.0 Fibre PtPGigabit Ethernet WAN 3.2 5.6 10/1G-EPON 4.8 6.2 10/10G-EPON 5.3 7.7 XG-PON1 4.8 6.5 Gigabit Passive Optical Network
(GPON) 3.5 5.0 Ethernet Passive Optical Network
(EPON) 3.5 4.7
Figure 3 shows the contribution of different types of network device to the worldwide energy consumption according to the analysis of Lawrence Berkeley National Laboratory (LBNL) campus [26] in 2009. These figures demonstrate that network switching and premises equipment are the largest categories, for about 70%, of the overall energy use.
Figure 3. Energy use of netowrk equipment
0 2 4 6 8 10 12 14 2007 2008 2009 2010 2011 2012 E nerg y us e [T Wh]
10/100 Standalone Switches (Ports) 10/100/1000 Standalone Switches (Ports) Modular Core Switches & 10G Switches (Ports) Large Routers (Devices)
Small & Medium Routers (Devices) Cable Users (Devices)
Due to the technological advances in the ICT field, there is an important necessity for a permanent evaluation of the energy consumed by network devices. Such an evaluation is achieved by the cooperation of network manufacturers, ISPs, standard organizations, and national regulators [27].
B. Network architecture
The network architecture is the design of the telecom network that specifies the network’s physical elements and their operational configuration. The network architecture is typically split into three network domains: core, metro, and access networks. In these different domains, the equipment involved, their objectives, their expected performance, and their power consumption levels differ. According to [28], Telecom Italia was the second largest consumer of energy in Italy, consuming more than 2TWh per year. Table IV shows overall consumption foreseen for each network domain of Telecom Italia for the years 2015–2020.
TABLE IV. 2015–2020NETWORK FORECAST/DEVICE DENSITY
AND ENERGY REQUIREMENTS IN THE BUSINESS-AS-USUAL (BAU). EXAMPLE BASED ON THE ITALIAN NETWORK[28].
Power consumption [W] Number of devices [#] Overall consumption [GWh/year] Home 10 17,500,000 1,533 Access 1,280 27,344 307 Metro 6,000 1,750 92 Core 10,000 175 15 Overall network consumption 1,947
Core network: often referred to as the backbone network or as the long-haul infrastructure, which interconnects large cities over continental and even intercontinental distances [29]. The core network is based on a mesh interconnection pattern and carries a large volume of traffic. In the backbone network, pairs of routers are typically connected by multiple physical cables that form one logical bundled link [30] that participates in intra-domain routing protocol. Link bundles are accustomed because when capacity is upgraded, new links are joined beside the existing ones, rather than replacing the existing equipment with a higher capacity link. For example, a 40 Gbit/s bundled link can involve four OC-192 cables with 10 Gbit/s of capacity for each cable.
In 2009, [31] suggested an increase of core network consumption: by 2017, the power consumption of the core network will be equal to that of network access. Furthermore, this study predicts a staggering increase of 300% in power consumption of the core domain in the coming decade.
Metro network: this is the domain of the telecom network that typically covers metropolitan regions. It aggregates the highly fluctuating traffic of residential subscribers from the end user to the core network serving as an interface between the access and the
core. Different networking technologies have been deployed in diverse metro regions across the world. Today’s dominant metropolitan area networks (MAN) are: SONET (Synchronous optical Networking), Optical WDM ring, and Metro Ethernet Hierarchy. Nowadays, ISPs tend to offer Ethernet in MAN networks, which are arguably more flexible, scalable, and cost-effective compared to legacy SONET architecture [32]. Its basic components are edge routers, broadband network gateways, and Ethernet switches.
Access network: this part represents the end users connected to POPs (Point of Presence) via a multitude of physical media (e.g. optical, DSL, wireless). It is a major consumer of energy because it comprises a huge number of active elements [33]. There are several different access technologies that can be roughly classified into two main categories: wired and wireless. A detailed analysis of the energy consumption for the main used access technologies was given in [34], [71], and [120].
C. Services
Power consumption is influenced by the nature of the services being provided. In other words, the system activity and the usage of network resources deployed to deliver network services. Indeed, the greatest amount of Internet traffic arises from a wide range of web-based services and applications available to end users via the Internet [35], such as cloud services, content delivery and storage as a service. For instance, content services involve servers that store up the data/content and control access to it. The ability to run any of these services assumes that the network system has sufficient power to perform the task.
The network system offers the following types of services:
Shared services: such as Network File System (NFS), web browsing and email. These services can be oversubscribed in that many users may share the offered bandwidth without observing any degradation in the quality of their service.
Dedicated hosting services imposing different levels of quality of service: a dedicated network resource for each service has to be supplied through the access and backhaul network to the hosting servers. Cloud services: cloud computing is expected to be the future internet service model by offering network-based rather than desktop-based applications [36]. Clouds exploit a significant amount of equipment and management techniques to allow customers to share a large pool of software, storage, platforms, and computational resources [37]. The most popular cloud based services are content delivery, Storage as a Service (StaaS) and virtual machines-based applications. Also, these services consume various levels of energy according to their proprieties, i.e. complexity, heterogeneity and large scale.
The key points for greening carrier-grade networks are the green operations of network infrastructure, the delivery of services through energy-efficient equipment and implemented power management, as outlined in the next section.
III. BUILDING A GREEN NETWORK
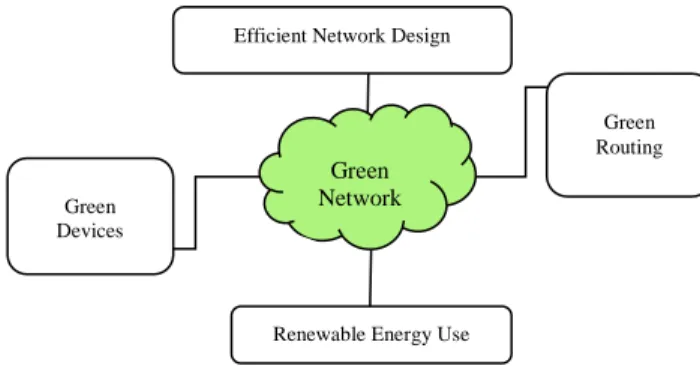
Making a network operate in green way compels the identification of several issues using energy efficiency as the primary goal. In order to obtain a green network, at least four key issues should be adopted, as presented in Figure 4.
Figure 4. Key issues for greening networks
The green devices issue seeks to build a new generation
of energy-efficient devices. In this respect, over the next few years, industry has developed energy-efficient and low-carbon technologies. In order to accomplish this objective, 10 key actions should be realised that are outlined in [38]. [39] proposes to replace the electronic circuits within routers by photonic circuits. They could reach over 10 Tbit/s of attainable speed versus 100 Gbit/s attained by electronics. However, the power consumption of photonic signal processing technologies is not feasible to be adopted. The same workers, in one of their next works [40], presented a perspective on device power consumption. They claim that network devices working in the different parts of the network play a crucial role because the main power consumption in networks comes from their operational power exigencies and density.
The GreenTouch[121] and ECONET[122,123] initiatives are the most relevant green networking projects appeared by the year 2010. GreenTouch focused on all-optical networking systems, while the ECONET project has contributed to speed-up the reduction of energy consumption in silicon elements of network devices, as well as in copper-based access technologies (namely, VDSL), which both are expected to be used and deployed in telco networks up to the next 15 years.
The efficient network design issue aims at dimensioning
the network architecture and organising the devices in such a way that they consume a lower amount of energy. The European Commission realised the significance of this issue, which appeared in its 7th Framework Program FP7 [41]. This later activated the TREND project (Toward Really
Energy-Efficient Network Design), which has certain pertinent achievements [42]:
Collection of comparable data to assess the power consumption of terminals, devices and infrastructures, and the identification of power consumption trends in networking.
Identification of energy-friendly devices, technologies, algorithms, protocols and architectures, and the investigation of how they can be introduced into operational networks.
Definition of new energy-aware network design criteria.
Experiments that prove the effectiveness of the proposed approaches.
Identification of a roadmap for energy-efficient networking.
Green routing issues aim at introducing energy-aware
mechanisms inside routing protocols, which would be able to manage the power state of network resources dynamically. In this regard, numerous studies have proposed several energy-efficient algorithms to route the traffic [43– 47]. These works focus on routing path selection subject to minimising the energy consumption, whether by powering off devices (or part of them) or by routing the traffic through energy-efficient paths that are weighted according to their energy impact [48].
On the other hand, [49] validated that geographical delocalisation is a promising approach to reduce the cost of electricity related to the routing. In fact, large companies like Amazon have systems that are geographically distributed where electricity has a lower cost. However, this technique is helpful from an economical point of view, but does not reduce the power consumption.
Renewable energy use aims at exploiting renewable
resources such as the Sun, wind, and water, hence reducing expenditure as well as the emission of a carbon footprint.
In this respect, renewable energy utilisation makes use of
several concepts such as the option to choose a greener resource, electricity price-based, energy resource availability and the localisation of renewable energy generators for smart grid communications and renewable electricity use [50–52].
Moreover, a number of popular ICT companies are becoming dynamic supervisors in their electricity use. Table V indicates information on renewable electricity and carbon footprint reduction goals identified by ICT organisations [53].
TABLE V. RENEWABLE ELECTRICITY AND CARBON REDUCTION
GOALS FOR LEADING ICT ORGANISATIONS[53].
Company Renewable Energy Goals Renewable Energy Goal year Carbon Reduction Goal Carbon Reduction Goal Year
Amazon 100% Long-Term None
Specified
None Specified
Apple 100% Long-Term None
Specified
None Specified
Green Network
Efficient Network Design
Green Devices
Renewable Energy Use
Green Routing
Cisco 25% Annual Goal: 2013– 2017a 40% 2017 Dell 50% 2020 50% 2020 eBay 8% 2015 10 % reduction in carbon per transaction in 2013 2013
Facebook 100% Long-Term None
Specified
None Specified
Google 100% Long-Term Carbon
Neutral Ongoing IBMb None Specified None Specified Third-Generation GHG Goal Upcoming Upcoming Intel None Specified None Specified 10 % reduction per chip in GHG direct emissions 2020 Microsoft 100% 2014 Carbon Neutral 2014 Rackspace 5% increase annually until goal attained (35% in 2013) 2026 (based on 5% annual increase from 35% in 2013) None Specified None Specified Sprint 10% 2017 20% 2017 Twitter None Specified None Specified None Specified None Specified Vmware Not Applicable Not Applicable 40% 2050 Yahoo! None Specified None Specified None Specified None Specified a
Cisco is seeking to source 25% of its electricity use annually from renewable energy from 2013–2017
b Information is specific to IBM’s Austin, TX; Costa Mesa, CA; and Foster City, CA facility.
IV. ENERGY PROFILES
Profiling the energy consumption for network devices motivates manufacturers to implement green technologies and to achieve meaningful power savings. The energy profile is defined as the dependence of the energy consumption (in Watt-hours, Wh) as a function of four main factors: the traffic load through the device, the number of active ports, the line speeds, and firmware version [30].
Figure 5 shows various energy profiles depending on the traffic through the network devices [48]. Moreover, the case-study calculation results show that by applying energy profile aware routing, a significant amount of energy and operational cost can be saved.
--On-Off: this energy profile corresponds to the
characteristics of many existing devices. It is the most simple energy profile that fully empowers the network equipment when this is later turned on (e.g. the operation of traditional Ethernet switches). The energy consumption of this profile does not depend on the usage (i.e. actual traffic load).
Figure 5. Proposed Energy Profile [48]
--Linear:devices belonging to this energy profile exhibit a
power consumption that is proportional to their usage. Switch manufacturers such as Batcher, Fully_connected and Crossbar follow this energy profile [54]. Ideally, devices should have a linear energy profile. In addition, Barroso [55] introduced the propotional computing concept that may be applied to individual devices and components such as PCI slots and CPU cores to be into a sleep state when they are idle.
--Log 10: this energy profile is an approximation of the
profile produced by devices using the hibernation technique, so-called low-power idle proposal adopted in IEEE 802.3az Task Force [56]. Moreover, in [57], it was shown that the energy consumption can be as low as 10% compared to that of the On-Off energy profile.
--Log 100: this energy profile corresponds to an
intermediate function between Log10 and On-Off
representation. It might be a realistic end result when the proposed techniques by IEEE 802.3az are implemented.
--Cubic: this profile corresponds to equipment that adopts
power reduction techniques like dynamic frequency scaling DVS (Dynamic Voltage Scaling) and DFS (Dynamic Frequency Scaling). In [58], Ethernet interface cards implementing DVS and DFS were demonstrated to reduce power consumption cubically.
Another study of energy consumpion profiles was introduced in [60]. Figure 6 depicts the different load-dependent energy profiles as well the optimised footprint that a device could present as a function of its utilisation.
(a) Energy consumption as a function of utilisation
(b) Optimised footprint as a function of utilisation Figure 6. Load-dependent energy consumption [55]
Another important energy profile model was introduced in [5]. This model is achieved through analytical framework. It allows estimating the energy profile of network devices, within diverse states, adopting two mechanisms, i.e. Adaptive Rate (AR) and Low Power Idle, described in Section V. Figure 7 shows an energy profile corresponds to a generic device that has four available AR states (S). The power consumption of a device is assumed to have S power states, which are thought to be ordered from the lowest energy consumption state (s=0) to the most energy-hungry state (s=S-1). Where 𝛾 is the dependency parameter of idle optimisation from power states (if 𝛾 = 0, idle logic is completely unaware of power states, if 𝛾 = 1 there is no idle logic). 𝜆 is the normalized value of traffic load incoming to the device. ∅ indicates the energy consumption of the device. 𝜎 is a shape parameter of idle optimisation efficiency (ideal case, real case). 𝜉 represents how much is conservative the optimisation in terms of choosing the most suitable power state maintaining the desired QoS level for the incoming traffic. Finally, 𝜐 is a shape parameter of power states’ energy consumption. The optimal profile simply consists of a piece-wise curve, composed by the most power saving parts of AR curves guaranteeing that the sum
between the average incoming traffic load and a guaranteed threshold (𝜉 ) is lower than the maximum value of the service rate in AR states.
Figure 7. Energy profiles in various AR states in the presence of LPI primitives and the resulting optimal device energy profile[5]
Network design and traffic-engineering decisions can exploit the full energy-saving potential of network devices using information of load-dependent energy consumption and energy profiles. In this respect, a recent standardised interface referred as Green Abstraction Layer (GAL), has been approved by ETSI (the European Telecommunication Standards Institute) [124]. GAL interface enables energy management protocols to consistently determine which power management capabilities are available at the data plane, their potential effects on both energy consumption and network performance, and how to interact with them. [125] illustrates how GAL represents a multilayered (four-layers) abstract model of the energy-saving capabilities for devices deploying local and network-wide control policies in a heterogeneous setting. Besides GAL, an energy-management working group (EMAN) has been established by the IETF [126]. EMAN reuses existing works and investigates existing standards such as those from IEC (International Electronical Commission), DMTF (the Distributed Management Task Force), ANSI and others. The EMAN framework allows monitoring heterogeneous devices connected to a network to report their energy use over the time. For instance, the EMAN framework [127] describes how energy information (measurement, characteristics, identification) can be retrieved from IP-enabled devices using Simple Network Management Protocol (SNMP) with the help of MIB (Management Information Base) modules.
V. COST AND POWER CONSUMPTION IN OPTICAL
NETWORK
Carrier-grade networks are provisioned in order to meet a set of requirements, as mentioned before, resiliency, scalability, quality of service and service management of the network. All these critical aspects are commonly supported through optical networks. Besides, deploying optical switching technologies is considered as a promising solution to enable energy efficiency in the core/transport segment of the internet. These reasons highlight the necessity to identify the cost and the power consumption of optical networks.
Hence, this section defines different architectures suitable for carrier-grade networks, especially those employing optical WDM (Wavelength Division Multiplexing) technologies. Then, we present their corresponding cost (CAPEX) and energy consumption (OPEX) models. WDM is a technology that is most probably deployed in broadband area networks. It multiplexes multiple optical carrier signals on a single optical fibre by using different wavelengths of light. WDM technology utilises Optical Cross-Connect (OXC) devices to perform switching and accelerates routing at the optical layer.
A. Network Node Architectures
The core/metro optical network architecture can be opaque and transparent [102,103]. In the opaque architecture (Figure 8), all optical signals carrying traffic undergo an optical to electronic to optical (OEO) conversion (and vice-versa) at every node in the network. On the other hand, in transparent and translucent architecture (Figure 9), OEO conversion can be avoided by simply allowing in-transit traffic to bypass optically intermediate nodes. The OEO conversion represents the largest operational cost for optical fibre networks.
- Different opaque architectures are used in practice among others: SONET/SDH, basic IP over WDM (B-IPoWDM), and carrier-grade Ethernet technologies. SONET/SDH is the legacy architecture in MAN. It is a circuit-based technology that can aggregate low-bit rate traffic streams from metro networks into high bandwidth pipes of core networks [104]. In SONET/SDH nodes, all switching in the data plane takes place in the electronic domain. In the next generation of optical transport networks, SONET/SDH will progressively disappear because it is no longer efficient to sustain today’s data traffic progress. In B-IPoWDM) architecture, inside each node an OXC is interconnected to the IP router. This architecture is also known as lightpath non-bypass design. The routers are interconnected by point-to-point optical fiber links; traffic flows undergo O/E/O conversion at every intermediate node. Moreover, in order to provide carrier-grade service, extensions to regular Ethernet switching have led the definition of what is known as carrier grade Ethernet, taking advantages of its simplicity, scalability and effective cost. Ethernet-over-fibre supports a link rate of up to 100 Gbit/s. Carrier Ethernet switch performs OEO conversion of every wavelength as in a SONE/SDH node. It can use DWDM (Dense WDM) technology. DWDM is used to transmit many optical channels on the same fibre component.
- Transparent architectures are expected to enable significant power conservation, due to the minimum needed number of OEO conversions. Among the transparent architectures one can consider: transparent Tp-IPoWDM (Tp-IPoWDM) and hub-based. This architecture is also known as lightpath bypass design. In Tp-IPoWDM, each node is equipped with micro-electrical mechanical systems (MEMS) and as for the opaque case the IP router is interconnected to an OXC device. If signal regeneration is required, the lightpath has to be dropped and the matching traffic sent to the IP router to be processed. When no
regeneration is required, a significant amount of energy can be saved because the traffic can be switched directly in the optical domain by OXCs (bypassed), conserving the capacity of the wavelength [103].
In the hub-based architecture, the traffic sent/received by an access node is either local (i.e. transmitted from/to one of the access nodes in the same metro optical network) or intermediate (i.e. directed to/from the Internet). As most of the traffic is transit traffic, the transparency is carried out by permitting every access node to have a direct light-path (i.e. specific wavelength channel) to the hub node. Evidently, the hub-based architecture is suitable for today’s network traffic states, i.e., the traffic is either terminated or originating from the Internet. Although the hub-based architecture avoids OEO conversion costs at intermediate nodes, it is insufficiently powerful especially in the case of dynamic traffic scenarios, since the qualities of optical signals degrade as they travel through numerous optical components. To overcome these impairments, sharing bandwidth of each channel between multiple source-destination nodes should be implanted.
Interested approaches are suggested in order to optimise the energy consumption in transparent networks [175, 176, 180].
Figure 8. Opaque network architecture [106]
Figure 9. Transparent network architecture [106]
B. Analytical model for the energy consumption of a WDM optical network
The estimation of the energy consumption of the physical infrastructure resources is highly dependent on the network architecture employed and the technology made. In this section, we present an analytical model that considers the WDM optical network architecture employing wavelength selective switches using MEMS [107].
The overall energy consumption model is based on the active elements of the network that can be classified as OXC nodes and transmission link-related elements. Each OXC node comprises a set of active and passive elements. Figure 10 illustrates the assumed OXC architecture. The passive elements incorporated in these nodes are: the multiplexers (MUX) and demultiplexers (DEMUX), while the active elements are: the photonic switching matrix, one Erbium-Doped Fibre Amplifier (EDFA) per output fibre port, one Optical-Electrical-Optical (OEO) transponder per output
wavelength port and one transmitter (Tx) – receiver (Rx) per lightpath located at the add and drop ports of the OXC.
Figure 10. OXC architecture [107]
As the assumed OXCs are symmetrical, the number of bypass ports of the OXC is calculated as the product of the number of input fibres and the maximum number of wavelengths that a fibre can support.
The overall network power consumption is determined by the power consumption of the individual OXCs and fibre links (which includes the installed optical amplifiers). The power consumption of node n (𝑃𝑂𝑋𝐶𝑛) depends on the four
active elements in the OXC: the power of the switching fabric Psf, power of OEO transponders for transmission
PTran, the power of the wavelength converters PCon, and
the power of the optical amplifier PAmp. Equations (1) –(4)
describe the dependence of the power consumption of the node on the individual elements power consumption. 𝑃𝑆𝐹 = 𝑝𝑜𝑟𝑡𝑠𝑡𝑜𝑡𝑎𝑙× 𝑃𝑝𝑜𝑟𝑡𝑝𝑎𝑖𝑟 = (𝑝𝑜𝑟𝑡𝑠𝑡ℎ+ 𝑝𝑜𝑟𝑡𝑠𝑎/𝑑) × 𝑃𝑝𝑜𝑟𝑡_𝑝𝑎𝑖𝑟 𝑃𝑇𝑟𝑎𝑛 = 𝑝𝑜𝑟𝑡𝑠𝑎/𝑑× 𝑃𝑇𝑥/𝑅𝑥 𝑃𝐶𝑜𝑛 = 𝑝𝑜𝑟𝑡𝑠𝑡ℎ× 𝑃𝑡𝑟𝑎𝑛𝑠𝑝𝑜𝑑𝑒𝑟 𝑃𝐴𝑚𝑝= (𝑓𝑖𝑛+ 𝑓𝑜𝑢𝑡) × 𝑃𝐸𝑑𝑓𝑎
The power of a switch fabric is computed as the number of ports (i.e. the sum of bypass ports 𝑝𝑜𝑟𝑡𝑠𝑡ℎ and add/drop
ports 𝑝𝑜𝑟𝑡𝑠𝑎/𝑑) multiplied by the power consumed by each
switch port.
The power related to the OEO transponders for transmission is the product of the add/drop ports and the power related to the transmission device 𝑃𝑇𝑥/𝑅𝑥. The power consumption of
the installed amplifiers is computed as the product of the number of incoming and outgoing fibres (𝑓𝑖𝑛𝑎𝑛𝑑 𝑓𝑜𝑢𝑡) and
the power related to the optical amplifiers.
Figure 15c illustrates the fibre link model [107], where the only power-consuming elements are the optical amplifiers installed per span. The maximum span length (span) is expected to be 80 km. Thus the power consumption 𝑃𝑙 of a
fibre link 𝑙 is length-dependent and is calculated as follows:
𝑃𝑙= ⌊𝑙𝑒𝑛𝑔𝑡ℎ(𝑙)𝑠𝑝𝑎𝑛 ⌋ 𝑃𝐸𝑑𝑓𝑎
Finally, the total energy consumption of the physical infrastructure of N OXC nodes is calculated as follows: 𝑃𝑁𝑒𝑡 = ∑𝑛∈𝑁𝑃𝑂𝑋𝐶𝑛+ ∑𝑙∈𝐿𝑃𝑙 (6)
C. Cost and power consumption
The CAPEX and OPEX of optical WDM architectures has been the subject of several case studies [102,106–108]. These analyses are often based on linear programming models and heuristic approaches.
[102] provide models for evaluating the cost, power and traffic capacity for opaque and transparent architectures. The total power consumption and the cost of an opaque and a transparent network node are determined by subdividing the node into its main functional blocks: the base node and the equipment related to the physical layer interfaces. The base node consists of the chassis, the mechanical assembly, the switching matrix, the cooling functionalities, the power supply, the control and the management functions. Every base node has a limited number of slots for physical layer interfaces.
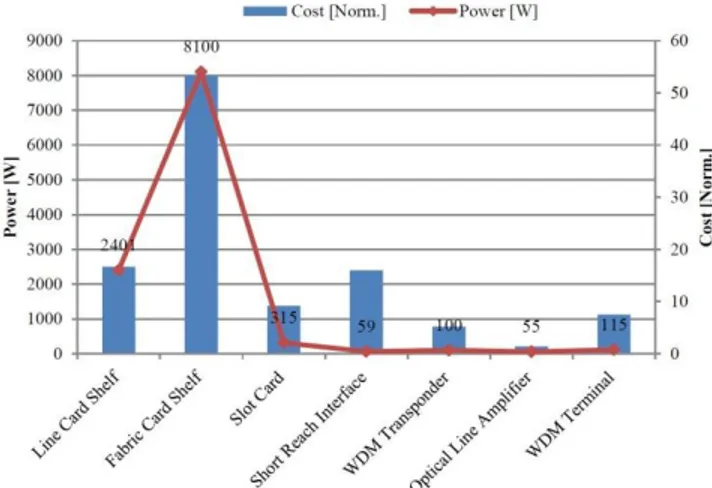
Figures 11 and 12 recapitulate the normalised cost and power consumption for the components of Ethernet carrier-grade switches and OADM (Optical add-drop Multiplexer), respectively.
Figure 11. Normalised cost and power consumption for Ethernet Carrier-grade nodes
Figure 12. Normalised cost and power consumption for an OADM
Figure 13. Normalised cost and power consumption of WDM network components
[107] models the cost of the power consumption of WDM network components in terms of cost and operational power by signal transmission, as reported in Figure 13.
The estimation of the power consumption of the network components is highly dependent on the network node architecture and the network topology. However, packet transmission time or the link load can be crucial parameters to compute the energy consumption in networks that implement power-saving mode, as demonstrated in [109]. These authors provide an analytical model to estimate the power consumption of optical Ethernet links that implement a power-saving mode. The model splits the time into discrete time intervals and assumes that the transition times between modes are a multiple of the frame transmission time.
Measuring the overall power consumption of carrier-grade networks before and after applying green approaches is an efficient metric to evaluate the applied techniques. For instance, in data centres, the most frequently used metric is power usage effectiveness (PUE). PUE is the ratio of the total energy used by a data centre, including IT equipment, to the energy consumed by the IT equipment only.
Along with PUE, three metrics allow the measurement of the energy efficiency of carrier grade networks: IT Equipment Utilisation (ITEU), IT Equipment Energy Efficiency (ITEE) and Green Energy Coefficient (GEC) [115].
𝐼𝑇𝐸𝑈 =∑ 𝑀𝑒𝑎𝑠𝑢𝑟𝑒𝑑 𝑒𝑛𝑒𝑟𝑔𝑦 𝑐𝑜𝑛𝑠𝑢𝑚𝑝𝑡𝑖𝑜𝑛 𝑜𝑓 𝐼𝑇 𝑒𝑞𝑢𝑖𝑝𝑚𝑒𝑛𝑡∑ 𝑅𝑎𝑡𝑒𝑑 𝑒𝑛𝑒𝑟𝑔𝑦 𝑐𝑜𝑛𝑠𝑢𝑚𝑝𝑡𝑖𝑜𝑛 𝑜𝑓 𝐼𝑇 𝑒𝑞𝑢𝑖𝑝𝑚𝑒𝑛𝑡 (7) 𝐼𝑇𝐸𝐸 =∑ 𝑅𝑎𝑡𝑒𝑑 𝑒𝑛𝑒𝑟𝑔𝑦 𝑐𝑜𝑛𝑠𝑢𝑚𝑝𝑡𝑖𝑜𝑛 𝑜𝑓 𝐼𝑇 𝑒𝑞𝑢𝑖𝑝𝑚𝑒𝑛𝑡∑ 𝐼𝑇 𝑒𝑞𝑢𝑖𝑝𝑚𝑒𝑛𝑡 𝑟𝑎𝑡𝑒𝑑 𝑤𝑜𝑟𝑘 𝑐𝑎𝑝𝑎𝑐𝑖𝑡𝑦 (8) 𝐺𝐸𝐶 =∑ 𝐸𝑛𝑒𝑟𝑔𝑦 𝑐𝑜𝑛𝑠𝑢𝑚𝑝𝑡𝑖𝑜𝑛 𝑜𝑓 𝑜𝑝𝑒𝑟𝑎𝑡𝑖𝑛𝑔 𝑛𝑒𝑡𝑤𝑜𝑟𝑘∑ 𝐸𝑛𝑒𝑟𝑔𝑦 𝑖𝑛𝑝𝑢𝑡 𝑓𝑟𝑜𝑚 𝑟𝑒𝑛𝑒𝑤𝑎𝑏𝑙𝑒 𝑟𝑒𝑠𝑜𝑢𝑟𝑐𝑒𝑠 (9)
In this section, we have described the main node architectures in carrier-grade networks and provided illustrative examples of how to measure overall network
power consumption, as well as the energy efficiency. Going further, more emphasis is given regarding saving energy in optical networks; among others: [175-190].
VI. TAXONOMY OF GREEN APPROACHES
This section depicts the relevant classifications provided in the literature. We give a comparison and insights of the presented classifications. Then, we provide our taxonomy for current green networking approaches.
Before presenting our taxonomy and discussing the different approaches for saving energy in networking, we present the most pertinent surveys in the literature.
A. Existing classification of green networking approaches
In the research literature, there are extensive surveys from slightly different points of view that cover approaches related to green networking [4,27,37, 128, 129].
The survey in [42] provides a comprehensive review of the techniques and solutions that aim to improve the energy efficiency of large-scale distributed systems. The authors classify existing research into four categories: (i) hardware, (ii) shutdown, (iii) slowdown, and (iv) coordination and network-wide solutions. Hardware studies approach energy efficiency by exploiting optimal equipment architecture or by designing novel energy-efficient technologies. Shutdown approaches are devoted to putting idle components to sleep. Slowdown approaches are devoted to scaling the transmission speed of interfaces dynamically according to the needs. Coordination refers to the management of network power through the improvement in protocols and architecture design.
Another survey gives a review and taxonomy of relevant techniques applied in wired networking [27]. Their taxonomy identified four branches of green networking research: (i) adaptive link rate, (ii) interface proxying, (iii) energy-aware infrastructure, and (iv) energy-aware applications. Adaptive link rate refers to scaling down the
link rate proportional to the traffic load, even to zero i.e. to the sleep state. Interface proxying refers to reducing power consumption at the application layer while the network connectivity is maintained due to the proxy structure. The energy-aware infrastructure category includes methods that adopt energy consciousness throughout the network design stage. The final category, energy-aware applications, focuses on studies that call for energy consciousness in software design.
A detailed survey on emerging technologies, standards efforts, and projects is given in [4]. These authors identified three categories of green networking research: (i) re-engineering, (ii) dynamic adaptation, and (iii) sleeping/standby. The first category intends for network devices and architecture to be optimised or to design new network equipment completely. The second category, dynamic adaptation, suggests approaches that work on modulating the capacities of network device resources in order to meet the actual services and traffic requirements. Finally, sleeping/standby is founded on power management basics that allow network equipment (or parts of them) to be switched off, to enter very low power states.
A recent survey [128] mainly focuses on energy efficient solutions for cloud-based networking components, making use of the system literature review (SLR) research method [129]. Four groups of methodologies have been identified based on the networking component granularity: (i) Data Center (DC) layer, (ii) Application (App) layer, (iii) Network layer, and (iv) Device layer.
Additionally, the green traffic engineering approaches have been studied from the perspective of optimisation modelling issues in the survey article [130]. The approaches have been split into two main groups: (i) flow-based routing and (ii) shortest path routing. We draw Table VI to compare this work with other related works.
TABLE VI. FOCUS CONCEPTS OF THIS STUDY VIS-A-VIS RELATED SURVEYS
Survey
paper Key aspect
Node level Network level
Hardware optimisation
Software
optimisation Proxying Virtualisation
Traffic engineering with traditional
protocols
Traffic engineering with SDN
[4] Engineering of wired and
wireless network devices - -
[37]
Techniques that improve energy efficiency of computing
and wired network ressources
- -
[27] Green emergent technologies in
wired and wireless networks - -
[128] Energy efficient solution in
[130]
Optimisation modelling for energy-aware traffic engineering in wired and
wireless networks
- - - -
This study
Energy consumption measurement and techniques that enhance energy efficiency
for wired (main focus) and carrier grade networks
B. Classification of green networking approaches
Merging the main points of the three reviews above, we propose a new taxonomy of energy-aware strategies for green networks, as illustrated by Figure 14. Our classification is focused on two main categories: node level and network level. In the former category, two kinds of optimisation-based strategies are proposed: either energy optimisation strategies, which are applied on hardware design; or energy optimisation strategies, which are applied on software functions. In the latter category, the energy-saving problem is treated at network level; this category can be divided into three main sub-categories: proxying, virtualisation, and traffic engineering. The final sub-category can be further classified into two kinds of traffic engineering: soft-defined networks and traditional protocols.
1) Node level
a) Hardware optimisation
A large number of studies and projects have introduced energy-aware technologies to exploit them efficiently inside network equipment design [59–64]. The main focus of these projects is to reduce the power consumption of specific components per node such as CPUs [24], disks [23] and NICs [22]. Energy-aware Strategies Node-level Network-level Hardware Optimisation Proxying Virtualization Traffic Engineering Traditional Protocols Software Optimisation Soft Defined Network
Figure 14. Taxonomy of green networking approach
The basic technique of these approaches is to scale the voltage and frequency (i.e. power consumption) proportional to the service demand. For example, link transmission rates between components can be modulated to limit the energy consumption and to meet the actual traffic requirements. This hardware management capability is usually referred to as power scaling, AR (Adaptive Rate) or as ALR (Adaptive Link Rate).
The ALR technique was first described by Gunaratne et al in 2005 [131] target to adjust NICs speed to the effective workload. Two main methods keys are needed to develop the ALR technique. The first is to determine exactly how the link data rate is switched, namely ALR mechanism. The second defines an ALR policy to decide when to switch the link data rate, in such a way as to minimise the increase of the packet delay and to maximise the power saving. Thus, the performance tradeoff in ALR techniques is packet delay versus power saving.
In order to avoid the time of sending a long frame preamble, Gunaratne et al in 2008 [65] proposes a faster handshake and resynchronisation mechanism, which is implemented using Ethernet MAC frames, able to execute them effectively in less than 100 μs at 1 Gbit/s. Initially, the link that determines the need to increase or decrease its data rate requests a data rate change using ALR Request MAC frame. Then, the receiving link replies to the data rate change request with either an “ALR ACK reply” if it agrees to change the data rate, or an “ALR NACK reply” if it does not agree. After the ALR ACK response, the link data rate can be switched and the link resynchronised. The total time of the handshake and resynchronisation process can be less than 100 µs for 1 Gbit/s Ethernet.
In [66], a Markov model is developed where the Ethernet link data rate is a function of link use. This proposal identifies high-buffer and low-buffer thresholds. The use of two thresholds avoids frequent oscillations between two rates. When the buffer occupancy reaches the high-buffer threshold, the link rate is increased to a higher value, and when it goes under the low-buffer threshold, the link rate is decreased. The difficulty lies in finding good values for these thresholds in order to avoid packet losses and oscillations, since switching between rates takes time. A similar mechanism, called the Dynamic Adjustment of Link Width (DAWL), suggested in [67], also uses dual-threshold based on link utilisation. These authors advocate that the distribution of operating rates and their
corresponding power consumption significantly influences the efficiency of the adaptation techniques.
In addition, components can be exchanged by more energy-efficient mechanisms such as the replacement of electrical components with their corresponding item in the optical domain [68–70].
In addition to ALR technique, LPI is also an energy saving technique delivered by the hardware level. Indeed, the IEEE 802.3az task force [56] defines the LPI technique to offer the standardisation solution, Energy Efficient Ethernet (EEE), to improve Ethernet NICs and switches. EEE defines two operational modes for transmitters and receivers: active mode and LPI mode (i.e. idle link period). Compared to the active mode, LPI mode brings the energy consumption down to 10%. The basic concept is to transmit data as fast as possible; to let then the device spends a significant fraction of time in low power or (sleep) mode. However, the transition between the different modes creates an overhead to every burst of one or more packets sent consecutively. As a result the energy saving achieved is strongly dependent on the traffic pattern and packet size distribution. In other words, the average power consumption of Ethernet interface is heavily dependent on the fraction of time the interface spends in LPI, active, and transitioning between states. The EEE performance is improved in particularly using a technique called burst transmission [132] or packet
coalescing [57], which allow overcoming the effect of EEE
overhead. The idea of packet coalescing technique is to aggregate packets in a buffer until either the buffer is full or the timeout expires. However, the buffer size and the coalescing timeout setting strongly affect the trade-off in EEE performance. Since then, several works addressed modeling and performance analysis of EEE based on various traffic parameters and with and without consideration to packet coalescing [133-139]. In [133] authors provide an evaluation of static and dynamic coalescing for EEE in which buffer size and timeout are fixed (static) and adapted to traffic pattern (dynamic). The results show that static coalescing and dynamic coalescing algorithms achieve similar power saving and delay tradeoffs. Therefore, static coalescers are preferable for real implementation due to their low complexity.
The work in [135] provides an accurate traffic model with GI/G/1 queues for both frame and burst transmissions. The model allows predicting the average energy saving as well as the impact of sleeping algorithms on packets delay. However, this model is valid only for unidirectional traffic and specifically designed for the case of 10 Gbit/s links. Also, the work in [139] provides a model that can be used for three available EEE links: 100BASE-TX, 1000BASE-T and 10GBASE-T. By analysing energy consumption and various network performance indexes in closed form, i.e., without upper bound and lower bound approximations, makes the model suitable to be adopted in optimisation frameworks. This model can be used and useful for dimensioning interfaces during the design phase of a datacenter.
Figure 15 shows the transitions between modes as defined in EEE, as well as, it indicates a qualitative indication of the energy consumption 𝐸(𝑡) for the different periods. However, the sleep and wake-up periods are intensely greater for small frames and higher speed [139].
Figure 15. Relative power consumption for different periods of EEE
𝑇𝑠 is the sleep time required to enter LPI mode. Once the
device enters LPI mode, it stays quiet during large period 𝑇𝑞,
and only sends signals during short period 𝑇𝑟 (refresh time).
𝑇𝑟 permits faster wake-up time and maintains alignment
between Transmitter (TX) and Receiver (RX). Once frames arrive, the link should exit the LPI mode taking 𝑇𝑤 seconds
to be in active mode during 𝑇𝑎 seconds. Finally, refers to the
average duration idle/busy cycle.
In [71], the energy consumption of representative optical and wireless devices that are provided from manufacturers’ data sheets for optical access networks is analysed. The energy consumption model is defined as a function of the access rate to users, and is strongly based on traffic estimation. This analysis takes into account various network technologies (DSL, HFC, PON, FTTN, point-to-point optical system, UMTS (WCDMA), and WiMAX). They demonstrate that passive optical access networks (PONs) and point-to-point optical networks are the most energy-efficient of the available access technologies.
b) Software optimisation
Current technologies, including software, consider energy efficiency in their operating systems and software applications. The running software hides various processor techniques that might waste electricity. Research demonstrates that operating systems having a heterogeneous power consumption could be improved to consume less power [72,73]. In other words, device consumption within a different version of the same operating system can have considerable variation.
Software power management is promoted by the Advanced Configuration & Power Interface (ACPI) standard [74]. The main idea consists of the operating system managing power supply for each component, in order to avoid unnecessary power consumption. This standard provides an interface between the hardware and software layers, by modelling the different set of working and idle states (C-states). C-states are described as follows: the C0 power state is an active power state where the CPU performs tasks, while the C1 to
the processor consumes less power and dissipates less heat. Furthermore, as the sleeping power state (C1, ..., Cn) becomes deeper, the transition between the active and the sleeping state (and vice versa) needs longer time. Table VI shows that the transition between the C0 and C1 states requires only a few ns, while 50 μs are required for the C3 state. Practically, the higher the index of C states is, the lower will be the power consumed, and the heat spent.
TABLE VII. INDICATIVE ENERGY SAVING AND TRANSITION TIMES FOR COTS(COMMERCIAL OFF-THE-SHELF) PROCESSOR C-STATES
[G2010]
C-state Energy-saving with
respect to the C0 state
Transition times C0 0% - C1 70% 10 ns C2 75% 100 ns C3 80% 50 μs C4 98% 160 μs C5 99% 200 μs C6 99.9% Unknown
Similar research has attempted to hide the details of energy-saving techniques that are implemented in data-plane, by creating middleware running in computing resources [75]. In fact, middleware can influence the power consumed by the platforms as it maps physical resources and the user’s tasks [76]. For that matter, Blanquicet et al. [77] provided the means for the management of applications to measure the power consumption of IT equipment and to indicate the state at which their components operate.
2) Network level a) Proxying
The sleep proxy concept was introduced in 1998 with the pioneering work of Christensen [78]. A sleep proxy scheme enables idle end devices such as PCs to pass into sleep state dealing with their potential loss of network connectivity. Before going to sleep, the idle PC transfers its network presence to the proxy, and after that the proxy responds to non-urgent messages on behalf of the sleeping node/PC and wakes-up the node/PC only if required. It handles network requests such as ARP, ICMP and DHCP. The structure of the NPC (Network Proxy Connectivity) scheme is shown in Figure 16. Since the proxy consumes much less than the CPU of the PC and one proxy can be shared by many PCs, the energy consumption of the system is reduced.
Figure 16. Network connectivity proxy
Another proxy structure can be implemented in NICs. This solution is referred to as interface proxying, and does not need external proxy devices. NIC proxying implements a small handling to the incoming traffic: each NIC handles non-urgent traffic, while a whole node will wake up when
urgent traffic requiring further computation is received. In [79], a framework is proposed to implant NIC proxying over existing hardware. It supports a line speed of up to 1 Gbit/s in its software implementation (on the Smart-NIC), and up to 10 Gbit/s in its hardware implementation. The hardware implementation consumes only 25% of the power consumed by the software implementation. For higher energy savings, it should reduce the number of device wake-ups and define longer sleeping intervals.
[80] analysed the possibility of easily deploying SleepServer architecture, i.e. dedicated on-demand proxy servers. The proposed architecture allows end hosts to utilise power saving modes more frequently. SleepServers use a very simple application agent on the end hosts. They are easily deployable because they do not necessitate any changes to current hardware, software or networking structure. [81] implements four different types of proxies with increasing complexity. They demonstrate that simple approaches are not sufficient to achieve the potential energy saving. A significant implementation is vital to handle broadcast traffic accurately and take into account the residential setting. The ECMA-393 standard [141], namely ProxyZzzy, have been recently introduced to provide an overall architecture and describe a common way to implement proxy functionality. This standard specifies essentially: capabilities that a proxy may expose to a host, information that must be exchanged between a host and a proxy, and proxy behaviour for IEEE 802.3 and IEEE 802.11. However, it is neutral about communication mechanisms between host and proxies as well as with an external proxy. Also, it does not specify a common interface for monitoring the proxying operations. Finally, to estimate the potential savings, authors in [142] analysed real patterns for home and office environment of proxying network connections. They provide full spectrum of deployment solutions, as well as consider both on-board (like NICs) and external proxy (like switches and routers) implementations.
b) Virtualisation
The virtualisation of physical resources combines a set of mechanisms that enable the operation of more than one service within the same machine. Applying virtualisation to computing resources brings many benefits such as efficient hardware utilisation and resource provisioning on demand, besides the reduction of both CAPEX and OPEX costs. The virtualisation technique is considered as a mature research field [82]. In fact, it occurred very frequently in data centres. Because rack space and power are expensive, deploying additional servers and routing entities without an increase in rack space is very much needed. Multiple resources and applications within the same organisation (like servers, firewall, storage, and network entities) are on the same physical device and hence employ virtualisation to assure the proper functioning of each resource and application.
The routers are defined to be isolated logical router processes and act like a physical router. Actually, these routers do not carry full internet routes, and the flows have a
![TABLE III. P OWER C ONSUMPTION FOR WAN I NTERFACES [119]](https://thumb-eu.123doks.com/thumbv2/123doknet/12569902.345754/4.918.121.798.726.925/table-iii-p-ower-c-onsumption-wan-nterfaces.webp)
![Figure 5 shows various energy profiles depending on the traffic through the network devices [48]](https://thumb-eu.123doks.com/thumbv2/123doknet/12569902.345754/7.918.496.853.108.372/figure-various-energy-profiles-depending-traffic-network-devices.webp)
![Figure 7. Energy profiles in various AR states in the presence of LPI primitives and the resulting optimal device energy profile[5]](https://thumb-eu.123doks.com/thumbv2/123doknet/12569902.345754/8.918.85.419.111.342/figure-energy-profiles-various-presence-primitives-resulting-optimal.webp)
![Figure 8. Opaque network architecture [106]](https://thumb-eu.123doks.com/thumbv2/123doknet/12569902.345754/9.918.492.825.489.743/figure-opaque-network-architecture.webp)
![Figure 10. OXC architecture [107]](https://thumb-eu.123doks.com/thumbv2/123doknet/12569902.345754/10.918.116.794.108.627/figure-oxc-architecture.webp)