HAL Id: cea-01374002
https://hal-cea.archives-ouvertes.fr/cea-01374002
Submitted on 29 Sep 2016
HAL is a multi-disciplinary open access
archive for the deposit and dissemination of
sci-entific research documents, whether they are
pub-lished or not. The documents may come from
teaching and research institutions in France or
abroad, or from public or private research centers.
L’archive ouverte pluridisciplinaire HAL, est
destinée au dépôt et à la diffusion de documents
scientifiques de niveau recherche, publiés ou non,
émanant des établissements d’enseignement et de
recherche français ou étrangers, des laboratoires
publics ou privés.
Subcritical transition to turbulence in plane Couette
flow
F. Daviaud, J. Hegseth, P. Bergé
To cite this version:
F. Daviaud, J. Hegseth, P. Bergé. Subcritical transition to turbulence in plane Couette flow.
Phys-ical Review Letters, American PhysPhys-ical Society, 1992, 69 (17), pp.2511 - 2514.
�10.1103/Phys-RevLett.69.2511�. �cea-01374002�
69,
YSICAL REVIEW
Subcritical Transition
to
Turbulence
inPlane Couette
Flow
F.
Daviaud,J.
Hegseth, andP.
BergeService de Physique de I'Etat Condense, Centre d'Etudes deSaclay,
F
9I19-IGifsu-r Yv-ette CEDEX,France (Received 21 May 1992)The transition to turbulence in plane Couette flow was studied experimentally. The subcritical aspect ofthis transition is revealed by the stable coexistence oflaminar and turbulent domains. Byperturbing the flow, a critical Reynolds number has been determined, above which an artificially triggered turbulent spot can persist. The study ofthe spatiotemporal evolution ofthese spots shows, among other things, the existence ofwaves traveling away from the turbulent regions.
PACSnumbers: 47.20.
—
k,47.15.—
xTwo types
of
transitions to turbulence can generally be distinguished. Those where disorder appears progressive-ly, as a small perturbationof
the regular state, and those for which the systems experience an abrupt and often lo-calized transition from a regular state to a highly disor-dered one[1].
Following an analogy with bifurcation theory, the former can be called supercritical and the latter subcritical[2].
Many examples ofthe two typesof
transition to turbulence can be found in the literature. Circular Couette flow with the outer cylinder at rest or with the two cylinders corotating[3]
is agood exampleof
a system showing a supercritical transition, while coun-terrotating circular Couette flow [4] or plane Poiseuille flow[5]
are known to exhibit turbulent spots coexisting with the otherwise laminar flow. This metastabilityof
two states—
one regular (laminar) and one irregular (turbulent)—
is typical of a subcritical bifurcation. How-ever, very few experiments involving plane Couette flow have been performed, though it appears to be oneof
the simplest flows likely to display a subcritical transition to turbulence.Plane Couette flow
(PCF)
corresponds to a linear ve-locity profile which results from the relative motion oftwo infinite parallel walls at a given distance apart. It is an exact solution of the governing nonlinear equations and it is believed to remain linearly stable at all
R [6]
(R =Uh/
v, where Uis the speed ofeither wall, h=d/2
is half the gap, and v is the kinematic viscosity). This theoretical result suggests that instability inPCF
has a nonlinear origin and can be generated by finite-amplitude perturbations. Orszag and Kells have shown numerically [7] that only three-dimensional disturbances can drive a transition to turbulence at Reynolds numbers larger thanR=1000
(with our definition ofR)
and Nagata [8] has discovered the existenceof
3D finite-amplitude solutionsof
PCF
forR
&125,which provides a lower bound for in-stability and turbulence. Recently, Lerner and Knobloch[9]
and Dubrulle and Zahn[10]
have studied the influence of a small defect on the onsetof
instability for inviscid and viscousPCF,
respectively. The developmentof
turbulent spots inPCF
was also studied by meansof
direct numerical simulations by Lundbladh and 3ohans-son[11],
and a critical Reynolds numberR=375
wasfound, above which localized turbulent regions can per-sist.
Facing these theoretical and numerical works, only a few experimental studies
of
transition inPCF
have been carried out, probably due to the experimental difficulties encountered when running and making measurements in aPCF
apparatus. Reichardt[12]
has observed tur-bulence forR
&750 and Leutheusser and Chu[13]
forR
&280. More recently, Tillmark and Alfredsson have reported the existence of a transitional Reynolds numberR=360,
which is the lowestR
for which a transition to turbulence occurs if a strong enough disturbance is ap-plied[14].
In this Letter, we report experimental results concerning the transition toturbulence in aPCF.
By per-turbing the flow, we have both determined a critical Rey-nolds number above which turbulence persists and characterized the transition. We have also studied the spatiotemporal evolution ofthe turbulent spots, which ex-hibits the existence ofwaves traveling away from the tur-bulent regions.Several different geometries have been tried in at-tempts to make
PCF
[12-16].
Our system utilizes a geometry which results in no mean flow, i.e., the walls move in opposite directions with the same velocity[17].
In this geometry the two vertically oriented parallel walls move in a horizontal direction. We define these walls by using an endless transparent plastic film belt(363.0
cm long, 25.4 cm wide, and0.
16 mm thick), two pairs ofsmall rotating Plexiglas cylinders, and two large rotating Plexiglas cylinders as shown schematically in Fig. 1. The endless belt is driven, through friction, by one of the two large cylinders
(12.00
cm in diameter) which are placed at opposite endsof
the system. The cylinder which drives the belt is mechanically coupled to an ac motor which drives the system. The two "infinite" parallel planes are defined by guiding the endless belt through two pairsof
smaller cylinders7.
0 mm apart, allof
which are parallel to the large cylinders as shown in Fig. 1~ The belt is alsoguided by two glass plates, one
of
which is black and the other transparent, defining a test sectionof
1 m. Usingh
=d/2
as a length scale, the transverse aspect ratioI,
(dimensionless width of the channel) isI, =
70 and the longitudinal aspect ratio is (dimensionless length of theVOLUME
69,
NUMBER 17 PHYSICAL
REVI
EW
LETTERS
26 OCTOBER 1992 ye -Ils= ~'IL" br
Crd
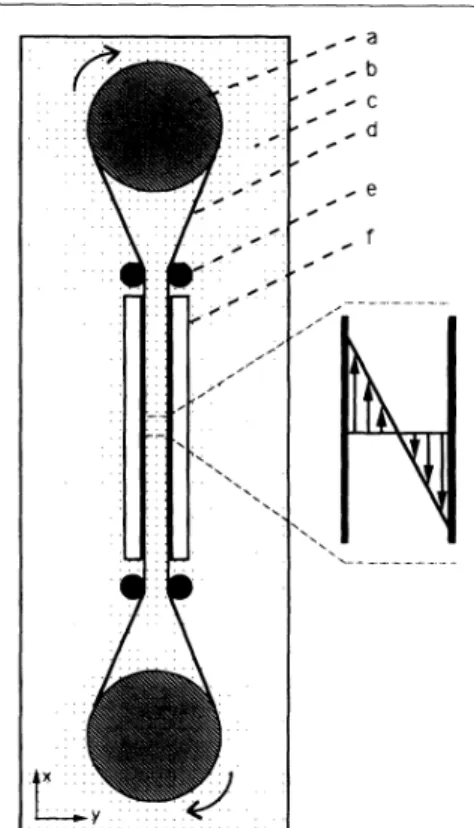
[[XFIG. 1. Schematic drawing ofthe experimental apparatus in
a horizontal plane. (a) Large cylinders, (b)tank, (c)water, (d) clear plastic belt, (e)small cylinders, and (f)glass plates.
channel)
I,
=
285. We have chosen to use a transparent belt so that optical methods in data acquisition, such as laser Doppler velocimetry(LDV)
and flow visualization with image processing, may be used. The entire assembly is placed in a glass tank which is filled with water, our working fluid, which has a viscosity ofv=0.
01 stoke at 293K.We visualize the laminar and turbulent regions by seeding the flow with a dilute solution
of
Merck Iriodin100Silver Pearl which consists ofthin and flat reflective mica platelets
(0.
1 pm thick and 10 ium across) whichalign, on average, with the stream planes of the flow. They also respond very quickly to any local change in the flow field, giving an almost instantaneous change in the light reflectance field whenever there is a change in the velocity field. This makes Iriodin an excellent indicator ofturbulence on all scales
[18].
When the flow is seeded with Iriodin, turbulence is indicated by a relatively rapid fluctuation in the reflected light field whereas in the lami-nar flow the light reflectance is steady. The light reflectance field may then be recorded using a video cam-era and subsequently digitized and analyzed by image processing. We have also visualized the velocity field in two dimensions by seeding the flow with a white ceramic powder (Pyroceram 7575, 100 Mesh) and illuminating the flow with an argon laser light sheet in a vertical or horizontal plane. The light scattered by the particles is reflected by a mirror into a camera for recording. In thismanner, we have checked that the velocity profile is linear for
R
up to 300 by following the particles in the stream-wise cross section[17].
Artificially triggered disturbances are made by a tur-bulent
jet
which is injected into the laminar flow from a hole machined in the dark glass plate. This injection is controlled by an electrovalve that is activated when the 2-mm hole in the plastic belt is aligned with the hole of the plate. The amplitudeof
the disturbance can also be controlled by adjusting the pressure ofthejet.
The system has first been studied without being artificially disturbed, in order to study the intrinsic noise
of
the experiment. ForR
(400
the turbulence is local-ized at the entrances of the test section and does not in-vade the laminar flow during observation times of more than 30 min. ForR)
400, turbulence invades the sys-tem under the form of two fronts coming from each side of the test section and contaminating the laminar flow. The size of the part that is contaminated by turbulence increases withR
while the timeof
invasion decreases withR.
ForR=450
and after 5 min, allof
the test section has been invaded[19].
Turbulent spots were initiated at given values
of R,
as described above, and their evolution was recorded in the(x,
z) plane(x
and z refer to the streamwise and span-wise directions, respectively). As expected, they are not advected with a mean velocity, but remain in the test sec-tion of the experiment. Moreover, as they are created in the center of the belt, they appear as quasisymmetrical ellipsoids, their shape being stretched in the streamwise direction(cf.
Fig.2).
We have studied the evolution ofthe spots with R and determined the minimum
R,
for the subcritical transition to turbulence. ForR
&R,
=
370+
10, the turbulent spots generated in the laminar flow relax in short times [cf. Fig.2(a)],
while for R~
R„
they are self-sustaining for arbitrarily long times[cf.
Fig.2(b)].
The mean relax-ation timer of
the spots was measured by repeating the procedure a large numberof
times for each valueof
R.
The evolution of r withR
exhibits a divergenceof
r nearR,
(cf. Fig.3).
Moreover, the fluctuations ofthe relaxa-tion times around the mean value increase when ap-proachingR,
. The transition thus appears to have some characteristics of critical phenomena [20]and work is in progress to characterize it quantitatively[19].
The influence of the amplitude of the perturbation on the transition has been studied by adjusting the velocity of the turbulent
jet
that creates the perturbation. This amplitude does not seem to significantly affect thethresh-old
R„but
it does, however, influence the aspect of thetransition: The mean relaxation time increases with the amplitude ofthe perturbation, especially near
R„[19].
When
R
&R„
the turbulent spots first spread very quickly (spreading rate-0.
3h sec')
and saturate to a macroscopic size which depends on the value ofR.
Then, they have a slow spatial and temporal evolution, butoc-cupy the same mean space. Their position and shape
E% LETTERS
26l992
FIG. 2. Evolution ofa turbulent spot after a perturbation; the time interval between photographs is 5sec. (a),(b),(c) R 350; (d),(e),(f) R
=380.
evolve more slowly than the time for fluctuations
of
light reflectance within the turbulent regions. Successive im-ages have been digitized in the(x,
z)plane and a rms cal-culation shows that the maximum light fluctuationscor-respond to the turbulent spot. We have also observed vortical structures in the spanwise
(y, z)
plane[19].
Two types
of
regions (laminar and turbulent) can easi-ly be distinguished from an experimental viewpoint. Tur-bulence is seen to invade the laminar flow by a processof
contamination of the regions adjacent to the spot. The edges of the turbulent patches are usually either curved or straight and inclined to the horizontal. Throughout the turbulent region horizontal streaks can be seen, and these streaks propagate outward from the spot in the vertical (spanwise) direction. The spatiotemporalevolu-tion
of
a spot and the existenceof
traveling waves are displayed in the diagramof
Fig.4.
This diagram is ob-tained by digitizing the image along a vertical line(z)
sit-uated in the middleof
the test section, and plotting the evolution of the intensity along this line as a function of time. The wavelengthof
these waves is-2h
in the streamwise direction and their phase velocity is-2h
sec ' nearR,
.They could play an important role in the propagation of turbulence, particularly in the spanwise direction.As
R
is further increased, the spots can move, grow, split into two spots, or decay and a regime reminiscentof
spatiotemporal intermittency is observed[21].
This re-gime will be characterized elsewhere, but the meanfrac-tion of total space which is turbulent can be defined and it appears to increase with
R (at
R=450,
nearly all the test section is turbulent). NearR
=400,
the turbulence200—
Ile. Ii.dII 100 tp Q I I I 0 l 1 'P 1 t 300 325 350 R 375 400 FIG. 3. Evolution of the relaxation time r ofthe artificially triggered turbulent spots as afunction ofthe Reynolds number R.FIG.4. Spatiotemporal evolution ofa turbulent spot initiat-ed at io. Spatial digitization is made over 512pixels and the to-tal observation time is25sec.
VOLUME 69,NUMBER 17 PH
YSICAL
REVI
EW
LETTERS
26OCTOBER 1992may take a form that is similar to the spots that are ob-served in plane Poiseuille flow
[5]
or in the Blasius boundary layer[22].
They can also form straight in-clined patches across the(x,
z) plane, a shape similar to that ofthe spiral turbulence observed in circular Couette flow[4].
A
PCF
apparatus has been constructed in which we have observed the subcritical transition to turbulence atR
=R„by
perturbing the flow. BelowR„
the laminarstate is stable to finite-amplitude perturbations, and above
R„
the perturbations do not relax and a regime of intermittent turbulence is observed. Although many as-pects are still to be investigated, the transition appears to be a critical phenomenon. After submitting this paper, we became awareof
similar results obtained by Tillmark and Alfredsson[23].
By perturbing aPCF
by different means (air bubble situated at the bottom), they have found a value ofR,
very close to our measurements. They have also noticed the creation of waves at the wing tips of the spots, which appear to be similar to those displayed in Fig. 4. Our experimental results are also in very good agreement with the numerical results obtained by Lundbladh and Johansson[11],
especially for the criti-cal Reynolds numberR,
. However, the existence ofwaves was not predicted by their simulations nor was the intermittent regime which is observed above the thresh-old. Work is currently under progress in this direction.
We wish to thank
B.
Bonetti, G. Balzer, P, Manneville, andY.
Pomeau for stimulating discussions and M. La-bouise, P, Hede, andB.
Ozenda for their technical assis-tance.[1]See, e.g., D.
J.
Tritton, Physical Fluid Dynamics (VanNostrand Reinhold, New York, 1977).
[2] Y. Pomeau, Physica (Amsterdam) 23D, 1 (1986);51D,
546
(1991).
[3]D. Coles,
J.
Fluid Mech. 21,385 (1965). Also see C.W.Van Atta,
J.
Fluid Mech. 25,495(1966).[4]C. D. Andereck, S.
S.
Liu, and H. L.Swinney,J.
Fluid Mech. 164, 155(1986);J.
J.
Hegseth, C.D. Andereck, F. Hayot, and Y.Pomeau, Phys. Rev. Lett.62, 257 (1989). [5]D.R.Carlson, S.E.Widnall, and M. F.Peeters, 3.FluidMech. 121,487 (1982).
[6] See, e.g., P. G. Drazin and W. H. Reid, Hydrodynamic
Stability (Cambridge Univ. Press, Cambridge, 1981). [7]S.A. Orszag and L.Kells,
J.
Fluid Mech. 96, 159(1980). [8]M. Nagata,J.
Fluid Mech. 217, 519(1990),[9]
J.
Lerner and E. Knobloch,J.
Fluid Mech. 189, 117 (1988).[10]B. Dubrulle and
J.
P. Zahn,J.
Fluid Mech. 231, 561(1991).
[11]A. Lundbladh and A. Johansson,
J.
Fluid Mech. 229,499(1991).
[12]H. Reichardt, Z. Angew. Math. Mech. Sonderheft 26,
(1956).
[13]H.
J.
Leutheusser and V. H. Chu,J.
Hydraul. Div. Am. Soc.Civ. Eng.97, 1269(1971).
[14]N. Tillmark and P. H. Alfredsson, Bull. Am. Phys. Soc. 35,2248 (1990).
[15]
J.
M. Robertson and H. F.Johnson,J.
Eng. Mech. Div. Am. Soc.Civ. Eng.96, 1171(1970).[16]M.Aydin and
J.
Leutheusser, Rev. Sci.Instrum. 50, 1362(1979).
[17]
J.
Hegseth, F. Daviaud, and P. Berge, in Ordered and Turbulent Pattern in Taylor-Couette Flow, edited by C.D. Andereck (Plenum, New York, 1991). [18]K.W. Schwarz, Phys. Rev. Lett. 64, 415(1990). [19]F.Daviaud and
J.
Hegseth (tobe published).[20]See, e.g.,
J.
D. Gunton, M. San Miguel, and P.S.Sahni,in Phase Transitions and Critical Phenomena, edited by C. Domb and 3. L. Lebowitz (Academic, New York, 1983),Vol. 8.
[21] F.Daviaud, M. Bonetti, and M. Dubois, Phys. Rev. A42, 3388 (1990).
[22] B.Cantwell, D. Coles, and P. Dimotakis,
J.
Fluid Mech. $7,641 (1978).[23]N. Tillmark and P.H. Alfredsson,
J.
Fluid Mech. 235,89(1992).