LETTERS
A warm layer in Venus’ cryosphere and high-altitude
measurements of HF, HCl, H
2
O and HDO
Jean-Loup Bertaux
1,2,5, Ann-Carine Vandaele
3, Oleg Korablev
4, E. Villard
1,2,5, A. Fedorova
4, D. Fussen
3,
E. Que
´merais
1,2,5, D. Belyaev
4, A. Mahieux
3, F. Montmessin
1,2,5, C. Muller
3, E. Neefs
3, D. Nevejans
3, V. Wilquet
3,
J. P. Dubois
1,2,5, A. Hauchecorne
1,2,5, A. Stepanov
4,6, I. Vinogradov
4, A. Rodin
4,7& the SPICAV/SOIR team*
Venus has thick clouds of H2SO4aerosol particles extending from
altitudes of 40 to 60 km. The 60–100 km region (the mesosphere) is a transition region between the 4 day retrograde superrotation at the top of the thick clouds and the solar–antisolar circulation in the thermosphere (above 100 km), which has upwelling over the subsolar point and transport to the nightside1,2. The mesosphere has a light haze of variable optical thickness, with CO, SO2, HCl,
HF, H2O and HDO as the most important minor gaseous
consti-tuents, but the vertical distribution of the haze and molecules is poorly known because previous descent probes began their mea-surements at or below 60 km. Here we report the detection of an extensive layer of warm air at altitudes 90–120 km on the night side that we interpret as the result of adiabatic heating during air sub-sidence. Such a strong temperature inversion was not expected, because the night side of Venus was otherwise so cold that it was named the ‘cryosphere’ above 100 km. We also measured the mesospheric distributions of HF, HCl, H2O and HDO. HCl is less
abundant than reported 40 years ago3. HDO/H
2O is enhanced by a
factor of 2.5 with respect to the lower atmosphere, and there is a general depletion of H2O around 80–90 km for which we have no
explanation.
The use of solar (at the terminator: the circle on the planet that separates the day side from the night side) and stellar occultation technique (at night), applied for the first time to the atmosphere of Venus with the SPICAV/SOIR spectrometers on board the Venus Express spacecraft, allows us to measure the atmospheric transmis-sion and to derive information about the vertical structure and com-position of the 60–140 km region. In this region, many processes (transport, chemistry, temperature, aerosols condensation and evap-oration) govern the three-dimensional distribution of haze and chemical species. In the ultraviolet range (110–310 nm) of the SPICAV ultraviolet spectrometer (a copy of the SPICAM ultraviolet instrument in orbit around Mars4), the most important absorbers are CO2(the main Venus atmospheric constituent) at l , 200 nm,
and aerosol particles of the haze layer at all wavelengths. The CO2
local density and temperature profiles are derived by assuming that the atmosphere is in hydrostatic equilibrium5 (Supplementary Information).
On Fig. 1 are represented the temperature profiles obtained during six stellar occultations performed on the night side. They are com-pared to previous and scarce measurements6–9. All our new profiles show a large temperature excess (30–70 K) with respect to previous measurements, peaked around 100 km. The altitude range 100– 150 km has largely been unexplored up to now—the upper limit
for infrared soundings and radio occultation is ,100 km, descent probes have so far measured below this range, and drag measure-ments are made above 150 km. Occultation measuremeasure-ments can probe this region efficiently, allowing the discovery of this hot atmospheric layer. Orbits 95, 96 and 98 have similar profiles, while orbits 102, 103 and 104 have the same kind of profiles, but with an even higher maximum temperature. These three orbits are much closer to the anti-solar point (solar zenith angle, SZA 5 167–170u).
We interpret this newly found temperature peak to be caused by adiabatic (or diabatic) heating during air subsidence near the anti-solar point, as the end result of the anti-solar–antianti-solar circulation pattern suspected to exist in the thermosphere (100–200 km) from the day side to the night side. Such heating was not well predicted by current circulation models, although there was evidence of day-to-night transport and downward vertical transport on the night side: the emission of NO ultraviolet delta and gamma bands already observed by Pioneer Venus10,11, and O
2emission at 1.27 mm discovered from
the ground12(also well detected with VIRTIS/VEX13). These emis-sions occur when O and N atoms (produced by solar extreme-ultraviolet photo-dissociation of N2 and CO2 on the day side at
100–120 km) recombine in the night side. However, modelling of NO ultraviolet emission11,14described N and O atoms as being trans-ported vertically downwards through the CO2 background gas by
eddy diffusion (turbulence).
In such a description, the CO2background gas does not move
vertically, and therefore experiences no adiabatic heating. Our observations indicate rather that N and O atoms are advected downwards with the CO2background gas during its descent. Such
a vertical atmospheric motion is an essential ingredient of the solar–antisolar circulation pattern, which may influence the beha-viour of the whole mesosphere, because it implies a compensating upwelling on the day side. The descent velocity may be estimated, given that at temperature T 5 165 K the night-time infrared cooling rate is about 100 K per day (ref. 2). Assuming a T4dependence, it would amount to 377 K per day for a temperature of 230 K as mea-sured here near the anti-solar point. This cooling rate can be com-pensated by an equal adiabatic heating rate, corresponding to a descent velocity V 5 0.43 m s21, using the relation dT/dt 5 2CV where t is time and C is the adiabatic lapse rate (about 10 K km21; ref. 15). The negative temperature gradient in the layer at 100– 120 km is on average equal to 25 K km21for orbit profiles 102 to 104 and locally reaches values near the adiabatic lapse rate. This suggests that the layer at 100–120 km is dynamically nearly unstable and that turbulence may occur, inducing a downward heat flux by
*Lists of participants and affiliations appear at the end of the paper.
1Service d’Ae
´ronomie du CNRS/IPSL, Verrie`res-le-Buisson 91371, France.2Universite
´ Pierre et Marie Curie, 75252, Paris, France.3Belgian Institute for Space Aeronomy, 3 avenue
Circulaire, B-1180 Brussels, Belgium.4Space Research Institute (IKI), 84/32 Profsoyuznaya, 117810 Moscow, Russia.5Institut Pierre Simon Laplace, Universite
´ de Versailles-Saint-Quentin, 78 Saint-Quentin en Yvelines, 78280 Guyancourt , France.6Faculty of Physics, Moscow State University, GSP-2 119992 Moscow, Russia.7Moscow Institute of Physics and
Technology, Institutsky dr. 141700 Dolgoprudny, Russia.
Vol 450|29 November 2007|doi:10.1038/nature05974
646
Nature
mixing of potential temperature and a reinforcement of the peak temperature.
This is the first time that a temperature inversion is so clearly identified at this altitude in the night-side atmosphere of Venus. However, there is a hint of temperature inversion in previous data at their maximum altitude soundings: a 2–4 K increase from 95 to 100 km in infrared spectra8, and a 10 K increase from 90 to 100 km in the radio-occultation profile of Magellan9taken at a SZA of 109u. We note that, in our profiles, the higher (the nearer to the anti-solar point) is the SZA, the higher is the temperature maximum, this trend being confirmed on the low side of the SZA by Magellan (which has an excellent vertical resolution and sampling). Whether our new hot profiles are sporadic and patchy, or are permanent and large-scale features (having escaped detection before) will be clarified by future Venus Express measurements.
Hydrogen-bearing molecules (HCl, HF, H2O and HDO) are
bro-ken by solar ultraviolet in the altitude range 80–120 km, and their abundance in the mesosphere is relevant to the ultimate escape rate of H, and possible evolution of the Venus atmosphere. HCl and HF were discovered in 1967 (ref. 3). More recently, the abundance of HDO (ref. 16) and H2O (ref. 17) above cloud top were found to
experience large time variations (by a factor of 30), even when the measurements were averaged over the whole disk of Venus, with no explanation as yet. Almost nothing is known about the vertical profile of these species, although it is essential for modelling of H escape. A new compact high-spectral-resolution infrared instrument, called Solar Occultation in the InfraRed (SOIR)18 was implemented on Venus Express as an extension of SPICAV, to measure the vertical distribution of hydrogen-bearing species in the range 60–110 km by the technique of solar occultation at terminator (see the Supple-mentary Information). SOIR is a new type of spectrometer, with an echelle spectrometer associated to an acousto-optical tunable filter for wavelength domain selection, measuring the solar spectrum and the atmospheric transmittance (Fig. 2) in the infrared region
80 180 200 220 240 80 100 100 120 140 SZA (º) Ref. 7
Pioneer Venus Night Probe 1978 Ref. 6 Orbit 95 (SZA = 121º) Orbit 96 (SZA = 122º) Orbit 98 (SZA = 124º) Orbit 102 (SZA = 167º) Orbit 103 (SZA = 169º) Orbit 104 (SZA = 170º)
Radio Occ Magellan (SZA = 109º)
160 180 120 140 160 Temperature (K) T emperatur e (K) 180 200 220 240 100 Altitude (km) 120 140
Figure 1|Night-side temperature of Venus atmosphere. The mesopause
may be defined at 90 km of altitude, separating the mesosphere (,90 km) from the lower thermosphere (.90 km). Solid thick curves, obtained by stellar occultations on the night side from Venus Express (this work), are compared to previous measurements. The blue squares were obtained during the descent of the Pioneer Venus night-side probe. The thin solid line shows sub-millimetre observations from a ground-based radio-telescope, Venus disk integrated6. The dashed line shows millimetre observations from
a ground-based radio-telescope, Venus disk integrated7. The thick dotted
line was obtained from a radio-occultation of the Magellan orbiter9, at a SZA
of 109u. This single measurement shows an increase of temperature at altitudes above 85 km, similar to the ones seen in this work, but less pronounced. The SPICAV error bars (1s) are indicated for orbit 95 (green) and are typical of the errors for the other curves. The two groups of measurements were taken at latitude 39u N (local time ,21:00 h, SZA 5 121–124u) for orbits 95, 96, 98 and latitude 4u S (local time ,23:20 h, SZA 5 167–170u) for orbits 103, 103 and104. The orbit is 24 h long. There is a clear pattern for the value of the maximum temperature (90–100 km), increasing with the SZA, as emphasized in the bottom left plot (the point at SZA 5 109u is from Magellan).
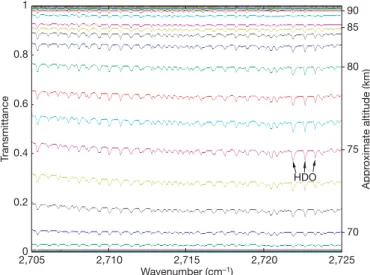
2,705 2,710 2,715 Wavenumber (cm–1) T ransmittance 2,720 2,725 70 0 0.2 0.4 0.6 0.8 1 75 80 85 90 HDO Appr oximate altitude (km)
Figure 2|Typical evolution of atmospheric spectral transmittances through
one solar occultation observed by SOIR spectrometer. It is obtained by
determining the ratio of the solar spectrum seen through the Venus atmosphere to the unattenuated solar spectrum measured above the atmosphere, at high spectral resolution and a 3 to 6 km altitude sampling. At the beginning of the series, the light path does not cross the atmosphere. No absorption signatures are present and transmittances are equal to unity. As the sun sets, the light path goes deeper and deeper into the atmosphere, and two absorption processes take place: the overall signal decreases owing to extinction by aerosols, and gaseous absorption signatures appear. At the end, the light path crosses the cloud layer located at an altitude around 60 km above the Venus surface (at 6,051.5 km radius) and light is no longer transmitted. This solar occultation was collected on 26 November 2006 during a sunset. The selection of a spectral interval is achieved through the acousto-optical tunable filter, tuned in this case to the 2,703.5–2,727.5 cm21spectral range. In
this particular range, the main absorption lines are from HDO (a trio of lines indicated by arrows), and other features are from weak CO2spectral lines.
NATURE|Vol 450|29 November 2007 LETTERS
647 Nature
(2.2–4.3 mm) at a resolution of 0.15 cm21. At present, using it, absorption structures of CO2, H2O, HDO, CO, HCL and HF have
been observed with certainty.
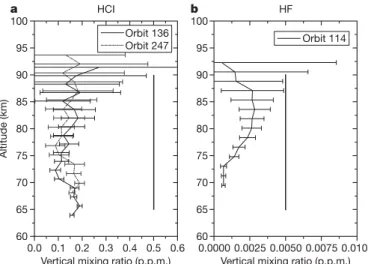
Retrieval of the vertical distribution of the various species is done by comparing the observed transmittance spectra to a full forward model simulation19. Some results of this best-fit exercise are shown in Fig. 3 for HF and HCl. The abundance of HF measured below the clouds20at 0.005 6 0.002 p.p.m. agrees with other measurements21 corresponding to altitudes above 72 km (0.0065 6 0.0003 p.p.m.). Our SOIR-measured values (0.001 to 0.003 p.p.m. at 75–85 km) are significantly lower (by a factor of 3).
At altitudes between 15 and 30 km, lower than those probed by the SOIR instrument, an HCl mixing ratio of 0.5 6 0.15 p.p.m. was obtained in 1989 (ref. 20) while a similar value of 0.6 6 0.12 p.p.m. was found3in 1967 above the clouds (60 km). The abundances of HCl obtained from the SOIR measurements during the occultations of orbits 136 and 247, shown in Fig. 3a, are slightly different from each other (by a factor of ,1.5 at 70–75 km), and are lower than values reported in the literature (factor of 4 to 6): 0.1 6 0.03 p.p.m. for orbit 136 and 0.17 6 0.03 p.p.m. for orbit 247, both at 70–75 km. Current models of photochemistry of the atmosphere of Venus above the clouds22are assuming a value of 1 p.p.m.v. of HCl for this very active component and should be revised accordingly. Another possible explanation of our low values is that the solar occultation probed a high latitude, where thermospheric air depleted in HF and HCl (because of photo-dissociation at high altitude) may be spiralling down the polar vortex, along the descending branch of the Hadley’s cell whose up-leg is at the subsolar point (Y. L. Yung & R. T. Clancy, personal communication).
Figure 4a shows retrievals of H2O and HDO mixing ratios
obtained simultaneously with the acousto-optical tunable filter sequence alternating between the H2O spectral window and the
HDO window, and with a window also dedicated to CO2retrieval.
The three profiles were obtained over 18 days, at a high north latitude (80–75u) terminator. H2O is at 0.3–1 p.p.m.v, an intermediate value
within the very large range of 0.1 to 4 p.p.m.v reported from previous measurements by different techniques16,17at various times. At vari-ance, our three vertical profiles show little time variability in this limited sample. There is a marked depletion of H2O in the range
80–90 km, for which we have no explanation yet, other than noting that this altitude range coincides with the mesospheric minimum temperature and the top of the haze layer. For H2O, there is no abrupt
decreasing at high altitudes (up to 110 km), which would be a sign of local condensation.
The HDO/H2O ratio profiles (Fig. 4b) are quite similar. At the
lower boundary of our measurements (70 km), the HDO/H2O ratio
is ,0.1 with an error bar (1s) exceeding 50%, which encompasses the value of 0.05 measured in the bulk atmosphere at lower alti-tudes20,23–25 (to be compared to the Earth’s value of 1/3,000). Although we could have expected a decrease of this ratio with increasing altitude because of preferential condensation of HDO26, the trend is instead an increase in the HDO/H2O ratio, up to a value
of 0.12, about 2.5 times the bulk atmosphere value. Hence, there is no effective cold trap preventing the photo-dissociation of HDO in the upper atmosphere. The observed bulge of HDO at 90–95 km, above the haze and free from extinction of solar flux, might be due to a lower photo-dissociation rate of HDO (versus H2O), as has been
suggested for Mars from laboratory cross-section measurements27. Alternatively, it could be a sign that H atoms are escaping to outer space faster than D atoms (because of their larger thermal velocity): D atoms left behind in excess will recombine with OH radicals, gen-erating a downward flow of HDO. If this interpretation is correct, it would be the first indication of this expected differential escape of H versus D, acting at present, that could explain the high D/H ratio in the present atmosphere of Venus. However, while the present 3 cm
100 95 90 85 80 Altitude (km) 75 70 65 60 0.0 0.1 0.2 0.3
Vertical mixing ratio (p.p.m.) HCI
Orbit 136
Orbit 247 Orbit 114
0.4 0.5 0.6 0.0000 0.0025 0.0050 Vertical mixing ratio (p.p.m.)
HF a b 0.0075 0.0100 100 95 90 85 80 75 70 65 60
Figure 3|HF and HCl mixing ratio vertical profiles retrieved from SOIR
occultations.The mixing ratios are computed from the density retrievals of
HF and HCl, divided by the CO2density retrieved from CO2absorption
lines. The number of the orbit analysed is indicated on each graph.a, Two HCl profiles are compared, taken at orbit 136 (4 September 2006) and 247 (24 December 2006). They are somewhat different in the range 70–75 km of altitude, and the mixing ratio seems to increase slightly with altitude in both profiles. Error bars are 1s. The amount of HCl is much less than is assumed in the photochemistry models (1 p.p.m.), and less than 0.6 6 0.12 p.p.m. reported above the clouds3, even after revision of this measurement to
0.42 6 0.07 p.p.m. (ref. 28). The vertical bar represents a constant volume mixing ratio of 0.5 p.p.m., as an average of the two derivations3,28from 1967
observations.b, The HF (hydrofluoric acid) volume mixing ratio SOIR profile at orbit 114 (13 August 2006) is somewhat lower by a factor of ,3 than a previous measurement corresponding to altitudes above 72 km (vertical bar). 70 75 80 85 90 95 100 105 110 Altitude (km) Orbit 244 Orbit 251 Orbit 262 Orbit 244 Orbit 251 Orbit 262 75 80 85 90 Altitude (km) 70 95 HDO and H2O b a HDO/H2O 10−1 100 10−2 10−2 0 0.05 0.1 0.15 0.2 0.25
Vertical mixing ratio (p.p.m.) Ratio
Figure 4|HDO and H2O mixing ratio, HDO/ H2O vertical profiles. Both
H2O and HDO were measured simultaneously with SOIR during solar
occultation at orbits 244, 251 and 262 between 70 and 110 km respectively at polar latitudes 185,83,73u (December 2006 to 8 January 2007). Error bars are 1s.a, HDO slant densities were deduced using absorption structures located around 2,722.5 cm21(Fig. 2) and those of H2O from structures in the
3,832.0–3,852.0 cm21spectral interval. After vertical inversion to obtain local densities, they were divided by the CO2density retrieved
simultaneously from CO2absorption lines to get the volume mixing ratios.
The less abundant curves are for HDO (the three curves on the left). The curves of both isotopes show little variability, but there is an unexplained and consistent H2O depletion around 85 km.b, The HDO/H2O ratio vertical
profiles are compared for the three orbits. While this ratio is 1/3,000 in Earth’s sea water, Venus is known to be enriched in HDO by a factor of 150, as a result of preferential escape of the lighter isotope H20,23–25. The value of
this ratio in the bulk lower atmosphere is measured to be 0.05, while SOIR finds a higher ratio in the whole range 70–95 km. The HDO/H2O ratio
increases with altitude, reaching about 0.12 (a factor of 2.5 above the bulk ratio). For a tentative explanation of this deuterium-super-enriched layer, see text.
LETTERS NATURE|Vol 450|29 November 2007
648
Nature
equivalent liquid of water and D/H ratio < 0.025 (enrichment 150) would imply a global quantity of water of only 4.5 m depth in the past compared to Earth’s 2.8-km-deep ocean (if there were no D escape), a significant escape of D atoms could largely increase this lower limit. The observed presence of HDO in the photo-dissociation region indicates that D atoms must be present in the thermosphere, where they might suffer non-thermal escape mechanisms, as well as H atoms. It is therefore important to quantify the non-thermal escape mechanism of H and D atoms.
Received 28 February; accepted 22 May 2007.
1. Dickinson, R. E. & Ridley, E. C. Venus mesosphere and thermosphere temperature structure: II. Day-night variations. Icarus30, 163–178 (1977).
2. Bougher, S. W., Alexander, M. J. & Mayr, H. G. in Venus II (eds Bougher, S. W., Hunten, D. M. & Phillips, R. J.) 259–291 (Univ. Arizona Press, Tucson, 1997). 3. Connes, P., Connes, J., Benedict, W. S. & Kaplan, L. D. Traces of HCl and HF in the
atmosphere of Venus. Astrophys. J.147, 1230–1237 (1967).
4. Bertaux, J.-L. et al. SPICAM on Mars Express: Observing modes and overview of UV spectrometer data and scientific results, J. Geophys. Res.111, E10S90, doi:10.1029/2006JE002690 (2006).
5. Que´merais, E. et al. Stellar occultations observed by SPICAM on Mars Express. J. Geophys. Rev.111, doi:10.1029/2005JE002604 (2006).
6. Clancy, R. T., Sandor, B. J. & Moriarty-Schieven, G. H. Observational definition of the Venus mesopause: vertical structure, diurnal variation, and temporal instability. Icarus161, 1–16 (2003).
7. Lellouch, E., Goldstein, J. J., Rosenqvist, J., Bougher, S. W. & Paubert, G. Global circulation, thermal structure, and carbon monoxide distribution in Venus’s mesosphere in 1991. Icarus110, 315–339 (1994).
8. Zasova, L. V., Moroz, V. I., Linkin, V. M., Khatuntsev, I. V. & Maioriv, B. S. Structure of the Venusian atmosphere from surface up to 100 km. Cosmic Res.44, 364–383 (2006).
9. Jenkins, J. M., Steffes, P. G., Hinson, D. P., Twicken, J. D. & Tyler, G. L. Radio occultation studies of the Venus atmosphere with the Magellan spacecraft, 2. Results from the October 1991 experiments. Icarus110, 79–94 (1994). 10. Stewart, A. I. F., Ge´rard, J. C., Rusch, D. W. & Bougher, S. W. Morphology of the
Venus ultraviolet night airglow. J. Geophys. Res.85, 7861–7870 (1980). 11. Gerard, J. C., Stewart, A. I. F. & Bougher, S. W. The altitude distribution of the
Venus ultra-violet nightglow and implications on Vertical transport. Geophys. Res. Lett.8, 633–636 (1981).
12. Connes, P., Noxon, J. F., Traub, W. A. & Carleton, N. P. O2( 1
D) emission in the day and night airglow of Venus. Astrophys. J.233, L29–L32 (1979).
13. Drossart, P. et al. Venus upper atmospheric emissions from VIRTIS spectral imaging observations. Nature doi:10.1038/nature05xxx (this issue).. 14. Bougher, S. W., Gerard, J. C., Stewart, A. I. F. & Fessen, C. G. The Venus
nitric oxide night airglow—Model calculations based on the Venus Thermospheric General Circulation Model. J. Geophys. Res.95, 6271–6284 (1990).
15. Keating, G. M. et al. VIRA (Venus International Reference Atmosphere) models of Venus neutral upper atmosphere: structure and composition. Adv. Space Res. 5 (11), 117–171 (1985).
16. Sandor, B. J. & Clancy, R. T. Water variations in the Venus mesosphere from microwave spectra. Icarus177, 129–143 (2005).
17. Gurwell, M. A. Melnick, G. J., Tolls, V., Bergin, E. A. & Patten, B. M. SWAS observations of water vapor in the Venus mesosphere. Icarus188, 288–304 (2007).
18. Nevejans, D. et al. Compact high-resolution spaceborne echelle grating spectrometer with acousto-optical tunable filter based order sorting for the infrared domain from 2.2 to 4.3mm. Appl. Opt. 45, 5191–5206 (2006). 19. Vandaele, A. C., Kruglanski, M. & De Mazie`re, M. Simulation and retrieval of
atmospheric spectra using ASIMUT. In ESA Atmospheric Sci. Conf. (Frascati, Italy, 2006) [CD-ROM] 71.1 (ESA SP-628, Noordwijk, 2006).
20. Be´zard, B., De Bergh, C., Crisp, D. & Maillard, J.-P. The deep atmosphere of Venus revealed by high-resolution nightside spectra. Nature345, 508–511 (1990). 21. Bjo¨raker, G. L. et al. Airborne observations of the gas composition of Venus above
the cloud tops: measurements of H2O, HDO, HF and the D/H and18O/16O
isotopic ratios. Bull. Am. Astron. Soc.24, 995 (1992).
22. Yung, Y. L. & DeMore, W. B. Photochemistry of the stratosphere of Venus: Implications for atmospheric evolution. Icarus51, 199–247 (1982).
23. Donahue, T. M., Hoffman, J. H., Hodges, R. R. & Watson, A. J. Venus was wet— a measurement of the ratio of deuterium to hydrogen. Science216, 630–633 (1982).
24. Donahue, T. M., Grinspoon, D. H., Hartle, R. E. & Hodges, R. R. in Venus II (eds Bougher, S. W., Hunten, D. M. & Phillips, R. J.) 385–414 (Univ. Arizona Press, Tucson, 1997).
25. De Bergh, C. et al. Deuterium on Venus: observations from Earth. Science251, 547–549 (1991).
26. Bertaux, J. L. & Montmessin, F. Isotopic fractionation through water vapor condensation: the deuteropause, a cold trap for deuterium in the atmosphere of Mars. J. Geophys. Res. Planets106, 32879–32884 (2001).
27. Cheng, B.-M. et al. Photo-induced fractionation of water isotopomers in the martian atmosphere. Geophys. Res. Lett.26, 3657–3660 (1999).
28. Young, L. D. G. High resolution spectra of Venus-A review. Icarus17, 632–658 (1972).
Supplementary Information is linked to the online version of the paper at www.nature.com/nature.
Acknowledgements Venus Express is a space mission from the European Space Agency (ESA). We wish to thank all ESA members who participated in this successful mission, and in particular H. Svedhem, D. McCoy, O. Witasse, A. Accomazzo and J. Louet. We also thank Astrium for the design and construction of the spacecraft, and in particular A. Clochet, responsible for the payload. We thank D. Hinson for communication of the Magellan radio-occultation atmospheric profile, and Y. Yung and T. Clancy for discussions. We thank our collaborators at
Service d’Ae´ronomie/France, BIRA/Belgium and IKI/Moscow for the design and
fabrication of the instrument. We thank CNRS and CNES for financing SPICAV/ SOIR in France, the Belgian government, Roskosmos and the Russian Academy of Sciences. The Russian team acknowledges support from the Russian Foundation for Basic Research, and from the Russian Science Support Foundation. Author Information Reprints and permissions information is available at www.nature.com/reprints. The authors declare no competing financial interests. Correspondence and requests for materials should be addressed to J.-L.B. ([email protected]).
*The SPICAV/SOIR team Jean-Loup Bertaux1
, D. Nevejans2 , Oleg Korablev3 , F. Montmessin1 , Ann-Carine Vandaele2 , A. Fedorova3 , M. Cabane1 , E. Chassefie`re1 , J. Y. Chaufray1 , E. Dimarellis1 , J. P. Dubois1 , A. Hauchecorne1 , F. Leblanc1 , F. Lefe`vre1 , P. Rannou1 , E. Que´merais1 , E. Villard1 , D. Fussen2 , C. Muller2 , E. Neefs2 , E. Van Ransbeeck2 , V. Wilquet2 , A. Rodin3 , A. Stepanov3 , I. Vinogradov3 , L. Zasova3 , F. Forget4 , S. Lebonnois4 , D. Titov5 , S. Rafkin6 , G. Durry7 , J. C. Ge´rard8 & B. Sandel9 1Service d’Ae
´ronomie du CNRS/IPSL, Verrie`res-le-Buisson 91371, France.2Belgian
Institute for Space Aeronomy, 3 avenue Circulaire, B-1180 Brussels, Belgium.3Space
Research Institute (IKI), 84/32 Profsoyuznaya, 117810 Moscow, Russia.4Laboratoire de Me´te´orologie Dynamique, 4 place Jussieu, 75252 Paris cedex 05, France.
5Max-Planck-Institut fu¨r Sonnensystemforschung Max-Planck-Strasse 2, D-37191
Katlenburg-Lindau, Germany.6Southwest Research Institute, Department of
Geophysics, Astrophysics and Planetary Science, 1050 Walnut Avenue, Suite 400, Boulder, Colorado 80302-5143, USA.7Groupe de Spectrome
´trie Mole´culaire et Atmosphe´rique, Universite´ de Reims, Champagne-Ardennes B.P. 1039, 51687 Reims cedex, France.8Universite
´ de Lie`ge, Institut d’Astrophysique et Geophysique—B5c, Alle´e du 6 Aout, 17 Sart Tilman, B-4000 Liege, Belgium.9Lunar and Planetary Laboratory,
University of Arizona, 1541 E. University Boulevard, Tucson, Arizona 85721, USA.
NATURE|Vol 450|29 November 2007 LETTERS
649 Nature
![[PDF] Cours de formation Word Premier niveau pdf | Cours informatique](data:image/gif;base64,R0lGODlhAQABAIAAAP///wAAACH5BAEAAAAALAAAAAABAAEAAAICRAEAOw==)