Youth Migration in Quebec: Survey results obtained from Anglophones 20 to 34 years of age
160
0
0
Texte intégral
(2)
(3) Youth Migration in Quebec. Survey results obtained from Anglophones 20 to 34 years of age Marie-Odile MAGNAN, Madeleine GAUTHIER and Serge CÔTÉ. in collaboration with Claire Boily, Canisius Kamanzi and Normand Croteau. Translated from French by Rod Wilmot. Document produced within the framework of activities of the Groupe de recherche sur la migration des jeunes. Institut national de la recherche scientifique Urbanisation, Culture et Société. November 2007.
(4) Scientifique responsibility: Madeleine Gauthier madeleine.gauthier@ucs.inrs.ca Observatoire Jeunes et Société Institut national de la recherche scientifique Urbanisation, Culture et Société www.obsjeunes.qc.ca. Distribution: Institut national de la recherche scientifique Urbanisation, Culture et Société 385, rue Sherbrooke Est Montréal (Québec) H2X 1E3. Phone: (514) 499-4000 Fax: (514) 499-4065 www.ucs.inrs.ca. This document is a translation of: Magnan, Marie-Odile, Madeleine Gauthier et Serge Côté,. La migration des jeunes au Québec : résultats d’un sondage auprès des anglophones de 20-34 ans, Québec, INRS Urbanisation, Culture et Société, mars 2006, xv, 149 p.. ISBN 978-2-89575-131-1 Legal Deposit:- Bibliothèque et Archives nationales du Québec, 2007 - Library and Archives Canada, 2007 © All rights reserved.
(5) Youth Migration in Quebec. iii. Authors Marie-Odile Magnan, Student Université Laval and stagiaire with the INRS Urbanisation, Culture et Société Madeleine Gauthier, Professor INRS Urbanisation, Culture et Société Serge Côté, Professor Université du Québec à Rimouski. This study is part of the activities of the Groupe de recherche sur la migration des jeunes under the coordination of Patrice LeBlanc and the Alliance de recherche universités/communauté : Insertion et participation des jeunes en région under the direction of Madeleine Gauthier.. Members Serge Côté Frédéric Deschenaux Lucie Fréchette Madeleine Gauthier Camil Girard Claude Laflamme Patrice LeBlanc Marie Lequin Marc Molgat Jean-Louis Paré Lucie Piché Martin Simard Myriam Simard Derek Wilkinson. Université du Québec à Rimouski Université du Québec à Rimouski Université du Québec à Hull INRS Urbanisation, Culture et Société Université du Québec à Chicoutimi Université de Sherbrooke Université du Québec en Abitibi-Témiscamingue Université du Québec à Trois-Rivières Université d’Ottawa Université du Québec à Trois-Rivières Cégep de Sainte-Foy Université du Québec à Chicoutimi INRS Urbanisation, Culture et Société Université Laurentienne. and a research partnership including 26 organizations..
(6) iv. Youth Migration in Quebec. Collaborators Claire Boily, Researcher INRS Urbanisation, Culture et Société Canisius Kamanzi, Researcher INRS Urbanisation, Culture et Société Normand Croteau, Researcher Université du Québec en Abitibi-Témiscamingue. Financed by:. Alliance de recherche universités/communautés, programme de recherche du Conseil de recherche en sciences humaines du Canada Canadian Heritage Community Table of the National Human Resources Development Committee for the English Linguistic Minority. Translation/proofing financed by: Community Table of the National Human Resources Development Committee for the English Linguistic Minority Public Works and Government Services Canada.
(7) Youth Migration in Quebec. v. TABLE OF CONTENTS A FEW HIGHLIGHTS ..................................................................................................................... IX INTRODUCTION ............................................................................................................................. 1 1. PARAMETERS OF THE STUDY ............................................................................................ 5 1.1 Sample Formation ........................................................................................................... 7 1.2 General Characteristics of Respondents......................................................................... 9 1.3 Migration Profile of Respondents .................................................................................. 12. 2. CHARACTERISTICS OF ANGLOPHONE RESPONDENTS ............................................... 17 2.1 General Characteristics of Respondents....................................................................... 17 2.2 Migration Profile of Respondents .................................................................................. 18 2.3 Migration Profile of Respondents by Sociodemographic and Identity Characteristics............................................................................................................... 22. 3. MIGRATION OF YOUNG ANGLOPHONES......................................................................... 27 3.1 Why Leave?................................................................................................................... 27 3.2 The First Migration......................................................................................................... 29 3.3 Leaving, to Return Better? ............................................................................................ 34 3.4 Why Stay? ..................................................................................................................... 39 3.5 Incoming Interprovincial and International Migrants...................................................... 42 3.6 Reasons for Migrating Out of the Province ................................................................... 47. 4. CURRENT PERCEPTION OF THE PLACE OF ORIGIN ..................................................... 57 4.1 Attachment to the Place of Origin.................................................................................. 57 4.2 Perceptions of the Place of Origin................................................................................. 59. 5. PERCEPTION OF THE CURRENT PLACE OF RESIDENCE AND POTENTIAL MOBILITY.............................................................................................................................. 65 5.1 Stability and Potential Mobility....................................................................................... 65 5.2 Social Situation in the Current Place of Residence....................................................... 69 5.3 Residential Future ......................................................................................................... 73. 6. MIGRATION OF YOUNG ADULTS AND EMPLOYMENT ................................................... 77 6.1 Current Employment ..................................................................................................... 77 6.2 Employment, Education and Area of Origin .................................................................. 81. CONCLUSION............................................................................................................................... 87 BIBLIOGRAPHY ............................................................................................................................ 89 METHODOLOGICAL APPENDIX ................................................................................................. 91 QUESTIONNAIRE ......................................................................................................................... 97.
(8) vi. Youth Migration in Quebec. List of Tables Table 1 - Number of respondents per oversampled administrative region ................................... 8 Table 2 - Respondents whose sampling region corresponds with their region* of origin (as a % and in descending order, non-weighted data) ................................................................... 9 Table 3 - Highest level of education completed .......................................................................... 10 Table 4 - Occupation of respondents during the previous year .................................................. 10 Table 5 - Gross income of respondents for the year 2003.......................................................... 11 Table 6 - Number of children of respondents .............................................................................. 11 Table 7 - Mother tongue of respondents ..................................................................................... 12 Table 8 - Attachment to an Aboriginal community....................................................................... 12 Table 9 - Migration profile of respondents................................................................................... 13 Table 10 - Migration profile of respondents, including interprovincial and international migrants ............................................................................................................................... 15 Table 11 - Migration profile of respondents................................................................................. 20 Table 12 - Migration profile by gender (as a %) .......................................................................... 22 Table 13 - Migration profile by age (as a %) ............................................................................... 23 Table 14 - Migration profile by highest level of education completed (as a %)........................... 24 Table 15 - Migration profile by sense of identity (as a %) ........................................................... 25 Table 16 - Reasons for leaving the place of origin (as a %) ....................................................... 27 Table 17 - Statements related to leaving the place of origin (as a %) (total of answers “very much” and “somewhat”)....................................................................................................... 28 Table 18 - Reasons for leaving the place of origin, by region (as a %)....................................... 29 Table 19 - Choice of place for the first migration, by gender (as a %) ........................................ 30 Table 20 - Source of help received for relocating to the first place settled in, by reason for migration (as a %)................................................................................................................ 31 Table 21 - Main source of income at the first place settled in, by age on leaving the family home (as a %)...................................................................................................................... 32 Table 22 - Financial situation at the first place settled in, by age on leaving the family home (as a %)................................................................................................................................ 32 Table 23 - Young adults who, for the first migration, migrated at the same time as others from their region, by reason for migration and persons accompanying (as a %)................ 33 Table 24 - Migrants living alone or with others at the first place settled in, by age on leaving the family home (as a %) ..................................................................................................... 34 Table 25 - Potential return to place of origin, by migration profile (as a %) ................................ 35 Table 26 - Reasons for a potential return to the place of origin, by age (as a %)....................... 36 Table 27 - Reasons for a potential return to the place of origin, by gender (as a %).................. 36 Table 28 - Reasons for returning to the region of origin, by migration profile (as a %)............... 37 Table 29 - Reasons for returning to the region of origin, by age (as a %) .................................. 38 Table 30 - Reasons for returning to the region of origin, by region (as a %) .............................. 38 Table 31 - Age of non-migrants 1 and 2, by gender (as a %) ..................................................... 39 Table 32 - Level of education of non-migrants 1 and 2, by gender (as a %) .............................. 40 Table 33 - Main occupation over the previous year for non-migrant types 1 and 2, by gender (as a %)................................................................................................................................ 40 Table 34 - Reasons for staying in the town of origin, by age (as a %)........................................ 41 Table 35 - Reasons for staying in the town of origin, by region (as a %).................................... 41.
(9) Youth Migration in Quebec. vii. Table 36 - Age of incoming migrants by gender (as a %) ........................................................... 43 Table 37 - Level of education by migration profile (as a %) ........................................................ 44 Table 38 - Labour force status by migration profile (as a %) ...................................................... 45 Table 39 - Age of incoming migrants when they moved to their current municipality of residence, by migration profile (as a %) .............................................................................. 45 Table 40 - Status of the current place of residence, by age (as a %) ......................................... 46 Table 41 - Reasons explaining a potential departure from Quebec, by migration profile (as a %)......................................................................................................................................... 47 Table 42 - Migration out of Quebec for a period greater than six months, by highest level of education completed (as a %) ............................................................................................. 48 Table 43 - Migration out of Quebec for a period greater than six months, by age (as a %) ....... 48 Table 44 - Reasons for leaving Quebec for a period greater than six months (as a %) ............. 49 Table 45 - Reasons for leaving Quebec for a period greater than six months, by region (as a %)......................................................................................................................................... 50 Table 46 - Reasons for leaving Quebec for a period greater than six months, by age (as a %) 51 Table 47 - Desire to leave Quebec for a period greater than six months, by identity (as a %)... 52 Table 48 - Reasons for a future departure from Quebec for a period greater than six months (as a %)................................................................................................................................ 53 Table 49 - Reasons for a future departure from Quebec for a period greater than six months, by age (as a %).................................................................................................................... 54 Table 50 - Meeting with people who once lived in the same place of origin and now live in the same place as the respondents, by migration profile (as a %)...................................... 57 Table 51 - Visits per year to parents or friends in the place of origin, by gender (as a %) ......... 58 Table 52 - Interest in the future of the place of origin, by migration profile (as a %)................... 59 Table 53 - Interest in the future of the place of origin, by age (as a %) ...................................... 59 Table 54 - Perception of the economic situation in the place of origin, by migration profile (total of “completely agree” and “somewhat agree” answers) (as a %)............................... 60 Table 55 - Perception of services offered in the place of origin, by gender (total of “completely agree” and “somewhat agree” answers) (as a %)............................................ 61 Table 56 - Perception of services offered in the place of origin, by migration profile (total of “completely agree” and “somewhat agree” answers) (as a %)............................................ 62 Table 57 - Perception of the social environment in the place of origin, by age (total of “completely agree” and “somewhat agree” answers) (as a %)............................................ 63 Table 58 - Identification with places, by migration profile (total of “a lot” and “somewhat” answers) (as a %) ................................................................................................................ 65 Table 59 - Aspect considered most important in the current municipality of residence, by region (as a %)..................................................................................................................... 66 Table 60 - Reasons for settling in the current place of residence (as a %)................................. 67 Table 61 - Status of the current place of residence, by migration profile (as a %) ..................... 68 Table 62 - Status of the current place of residence, by age (as a %) ......................................... 69 Table 63 - Social relations by age (as a %) (total of “very frequently” and “frequently enough” answers) .............................................................................................................................. 70 Table 64 - Active contribution to carrying out projects, by gender (as a %)................................ 71 Table 65 - Active contribution to carrying out projects, by migration profile (as a %) ................. 72 Table 66 - Participation in various activities on arriving in the current place of residence, by migration profile (as a %)..................................................................................................... 73 Table 67 - Importance attached to statements concerning large cities, by gender (as a %) (total of “completely agree” and “somewhat agree” answers) ............................................. 73.
(10) viii. Youth Migration in Quebec. Table 68 - Importance attached to statements about large cities, by age (as a %) (total of “completely agree” and “somewhat agree” answers) .......................................................... 74 Table 69 - Importance attached to statements concerning the regions, by migration profile (as a %) (total of “completely agree” and “somewhat agree” answers)............................... 75 Table 70 - Potential place to move, by gender (as a %) ............................................................. 75 Table 71 - Potential place to move, by migration profile (as a %)............................................... 76 Table 72 - Importance attached to statements regarding vocational future, by gender (as a %) (total of “completely agree” and “somewhat agree” answers)........................................ 77 Table 73 - Statement considered most important concerning employment, by gender (as a %)......................................................................................................................................... 78 Table 74 - Statement considered most important concerning employment, by region (as a %) 78 Table 75 - Importance attached to statements concerning work experience, by age (as a %) (total of “completely agree” and “somewhat agree” answers) ............................................. 80 Table 76 - Opinions about employment in the place of origin, by migration profile (as a %) (total of “completely agree” and “somewhat agree” answers) ............................................. 82 Table 77 - Opinions concerning education and place of origin, by migration profile (as a %) (total of “completely agree” and “somewhat agree” answers) ............................................. 83 Table 78 - Opinions concerning education and place of origin, by region (as a %) (total of “completely agree” and “somewhat agree” answers) .......................................................... 83 Table 79 - Factors in vocational success, by migration profile (as a %) (total of “completely agree” and “somewhat agree” answers).............................................................................. 84 Table 80 - Evaluation of French linguistic abilities, by region (as a %) (total of “very well” and “rather well” answers) .......................................................................................................... 85 Table 81 - Evaluation of French linguistic abilities, by age (as a %) (total of “very well” and “rather well” answers) .......................................................................................................... 85.
(11) Youth Migration in Quebec. ix. A Few Highlights Goals of the Study This study aims to update what is known about the geographic mobility of young people in Quebec. Its purpose is to observe the principal dimensions of the migratory phenomenon, based on the paths young people have taken and how they perceive their place of origin and current place of residence. The themes of migration and employment are also explored. In order to include all young Quebecers aged 20 to 34, a section on the migration of young Anglophones was added to the survey. This section of the study specifically concerns young Anglophones aged 20 to 34 living in Quebec at the time of the survey, that is, those who have never left the province (69.3%), those who have returned to Quebec after living elsewhere (8%) and those from other provinces or other countries who have chosen to settle in Quebec (21.5%). The survey thus covered young Anglophones who lived in Quebec at the time of the survey.. Method With this study, the Groupe de recherche sur la migration des jeunes (GRMJ) [research group on youth migration] has renewed the 1998-1999 survey, which was constructed methodically out of 103 qualitative interviews. The team used the “grounded theory” approach. In 2004-2005, new questions were added to the questionnaire so as to take into account specific elements related to the migration of young Anglophones. The selection of Anglophone respondents was determined by the following criterion: English is the language most often spoken at home.. 1. Parameters of the Study The telephone survey was conducted from spring 2004 to winter 2005, with the use of a questionnaire administered by Léger Marketing, in close collaboration with the professors of the GRMJ. 1,237 Anglophone respondents form the study sample of the present analysis; these cases were drawn from a national sample plus an Anglophone oversample, and are divided as follows: 33.1% selected from the Montreal area, 66.9% from the rest of Quebec.. 2. General Characteristics of Anglophone Respondents The sample is composed of 53.2% males and 46.8% females. Over a third of the respondents were aged 20 to 24, 31% were aged 25-29 and 32.4%, 30-34..
(12) x. Youth Migration in Quebec. Graduation rates among young respondents were found to be 38.8% university level, 35.9% college level and 24% high school level. 53.3% of those questioned were mostly working during the previous year, 86.9% of them full time and 13.1% part time. The median gross annual income of young adult Anglophones is situated between $15,000 and $19,999. 60% of those in the sample were born in Quebec, 12% in another province of Canada and 27.9% elsewhere. In 58.3% of the cases, the language most often used outside the home is English. About 40% of the respondents have an English primary school education, while for high school the proportion is 42.7%, for college, 64.7%, and for university, 68.2%. The vast majority of the respondents (80% and more) state that they read, understand and speak French very well or rather well; a smaller proportion (66.9%) consider themselves able to write French very well or rather well. 41.3% of those questioned consider themselves to be as much a member of the Francophone community as of the Anglophone community. The migration profile of respondents is divided into five broad categories: - The non-migrant, who is either still living at the family home or has never moved from the town where he or she grew up: 49.6% of the Anglophone respondents fall into this category. - The intraregional migrant, who has moved to another municipality within the region of origin: this is the case with 2.8% of those interviewed. - The interregional migrant, who has settled in a municipality in a region of Quebec other than the one where he or she grew up (though he or she may have migrated to another province or country before doing so): such migrants account for 24.9% of those interviewed, including 9.6% who have returned to their region of origin, whether in the same municipality or elsewhere in their region of origin; into this category, we notice that 25.2% of the respondents left Quebec but subsequently returned; thus, 8% of the total sample left Quebec, to return later on. - The interprovincial migrant, who has migrated either from another province of Canada to live in Quebec (8.8%) or from Quebec to live elsewhere in Canada (0.9%). - The international migrant, who has migrated either from another country to live in Quebec (12.7%) or from Quebec to live elsewhere in the world (0.4%). Women display greater geographical mobility than men, being less likely to remain with their parents. However, we find more young males among international migrants who come to Quebec..
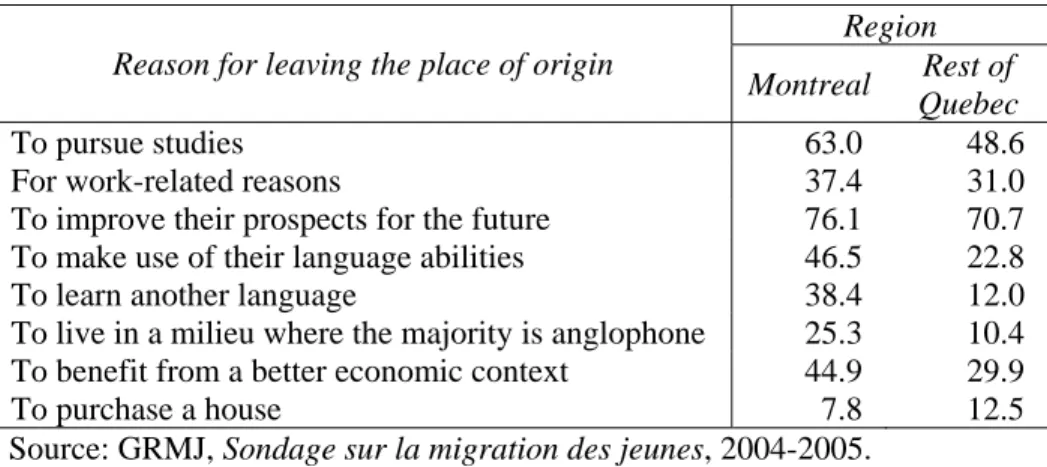
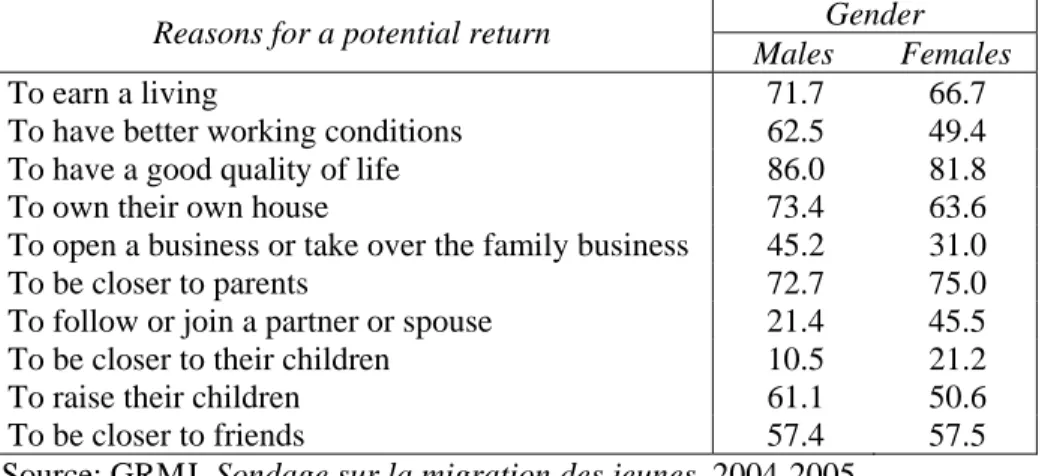
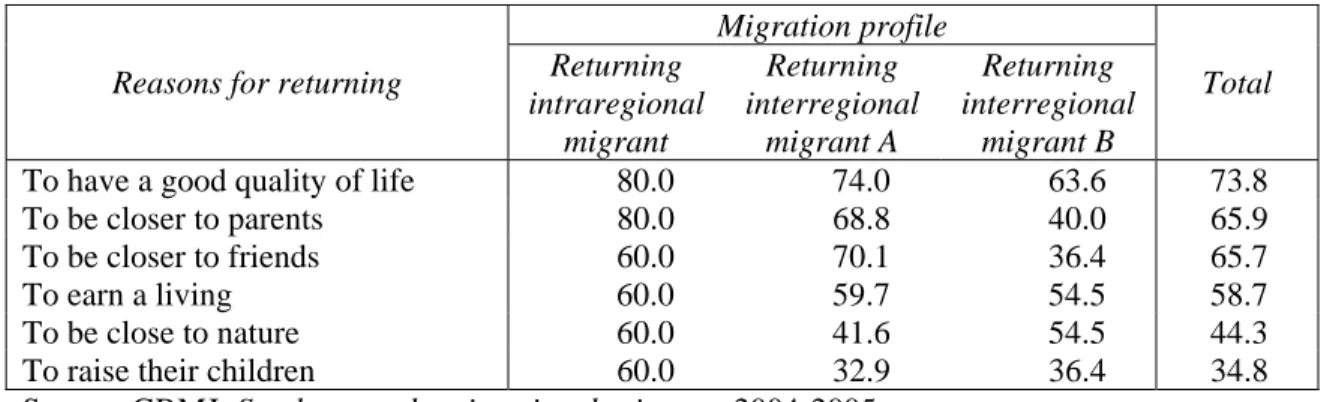
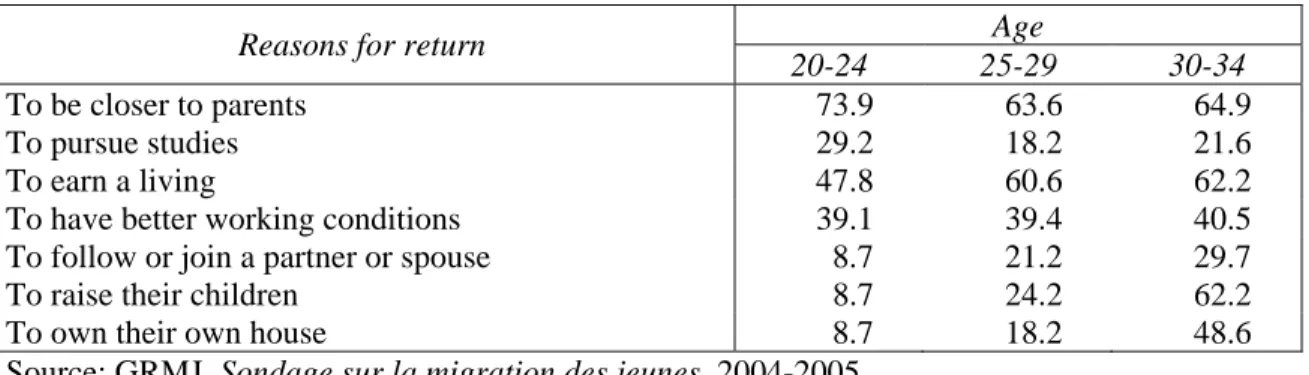
(13) Youth Migration in Quebec. xi. Migration increases with age. The majority of those aged 20-24 live with their parents, while a greater proportion of those aged 25-29 and 30-34 have left their parents to live either in their town of origin or in another region, province or country. As has been observed in other industrialized countries, a high level of education increases the geographical mobility of young Anglophones. Levels of interprovincial and international migration are higher among university graduates.. 3. Migration of Young Anglophones The average age of young Anglophones when they leave their place of origin is 21.4 years. The principal reasons for departure are as follows: to live life on their own (75.7%), to improve their prospects for the future (73.7%) and to have a good quality of life (69.2%). Reasons related to the economy and employment are cited less often. Few respondents state that they left their place of origin because their linguistic abilities were not recognized as an asset (9.1%) or were not enough to get them a good job (10.1%). Over half of the respondents (54.7%) would return to live in their place of origin if conditions would allow them. This proportion rises to 58.9% and 55.5% for incoming interprovincial and international migrants. Their coming to Quebec might merely be one step in their migratory journey, rather than a permanent settlement. Interprovincial migrants to Quebec who plan on returning to their place of origin generally would do so for economic reasons, whereas international migrants to Quebec would usually do so for reasons related to their social network. Young Anglophones who have returned to their place of origin explain their choice as follows: to have a good quality of life (73.8%), to be closer to their parents (65.9%) and to be closer to their friends (65.7%). Nearly half (49.6%) of those questioned have never left their municipality of origin. The main reason for staying in their place of origin is the quality of life (81.7%), followed closely by the desire to live near family and friends (78.7%) and the opportunity to work there (64.8%). Migrants from outside Quebec are concentrated in the Montreal region (80.3%). They have the following characteristics: - Interprovincial and international migrants to Quebec were born primarily in other Canadian provinces or in another country. - 65.9% of the interprovincial migrants to Quebec have English as their mother tongue, while 86.9% of the incoming international migrants have a mother tongue other than French and English. - Interprovincial migrants mainly identify with the Anglophone community (57.8%) and international migrants with another community (30%). - Interprovincial and international migrants to Quebec are the most educated among those surveyed..
(14) xii. Youth Migration in Quebec. - International migrants with a university degree are concentrated primarily in the field of applied sciences (43.3%), and interprovincial migrants, in the arts (25.5%). - 46.1% of the migrants to Quebec were mostly working during the previous year. - 37.1% of the incoming interprovincial migrants and 27.6% of the incoming international migrants intend to live outside Quebec for a period greater than six months, primarily for economic reasons. Of the 8% of the young Anglophones mentioned earlier who returned to live in Quebec after living elsewhere, some 5.2% state that they did so for a period greater than six months. The principal destination was the rest of Canada. Some 4 out of 10 returning migrants expect to leave Quebec again for a prolonged period. Of these young Anglophones who have left Quebec and returned, many have a university degree (50.8%). Migration out of Quebec increases with age, and fewer young Anglophones from the Montreal area than from the rest of the province have left Quebec. The principal reasons for having left Quebec are as follows: to improve their prospects for the future (75%), to experience adventure (65.6%) and work-related reasons (56.3%). Only about 18% of the respondents mention the political situation and language laws. Among young Anglophones who have never left Quebec, 29.4% expect to live outside Quebec for a period greater than six months, this being the case with more males than females (61.3% versus 38.7%). The desire to leave Quebec decreases with age, but increases with the level of education. Proportionally speaking, young Anglophones from Montreal think about moving out of Quebec more than the young people from the rest of the province (66.2% versus 33.8%). A higher proportion of those who identify solely with the Anglophone community state that they would like to move elsewhere in Canada (41.7%). The primary motives for a potential migration out of Quebec are the following: to improve their prospects for the future (84.8%), for work-related reasons (76.4%) and to experience adventure (69.7%). The political situation and language laws in Quebec account for a smaller proportion (about 30%).. 4. Current Perception of the Place of Origin Very often or quite often (42.7%), young Anglophones meet people who once lived in their place of origin and who were living in the same place as they were at the time of the survey. About 40% of the respondents return to visit parents and/or friends in their place of origin at least once every two months. Intraregional and interregional migrants are more likely to visit their parents and/or friends in their place of origin than incoming interprovincial and international migrants..
(15) Youth Migration in Quebec. xiii. Nearly 90% of the young Anglophones interviewed are very interested or somewhat interested in the future of their place of origin. Incoming interprovincial and international migrants display greater interest in their place of origin (92%) than intraregional and interregional migrants. Young Anglophones generally have a positive opinion of the economic situation in their place of origin; two thirds of the respondents do not agree with the statement “there is no job for me in my place of origin.” Interregional migrants have the most pessimistic view of the economy of their place of origin. With regard to local government, half of those questioned (54.2%) are of the opinion that decision-makers in their place of origin do not move quickly enough. Some 42.3% agree with the statement “health care services are deficient in my place of originand its surroundings.” Those who are the least satisfied with the services offered in their place of origin are incoming international migrants, while the most satisfied are incoming interprovincial migrants.. 5. Perception of the Current Place of Residence and Potential Mobility Most young Anglophones identify with Canada as a whole (82.5%) and see themselves as citizens of the world (78.4%), while 66.8% identify with their town of origin and 67.1% with Quebec as a whole. In Montreal, attachment to Canada (84%) and to the world (80%) predominates, while the rest of the province identifies mostly with Quebec (73.5%). The elements young adults consider most important about where they currently live are the quality and price of housing (20%), the social environment (18.8%) and accessibility to transportation (18.7%). The principal reasons for settling in their current place of residence are to have a good quality of life (73.9%), to live life on their own (64.4%) and to improve their prospects for the future (61.1%). 55.5% of the young Anglophones consider their current place of residence to be temporary. The more their migratory space expands, the more this tends to be the case. Thus, 42.9% of those who have never left their region of origin see their current place of residence as temporary, while for those who have come from another country, the proportion rises to 64.9%. 88.2% of the respondents are very or somewhat interested in the future of the region where they live at present..
(16) xiv. Youth Migration in Quebec. Regarding social relations in their current place of residence, 88.1% of the young Anglophones very often or quite often meet with friends where they live at present, 37.1% are involved in organizations and 48.3% take on responsibilities in their local milieu. The principal areas in which young Anglophones have actively contributed to carrying out projects are the social area (52.9%), leisure (52.6%) and culture (43.6%). Those who have contributed most to carrying out projects in the cultural area are incoming interprovincial migrants (52.9%).. 6. Migration of Young Adults and Employment Over 77% of the young Anglophones are in agreement with the following statements: I am confident I will always have a job (78%) and I will easily find work in my field of studies (77.1%). When asked what matters most to them with regard to work, most say they would like to have an interesting job (62.5%), while 22.8% would rather have a stable job, and 14.7%, one that pays well. Most have a positive view of their school-to-work transition: 82.9% currently have working conditions they are satisfied with, 69% have been able to find work they liked since their first jobs, and 62.3% have found work related to their field of study. Nonetheless, 42.1% of the young Anglophones believe that the current scarcity of available jobs hurts their chances of finding a job that meets their aspirations. Interregional migrants have the most positive perception of their work experience, while international migrants to Quebec have the most negative perception of their entry into the workforce. 85% of the young Anglophones believe that pursuing their education will open doors for them in the job market; 83.6% agree with the statement that their linguistic abilities in English will allow them to succeed in the Quebec job market, while a slightly lower proportion believes this to be so concerning their linguistic abilities in French (80.9%). 53.2% believe that it would be easier to find employment in another province of Canada, this proportion being higher in the Montreal area than in the rest of Quebec.. Conclusion Conducted 10 years after the last study of the migratory intentions of young adult Anglophones, the Anglophone section of the GRMJ survey provides new data: - Among young Anglophones who have never left Quebec, 29.4% expect to leave the province for a period greater than six months. - A high proportion of respondents (49.6%) have never left their place of origin..
(17) Youth Migration in Quebec. -. xv. Leaving Quebec does not always constitute a permanent migratory choice, since 8% of the sample returned after previously leaving the province. The principal motives for staying in the town of origin are quality of life (81.7%) and the desire to live near family and friends (78.7%). The principal motives for future migration outside the province are to improve prospects for the future (84.8%) and work-related reasons (76.4%)..
(18)
(19) Youth Migration in Quebec. 1. Introduction In 1998-1999, the Groupe de recherche sur la migration des jeunes (GRMJ) [research group on youth migration] 1 conducted a survey aimed at questioning the decrease in the demographic weight of young adults, a decrease accentuated by the departure of young adults from the regions and rural areas. In response to the alarmist report of those in charge of regional development, the team discovered that 30% of Quebecers aged 20 to 34 return to their region of origin after leaving it for the first time (Gauthier, Molgat and Côté, 2001). Five years later, the GRMJ repeated its investigation in order to follow the evolution of these trends. This time, the research team sought to include all young Quebecers aged 20 to 34. With this in mind, a section on the migration of young Anglophones was added. The questionnaire was translated into English and an oversample of young Anglophones was selected, using the following criterion: English is the language most often spoken at home by the respondents. 2 However, before conducting this segment of the study, the research team took the step of reviewing the literature on the migration of young Anglophones (Magnan, 2004). From this inventory emerged the following observation: in the last 10 years, no researcher had looked into the issue despite the fact that it constitutes a major preoccupation for the Anglophone community of Quebec (QCGN, 2002). For indeed, the proportion of young adults in English Quebec is diminishing significantly, a demographic decrease explained in large part by the departure of young people for other provinces of Canada or other countries. The last studies on the migration of young Anglophones, those of Locher (1994) and Amit-Talai (1993), focus on the migratory intentions of high school and college students. Locher (1994) indicates that the desire of young Anglophones to leave the province is due primarily to political factors such as Bill 101, while Amit-Talai (1993) shows that it is more a matter of pursuing studies and subsequently seeking employment. After reviewing the prior work and consulting members of the Anglophone community of Quebec, the GRMJ arrived at the following question: in 2004-2005, what are the structuring elements of this phenomenon? The 1998-1999 questionnaire was modified to account for this new research problem. A comparative approach that had never been used 1. The GRMJ is composed of Professors Serge Côté and Frédéric Deschenaux of UQAR, Lucie Fréchette of UQO, Claire Boily (research officer), Madeleine Gauthier and Myriam Simard of INRS Urbanisation Culture et Société, Camil Girard and Martin Simard of UQAC, Claude Laflamme of the Université de Sherbrooke, Patrice LeBlanc of UQAT, Marie Lequin and Jean-Louis Paré of UQTR, Marc Molgat of the University of Ottawa and Derek Wilkinson of Laurentian University. Many students and research officers contributed to the research at one stage or another. Their role is mentioned in the research reports to which they contributed.. 2. This methodological choice is explained in Chapter 1 of this report..
(20) 2. Youth Migration in Quebec. before meant that young Francophones and Anglophones would answer the same set of questions. By revealing the paths taken by young adults and how they perceive their place of origin, the national survey of 2004-2005 makes it possible to observe several dimensions of the migratory phenomenon. The term “migrant” is used for any person older than 15 years of age who has moved from a given municipality, region, province or country to another, for a period exceeding six months. The Anglophone section of the GRMJ’s national survey focuses specifically on young Anglophones aged 20 to 34 living in Quebec at the time of the survey, that is, those who have never left the province (69.3%), those who have returned to Quebec after living elsewhere (8%) and those from other countries or other provinces of Canada who have chosen to settle in Quebec (21.5%). The survey thus covered young Anglophones who form an everyday part of Quebec society. A process was set in motion to find the necessary funds 3 for the building of a random oversample of young Anglophones aged 20 to 34 and to find a polling agency to administer the questionnaire. 4 This Anglophone segment of the GRMJ’s survey comprised 1,237 young Anglophones, of whom 33.1% were from Montreal while the remaining 66.9% were from the rest of Quebec. The present report, which focuses on the migration of young Anglophones, presents the results for all of Quebec. It is organized as follows: -. The first section of this document briefly describes the general parameters of the study.. -. The second section presents the characteristics of Anglophone respondents and their migration profile, aspects essential to subsequent analysis.. -. In the third section, the various migratory experiences of young Anglophones are analyzed.. -. The fourth section looks at the current perception of the place of origin.. -. The fifth section focuses on the perception of the current place of residence with regard to potential mobility.. -. 3 4. Finally, the last section examines youth migration and employment.. Sources of financing are mentioned in Chapter 1 of the present report.. Léger Marketing was chosen. A portion of the team of professors worked with Léger Marketing throughout the process, from building the sample and administering the questionnaire to verifying the data..
(21) Youth Migration in Quebec. 3. Data from the survey will supply rich analytical material for researchers interested in the young people of Quebec. The GRMJ hopes that these analyses will contribute to a better understanding of the phenomenon of youth migration..
(22)
(23) Youth Migration in Quebec. 1. 5. PARAMETERS OF THE STUDY. Over the last eleven years, the research group on youth migration (GRMJ) has studied the question of the migration of young Quebecers, more specifically, the relationship of young people to the province of Quebec as subdivided into administrative regions for research purposes. The team comprising this research group is interdisciplinary and interuniversity. Set in motion by a theoretical reflection (Gauthier, dir., 1997) of what many perceived as the “youth exodus” problem, the work of the GRMJ soon became oriented towards the concept of “migration,” understood as geographical mobility outside the place of origin for a certain length of time. The concept of exodus was based on a certain determinism, generally economic and more or less irreversible. The concept of migration calls upon the social actor role of a young person at the age when socialization, identity formation and transition towards adult life take place. This theoretical approach paves the way to a broader conception of the reality studied, and to ways of looking at things that attenuate the negative dimensions of “retention,” which are generally associated with exodus. Thus, in one way, the concept evokes the question of a sense of belonging, while in the other it evokes the power of attraction exercised by certain places. During the migratory process, it suggests a preservation of ties to the place of origin, as opposed to an escape through exodus. Moreover, the notion of migration implies integration both at the destination and at the place of origin returned to, and social and vocational integration in all cases. Beyond these theoretical considerations, the interview survey conducted during the second half of the 1990s clearly showed that the term “migration” was a better reflection of what young adults themselves were saying about their journey: no one saw his or her departure as an exodus, and few respondents had a negative perception of their place of origin. The reasons for departure were closely linked to the stage in life that focuses on construction of self and the transition toward adult life. Believing it important to analyze this phenomenon from within that theoretical framework and from the statements of the young people themselves, the GRMJ carried out, several studies of an empirical nature over the course of the years. In 1998-1999, it conducted 102 in-depth interviews with young migrants and non-migrants. Statistical verification was the next essential step. In 1999-2000, the GRMJ performed an extensive telephone survey of 5,518 Francophone Quebecers aged 20 to 34. The decision to include.
(24) 6. Youth Migration in Quebec. those aged 30-34 was prompted by the need to identify more precisely the period of life during which migration becomes less common. This survey made possible a number of analyses that provided varied, innovative insights into the phenomenon of youth migration, both on the regional and national levels. 5 Some of these analyses confirmed or clarified the results of the previous qualitative study, while others revealed unexpected aspects of the phenomenon, in particular the possibility of return, the usually positive perceptions of the place of origin, and the existence of periods of life when migration is more prevalent. Two volumes and a number of articles and research reports came from these studies, links to which may be found on the Web site of the Observatoire Jeunes et Société (OJS) [observatory of youth and society: www.obsjeunes.qc.ca]. In 2004, five years after the first survey, the GRMJ repeated the survey, this time contacting 5,997 young adults aged 20-34. A careful revision of the questionnaire was performed, 6 along with translation of it into English in order to ensure that language would not impede its administration throughout the youth population of Quebec. Oversamples of Anglophones and Aboriginals, along with regional oversamples, were added to the base sample in order to reach a sufficient number of respondents and thereby enrich the statistical analysis. Funding of the base sample, including a part of the Anglophone sample and all of the Aboriginal sample, and funding of data analysis, was provided by the CommunityUniversity Research Alliance (CURA) entitled “Insertion et participation des jeunes en région” [integration and participation of youth in the regions], a grant which was obtained by competition from the Social Sciences and Humanities Research Council of Canada. The oversample of Anglophones was funded by Canadian Heritage and the Community Table of the National Human Resources Development Committee for the English Linguistic Minority. 7 Funding for the regional oversamples and their analysis came from several sources: Forum Jeunesse Estrie and Emploi Québec Estrie, Emploi Québec Chaudière-Appalaches, Emploi Québec Capitale Nationale, Le Club Initiative Jeunesse de la Mauricie, Conférence régionale des élus de la Mauricie, Conférence régionale des 5. See the national report: Madeleine Gauthier, Marc Molgat and Serge Côté with the collaboration of David Mercier, Nathalie St-Laurent, Dominique Potvin and Frédéric Deschenaux. La migration des jeunes au Québec. Résultats d’un sondage auprès des 20-34 ans du Québec. Montreal, INRS Urbanisation, Culture et Société, 2001, and http://www.obsjeunes.qc.ca/f/Projets/espace/realisations/Sondage-20-34.pdf. 6. Here we must thank Hervé Gauthier of the Institut de la statistique du Québec for his significant contribution to revising the questionnaire.. 7. We are deeply grateful to Lisa Kennedy, director of the CeDeC Québec/Chaudière-Appalaches, who believed in this project from the beginning and helped enormously in the quest for funding..
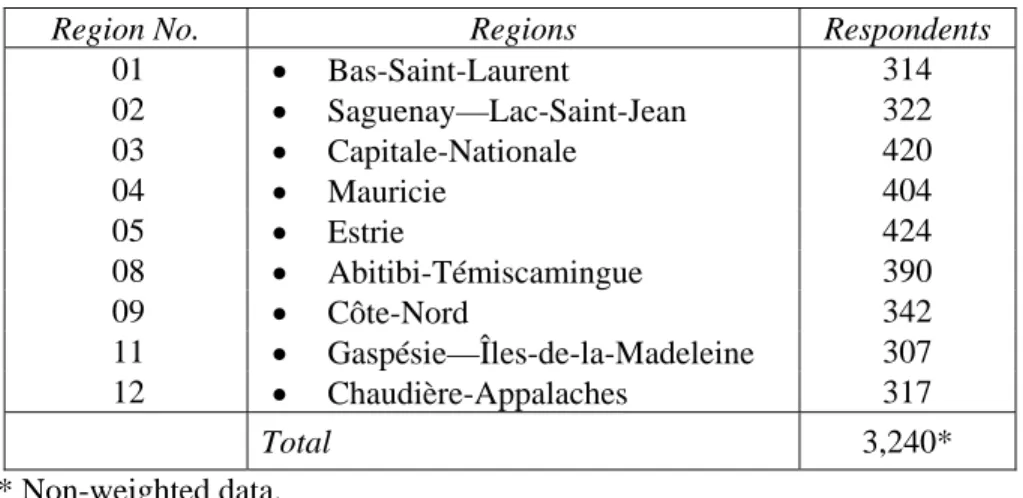
(25) Youth Migration in Quebec. 7. élus du Saguenay—Lac-Saint-Jean, ministère du Développement économique et régional et de la Recherche and the Université du Québec, Chaire Desjardins en développement des petites collectivités (UQAT), Forum jeunesse de l’Abitibi-Témiscamingue, Emploi Québec Bas-Saint-Laurent and the Commission Jeunesse Bas-Saint-Laurent, Emploi Québec Gaspésie—Îles-de-la-Madeleine. The Fonds québécois de recherche sur la société et la culture also contributed to the funding of the work by the research group on youth migration. The present study is a reiteration of the survey conducted in 1999-2000. The methodology used for the first survey was adopted in full for this one. Thus, nearly 6,000 Quebecers between 20 and 34 years of age were interviewed. The questionnaire was administered by Léger Marketing between the months of May 2004 and February 2005. 1.1. Sample Formation. An initial national sample of 2,700 cases was selected in the 17 administrative regions of Quebec. 8 To this was added an oversampling of 2,179 cases for nine regions of Quebec, namely, Bas-Saint-Laurent, Saguenay—Lac-Saint-Jean, Capitale-Nationale, Mauricie, Estrie, Abitibi-Témiscamingue, Côte-Nord, Gaspésie—Îles-de-la-Madeleine and Chaudière-Appalaches. Additionally, a file of 1,081 Anglophones and another of 168 Aboriginal respondents (37 of whom were added to those drawn randomly in the sample) were prepared for special purposes. In total, the study covers 5,997 respondents, divided by region of origin:. 8. •. The 8 administrative regions that were not oversampled: 2,757 respondents;. •. The 9 administrative regions that were oversampled: 3,240 respondents (Table 1).. See the methodological appendix for the method of sample building..
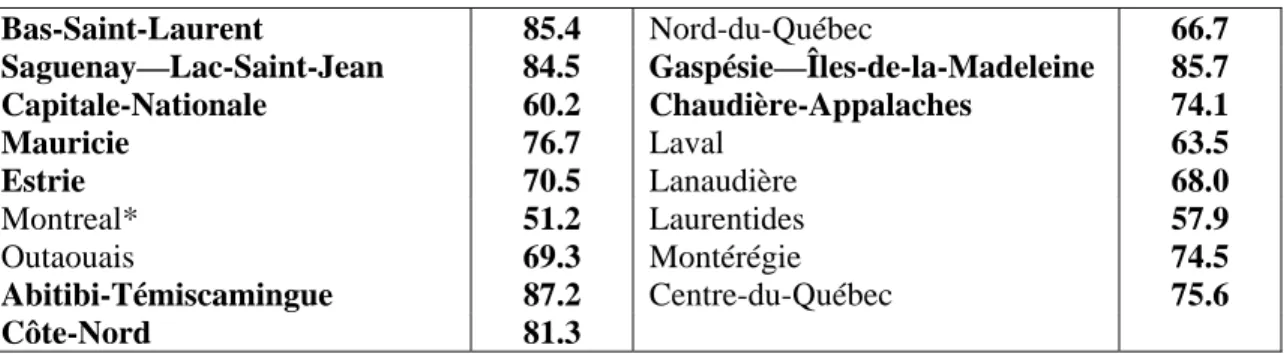
(26) 8. Youth Migration in Quebec. Table 1 - Number of respondents per oversampled administrative region. Region No. 01 02 03 04 05 08 09 11 12. Regions Respondents 314 • Bas-Saint-Laurent 322 • Saguenay—Lac-Saint-Jean 420 • Capitale-Nationale 404 • Mauricie 424 • Estrie 390 • Abitibi-Témiscamingue 342 • Côte-Nord 307 • Gaspésie—Îles-de-la-Madeleine 317 • Chaudière-Appalaches 3,240* Total * Non-weighted data. Source: GRMJ, Sondage sur la migration des jeunes, 2004-2005.. The Anglophone sample includes 1,237 non-weighted cases, including 1,081 from the Anglophone oversample and 156 from the national sample. Of those 1,237 cases, 33.1% were selected from the Montreal area and 66.9% from the other regions of Quebec. 9 Migration profiles were created from the various places where migrants had lived for at least six months. Thus, in order to qualify as a “returning migrant A,” for example, the migrant had to have lived in at least one location outside his or her region of origin and be living in his or her place of origin at the time of the survey. However, when variables are compared by administrative region, reference is made to the sampling region and not the region of origin. The sampling region is considered to be the region where the home contacted by telephone, which may or may not be the home of the respondent, is located. 10 Consequently, the migrants listed in the sampling region of Bas-Saint-Laurent, for example, could originally be from another region of Quebec; they could even never have lived in the Bas-Saint-Laurent region. The cross-tabulation by region must therefore be used with caution. In this regard, note for each region the percentage of respondents whose sampling region corresponds with the region of origin (Table 2).. 9. The selection of Anglophone respondents was determined by the following criterion: English is the language most often spoken at home. A number of researchers believe that this way of measuring the Anglophone group of Quebec provides a better reflection of reality, since it measures the current linguistic behaviour of respondents, whereas mother tongue is more a reflection of the past (Paillé, 1999). Thus, Termote (1997) suggests that the language of use “seems to have a more relevant sociocultural and political significance than the mother tongue, knowledge (self-declared) of a language or belonging to an ethnic group” (p. 80). Indeed, it seems that “[it is]the language of use, much more than the mother tongue, that determines migratory movements” (Termote and Gauvreau, 1988 in Paillé, 1999, p. 37). It must be added that the language of useis an important variable, because it becomes the mother tongue of children and thus plays a crucial role in generational, linguistic and cultural transfers. 10. Refer to items 1.2.2 and 1.2.3 of the methodological appendix for further details on this point..
(27) Youth Migration in Quebec. 9. Table 2 - Respondents whose sampling region corresponds with their region* of origin (as a % and in descending order, non-weighted data). Nord-du-Québec Bas-Saint-Laurent 85.4 66.7 Saguenay—Lac-Saint-Jean 84.5 Gaspésie—Îles-de-la-Madeleine 85.7 Capitale-Nationale 60.2 Chaudière-Appalaches 74.1 Laval Mauricie 76.7 63.5 Lanaudière Estrie 70.5 68.0 Montreal* Laurentides 51.2 57.9 Outaouais Montérégie 69.3 74.5 Centre-du-Québec Abitibi-Témiscamingue 87.2 75.6 Côte-Nord 81.3 * The regions in bold areoversampled regions subject to comparative analyses. The Montreal region appears in the comparative analyses without being oversampled; this region presenting a large enough sample that there was no need for this procedure. Source: GRMJ, Sondage sur la migration des jeunes, 2004-2005.. 1.2. General Characteristics of Respondents. The total file (5,997 cases) was weighted in order to give each regional and linguistic contingent its corresponding weight in the Quebec population for persons of the same age, and a correction for gender and age (20-24, 25-29, 30-34) was made. 11 The total weighted file was thus composed of 51.2% males and 48.8% females. The 20-24 age group and the 25-29 age group represent respectively 33.6% and 34% of the total sample, while the 30-34 age group follows closely at 32.4%. Only 3% of the respondents have not completed primary or high school (Table 3). Respondents whose highest completed level of education is high school (general or technical) or less comprise 28% of the sample. The college level (general or technical) represents the highest level of education completed for 38.1% of those interviewed. Lastly, 33.9% of the respondents possess a university degree, including 7.6% at the postgraduate level. Note, however, that at the time of the survey, some respondents may have been pursuing studies at a higher level than that already completed.. 11. See the methodological appendix for further details..
(28) 10. Youth Migration in Quebec. Table 3 - Highest level of education completed. Level of education completed % No diploma 1.0 Primary 1.9 High school – general 16.7 High school – technical 8.4 College – general 16.1 College – technical 22.0 Bachelor’s 26.3 Master’s 6.8 Doctorate 0.8 100.0 Total Source: GRMJ, Sondage sur la migration des jeunes, 2004-2005.. During the year of the survey, 60.6% of the respondents were mostly working. Among those, 89.4% were working full time (Table 4). Conversely, only 3.9% of the respondents were looking for work. One quarter (25.4%) of those interviewed were studying, while 9.1% were at home.. Table 4 - Occupation of respondents during the previous year. Principal occupation % At work 60.6 Looking for work 3.9 Studying 25.4 At home 9.1 Other 1.1 100.0 Total Source: GRMJ, Sondage sur la migration des jeunes, 2004-2005.. Half of the respondents (50.7%) had a gross income between $20,000 and $59,999 for the year 2003 (Table 5). 18.2% of respondents were in the $30,000-$39,999 income bracket. 43.5% of the respondents (mostly students) had an income under $20,000, while 5.8% earned $60,000 or more..
(29) Youth Migration in Quebec. 11. Table 5 - Gross income of respondents for the year 2003. Personal income from all sources, before % taxes and deductions, for the year 2003 No income 2.0 $1 to $4,999 5.5 $5,000 to $9,999 11.7 $10,000 to $14,999 12.2 $15,000 to $19,999 12.1 $20,000 to $29,999 16.7 $30,000 to $39,999 18.2 $40,000 to $59,999 15.8 $60,000 to $79,999 4.0 $80,000 to $99,999 1.1 $100,000 and over 0.7 Total 100.0 Source: GRMJ, Sondage sur la migration des jeunes, 2004-2005.. Nearly two thirds of those questioned (62.9%) had a partner or spouse at the time of the survey; the majority (65.9%) had no children (Table 6).. Table 6 - Number of children of respondents. Number % None 65.9 1 15.5 2 13.0 3 4.2 4 0.8 5 0.3 6 or more 0.1 100.0 Total Source: GRMJ, Sondage sur la migration des jeunes, 2004-2005.. The sample is largely (78.2%) comprised of persons whose mother tongue is French (Table 7). Those for whom English was the first language learned represent 7.2% of the respondents. Lastly, 12.8% of those interviewed have a language other than English or French as their mother tongue..
(30) 12. Youth Migration in Quebec. Table 7 - Mother tongue of respondents. Mother tongue, i.e. first language % learned and still understood French 78.2 English 7.2 French and English 1.7 Other 12.8 100.0 Total Source: GRMJ, Sondage sur la migration des jeunes, 2004-2005.. Among those interviewed, 1.8% state that they are members of an Aboriginal community (Table 8). The Algonquin, Attikamek, Montagnais and Cree communities have the highest representation level in the sample. Nearly two thirds (62.8%) state that they are registered Indians; 40.3% were living on a reserve at the time of the survey.. Table 8 - Attachment to an Aboriginal community. Communities % Algonquin 13.0 Attikamek 12.6 Montagnais 27.3 Huron 7.6 Cree 18.5 MicMac 2.2 Mohawk 4.7 Inuit 7.1 Other (specify) 7.1 100.0 Total Source: GRMJ, Sondage sur la migration des jeunes, 2004-2005.. 1.3. Migration Profile of Respondents. Among the respondents as a whole, 37.3% have never migrated and are still living with their parents or in the same municipality as they do (Table 9). This means that the other 62.7% have left their municipality of origin. 9.8% have relocated within their region of origin (including those who have moved to another municipality in the same census agglomeration, referred to as “movers”), while 36.3% have migrated to another region. Lastly, 16.7% of the respondents have returned to settle in their region of origin..
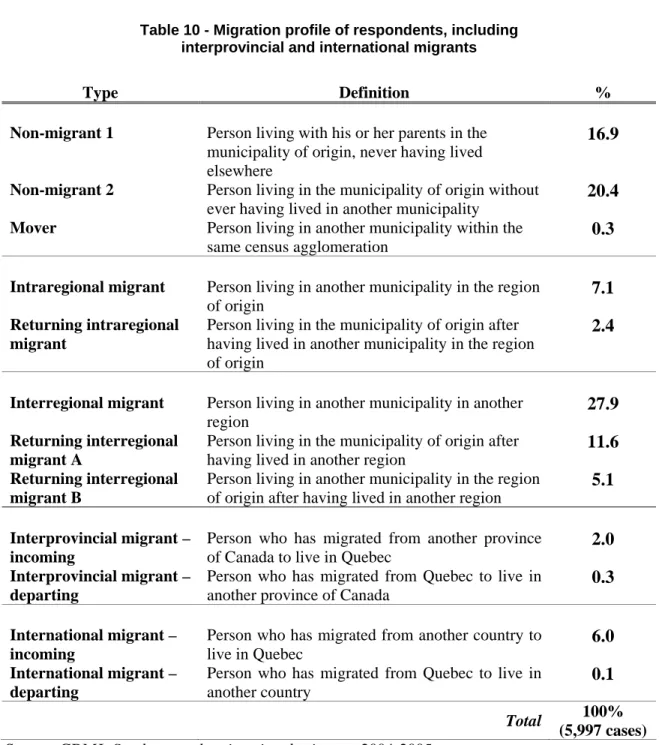
(31) 13. Youth Migration in Quebec. Table 9 - Migration profile of respondents. Type Non-migrant 1. Non-migrant 2 Mover. Intraregional migrant Returning intraregional migrant. Interregional migrant** Returning interregional migrant A Returning interregional migrant B. Definition. %. Person living with his or her parents in the municipality of origin, never having lived elsewhere Person living in the municipality of origin without ever having lived in another municipality Person living in another municipality within the same census agglomeration. 16.9. Person living in another municipality in the region of origin Person living in the municipality of origin after having lived in another municipality in the region of origin. 7.1. Person living in another municipality in another region Person living in the municipality of origin after having lived in another municipality in another region Person living in another municipality in the region of origin after having lived in another municipality in another region. 36.3. 20.4 0.3. 2.4. 11.6. 5.1. 100% (5,997 cases) ** Concerning the data analysis for certain regions, a distinction was made between interregional migrants who leave their region of origin and those who, not being originally from a region, come to live there. They are designated by the terms departing or incoming interregional migrant. This nuance is important for understanding the formation of regional samples. Source: GRMJ, Sondage sur la migration des jeunes, 2004-2005. Total. The following typology (Table 10) takes into account the relocations outside Quebec, while distinguishing between incoming interprovincial or international migrants and departing interprovincial or international migrants. However, this 12-type typology does not take into account the respondents originally from Quebec who lived at least six months outside the province, but who returned and were living in Quebec at the time of the survey. Among the 355 migrants with this migratory profile, 137 were living in a region other than that of their municipality of origin at the time of the survey (interregional migrants), 171 were living in their municipality of origin (returning interregional migrants A) and 47 were living in their.
(32) 14. Youth Migration in Quebec. region of origin in a municipality other than their municipality of origin (returning interregional migrants B). Conclusion These are the broad outlines of the targeted population of the survey. The following chapters will highlight the principal dimensions of the Anglophone sample. The study not only is composed of demographic statistics, but also touches on the reasons for migration, integration into the first place settled in, the parameters of the last relocation at the time of the survey, the potential for return including evaluation of the place of origin, and the question of employment in relation to migration..
(33) 15. Youth Migration in Quebec. Table 10 - Migration profile of respondents, including interprovincial and international migrants. Type. Definition. %. Person living with his or her parents in the municipality of origin, never having lived elsewhere Person living in the municipality of origin without ever having lived in another municipality Person living in another municipality within the same census agglomeration. 16.9. Person living in another municipality in the region of origin Person living in the municipality of origin after having lived in another municipality in the region of origin. 7.1. 27.9. Returning interregional migrant A Returning interregional migrant B. Person living in another municipality in another region Person living in the municipality of origin after having lived in another region Person living in another municipality in the region of origin after having lived in another region. Interprovincial migrant – incoming Interprovincial migrant – departing. Person who has migrated from another province of Canada to live in Quebec Person who has migrated from Quebec to live in another province of Canada. 2.0. International migrant – incoming International migrant – departing. Person who has migrated from another country to live in Quebec Person who has migrated from Quebec to live in another country. 6.0. Non-migrant 1. Non-migrant 2 Mover. Intraregional migrant Returning intraregional migrant. Interregional migrant. Total Source: GRMJ, Sondage sur la migration des jeunes, 2004-2005.. 20.4 0.3. 2.4. 11.6 5.1. 0.3. 0.1 100% (5,997 cases).
(34)
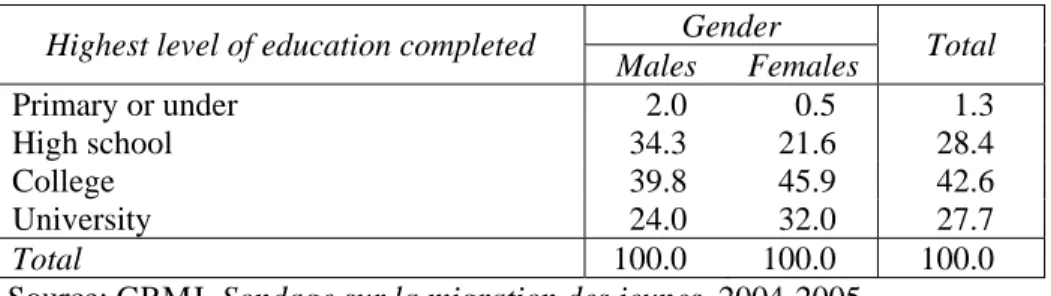
(35) Youth Migration in Quebec. 2 2.1. 17. CHARACTERISTICS OF ANGLOPHONE RESPONDENTS General Characteristics of Respondents. The total weighted data base is divided as follows in terms of the language most often spoken at home: 51.9% of the respondents indicate English, 29.4% both English and French, and 18.6% both English and another language. The sample comprises 53.2% males and 46.8% females. Over a third of those questioned are aged 20 to 24. Those aged 25-29 represent 31% of the sample, while 32.4% are aged 30-34. Over half of the respondents have a partner or spouse (52%), and 72.8% had no children at the time of the survey. In this study, the young Anglophones questioned who have a high school diploma comprise 24% of the sample. 35.9% of the respondents have completed college studies, and 38.8% have a university degree. Only 0.8% of those interviewed have finished only primary school or have no diploma at all. The principal areas of study of young Anglophones were found to be the following: administration, commerce and computer science (35.2%), health (9.9%) and arts (9.3%) for those with high school technical or college technical diplomas; humanities and social sciences (51.1%) and natural sciences (23.1%) for those with general college diplomas; 12 and applied sciences (20.1%), administration (17.1%), and humanities and social sciences (16.1%) for university graduates. A little more than half (53.3%) of the people who took part in the survey were mostly working during the previous year, 86.9% of them full time and 13.1% part time. Young people looking for a job accounted for 5.7% of the sample. About 30% of the respondents were studying, while 7.9% were at home. The median gross annual income of respondents was between $15,000 and $19,999. About 3.5% of the Anglophone respondents state that they are members of an Aboriginal community, of which 40.8% are Cree, 18.1% Inuit and 17.8% Montagnais. The majority of young Anglophones in the sample were born in Quebec (60%); the remainder were born in another province of Canada (12%) or elsewhere in the world (27.9%). We may thus conclude that a portion of the sample includes immigrants. 12. Note that during verification of the validity of the data, it was impossible to determine the fields of study for 28% of the respondents..
(36) 18. Youth Migration in Quebec. Apart from the language most often spoken at home (the criterion by which young Anglophones were selected), this study includes a number of language variables. With regard to mother tongue, 39.8% indicate English, 13.8% French, 9.6% English and French, and 36.8% other. When it comes to the language most often spoken outside the home, English dominates (58.3%). About 40% of the respondents went to English schools for their primary education, while 42.7% did so for high school, 64.7% for college and 68.2% for university. Thus, the proportion of young adults who pursue their studies in English increases with the level of education. This can be explained by Bill 101, which does not restrict access to English schools at the college and university levels. Regarding the spouse’s mother tongue, English is the most frequent answer (39.1%). Nevertheless, the proportion of individuals with a partner or spouse having French as the mother tongue is 25.3%; thus, about one respondent out of four belongs to a linguistically mixed couple. 13 The vast majority of the young adults state that they read, understand and speak French very well or rather well (82.2%, 85.5% and 81.5%). However, a smaller proportion of respondents (66.9%) consider themselves able to write French very well or rather well. Concerning their proficiency in English, nearly all the young Anglophones state that they read, understand, write and speak English very well or rather well (98.9%, 99.3%, 94.7%, 98.6%). Regarding their sense of identity, 41.3% of those questioned consider themselves members of both the Anglophone and Francophone communities. Some 36.2% state that they are members of the Anglophone community, 13.8% that they are members of the Francophone community. 2.2. Migration Profile of Respondents. Five general categories were created from the migratory characteristics of young Anglophones; each is divided into two or three more specific types (Table 11). Nonmigrants in the first category either have not left the family home yet (non-migrant 1) or have not left the municipality where their parents live (non-migrant 2). This category represents 49.6% of the sample, indicating that about half of those questioned still live in their town of origin. In the second category, we find those who have migrated within their administrative region of origin (intraregional migrant and returning intraregional migrant). They account 13. Note that here we are considering only the two official languages (i.e. French and English)..
(37) Youth Migration in Quebec. 19. for 2.8% of the sample. The third category includes all of the interregional migrants, which is to say, those who have left their administrative region of origin (interregional migrant) and those who left it but subsequently returned, to either their municipality of origin (returning interregional migrant A) or elsewhere in the region (returning interregional migrant B). This category accounts for 24.9% of the respondents. Young Anglophones who have left their administrative region of origin and have not returned represent 15.3% of the sample. It is important to mention that within the combined categories of “interregional migrant,” “returning interregional migrant A” and “returning interregional migrant B,” 25.2% have returned to Quebec after previously leaving. Thus, 8% of the total sample have returned to Quebec after previously leaving..
(38) 20. Youth Migration in Quebec. Table 11 - Migration profile of respondents. Type Non-migrant 1. Non-migrant 2. Definition. %. Person living with his or her parents in the municipality of origin, never having lived elsewhere Person living in the municipality of origin without ever having lived in another municipality. 29.2. 20.4. Person living in another municipality in the region of origin Person living in the municipality of origin after having lived in another municipality in the region of origin. 2.1. Person living in another municipality in another region Person living in the municipality of origin after having lived in another municipality in another region Person living in another municipality in the region of origin after having lived in another municipality in another region. 15.3. Interprovincial migrant – incoming Interprovincial migrant – departing. Person who has migrated from another province of Canada to live in Quebec Person who has migrated from Quebec to live in another province of Canada. 8.8. International migrant – incoming International migrant – departing. Person who has migrated from another country to live in Quebec Person who has migrated from Quebec to live in another country. 12.7. Intraregional migrant Returning intraregional migrant. Interregional migrant ** Returning interregional migrant A *** Returning interregional migrant B ****. Total. 0.7. 8.4. 1.2. 0.9. 0.4. 100% (1,237 cases) ** This category includes incoming interregional migrants, that is to say, interregional migrants who, not being originally from the region, come to live there, along with departing interregional migrants, meaning those who leave their region of origin. It also includes 14.2% of the individuals who migrated to other provinces of Canada or to other countries prior to settling in a region of Quebec other than the one where they grew up. *** This category includes 42.9% of the individuals who migrated to other provinces of Canada or to other countries before returning to live in their municipality of origin. **** This category includes 28.6% of the individuals who migrated to other provinces of Canada or to other countries before returning to live in another municipality in their region of origin. Source: GRMJ, Sondage sur la migration des jeunes, 2004-2005..
(39) Youth Migration in Quebec. 21. The smaller proportion of intraregional and interregional migrants found among young Anglophones corroborates the work of Paillé (1999), namely, that Anglophones are under-represented when it comes to migration within the province; concentrated in Montreal, the Anglophones of Quebec are less likely than Francophones to leave Montreal in order to settle elsewhere in Quebec (Termote, 2002). The fourth category includes individuals who either left another province of Canada to settle in Quebec (8.8%), or left Quebec to settle in another province (0.9%). The low proportion of departing interprovincial migrants is explained by the fact that the telephone survey was conducted in Quebec; thus, the first calls were made inside the province. Since it was a cluster survey (see the methodological appendix), some households may have provided telephone numbers of children or siblings who had migrated elsewhere in Canada. However, the survey methodology did not allow for contacting households whose members had all left the province. The rates given according to the migration profile can therefore not be generalized to all young Anglophones aged 20-34 who are currently living or have previously lived in Quebec. Indeed, according to the census data of 2001, the migration flow for young Anglophones (incoming minus outgoing migrants with respect to Quebec) is negative, departures being insufficiently offset by the arrival of English-speaking interprovincial and international migrants (Statistics Canada, 2001). Therefore, the percentages given in the migration profile of respondents can be generalized only to young Anglophones aged 20-34 who were living in Quebec at the time of the survey. Theresults collected by the GRMJ are innovative since they make the analysis of Anglophone migrants to Quebec possible. Until now, studies pertaining to incoming interprovincial and international migrants to Quebec have been nearly non-existent. As argued by Locher (1988), the recent decline of English Quebec is due primarily to the low rate of English-speaking incoming migrants. The last category combines youth who have either left another country to live in Quebec (12.7%), or have left Quebec for another country (0.4%). We can thus suppose that a certain portion of the sample is comprised of immigrants. This is not surprising, considering that the Anglophone community in Quebec includes more and more members of other ethnic origins. Jedwab (2001) indicates that in census data, young Anglophones are more likely to declare multiple origins than their elders. Thus, the sample reflects the changes that are taking place within the community..
(40) 22. 2.3. Youth Migration in Quebec. Migration Profile of Respondents by Sociodemographic and Identity Characteristics. In this section, the migration profile of young Anglophones is examined according to the following sociodemographic and identity variables: gender, age, level of education and sense of identity. Through examination of the migration profile of respondents by gender (Table 12), we notice that both males and females are found primarily in the non-migrant 1 type category (31.1% and 27.2%). Nevertheless, females are slightly less numerous in this migration profile (a difference that was also apparent in the 1998-1999 GRMJ study), with males having a greater tendency to remain in their parents’ home. Note, however, that among incoming international migrants there is a greater representation of males than females (15% versus 12.6%).. Table 12 - Migration profile by gender (as a %). Gender Males Females Non-migrant 1 31.1 27.2 Non-migrant 2 18.3 22.7 Intraregional migrant 1.7 2.6 Returning intraregional migrant 0.8 0.7 Interregional migrant 14.8 15.2 Returning interregional migrant A 8.3 8.4 Returning interregional migrant B 1.2 1.2 Interprovincial migrant – incoming 7.8 8.8 Interprovincial migrant – departing 1.2 0.9 International migrant – incoming 15 12.6 International migrant – departing --0.4 100.0 100.0 Total Source: GRMJ, Sondage sur la migration des jeunes, 2004-2005. Migration profile. Total 29.2 20.4 2.2 0.7 15.2 8.4 1.2 8.8 0.9 12.6 0.4 100.0. In general, migration increases with age. Those aged 20-24 predominate in the nonmigrant 1 category (53.1 %), the rate falling to 22% for those aged 25-29, and to 8.9%by age 30-34 (Table 13). The latter two age groups are more likely to be found among the following categories than the 20-24 age group: non-migrants 2, interregional migrants, returning interregional migrants A and B, and incoming interprovincial and international migrants. Thus, over half of those aged 20-24 are still living with their parents, while those in the 25-29 and 30-34 age groups are more likely to have left their parents either to.
Figure
+7
Documents relatifs
4 “El método es productor de realidades en vez de simplemente reflejarlas” (Law, 2004, p.70, Traducción nuestra)... A continuación, empezamos narrando cómo hemos llegado a la ME
• A plain unstitched white cotton sheet (scented with musk, camphor or perfumed) is placed on top of the opened body bag. • The deceased is lifted by the Burial team and placed on
Although Helen spent a lot of time working for the blind and deaf, she managed to write several books..
Therefore, objective of this study was to investigate whether the number of reported vertigo attacks was equiva- lent between two reporting strategies: (1) event sampling using
resources. Water shortages may be 2- caused by climate change, such as altered weather patterns including 3- droughts or floods, increased pollution, and increased human demand
Controlling for: schools’ socioeconomic composition, teaching style, job satisfaction, and years of experience. Teacher
connected surfaces the graph is a tree, the end points of which are conjugate to the origin of the cut locus and are cusps of the locus of first conjugate
though some local languages lack any description_ With regard to the number of distinct languages, the Tibeto-Burman vernaculars are the languages of the largest number
