ii
Université de Sherbrooke
THE .OH SCAVENGING EFFECT OF BROMIDE IONS ON THE YIELD OF H 2O2 IN THE RADIOLYISIS OF WATER BY 60Co -RAYS AND TRITIUM -PARTICLES AT
ROOM TEMPERATURE: A MONTE CARLO SIMULATION STUDY
Par
Shayla MUSTAREE
Département de médecine nucléaire et radiobiologie
Mémoire présenté à la Faculté de médecine et des sciences de la santé en vue de l’obtention du grade de maître ès sciences (M. Sc.)
en sciences des radiations et imagerie biomédicale
Sherbrooke, Québec, Canada Novembre, 2015
Jury
Pr Armand Soldera Examinateur, Département de chimie, Faculté des sciences
Pr Richard Wagner Examinateur, Département de médecine nucléaire et
radiobiologie, Faculté de médecine et des sciences de la santé Pr Jean-Paul Jay-Gerin Directeur de recherche, Département de médecine nucléaire
et radiobiologie, Faculté de médecine et des sciences de la santé
R
ÉSUMÉEFFET DE CAPTURE DES RADICAUX .OH PAR LES IONS BROMURE Br- SUR LE RENDEMENT DE H2O2 DANS LA RADIOLYSE DE L'EAU PAR LES RAYONS DE 60Co
ET LES ÉLECTRONS DU TRITIUM À LA TEMPÉRATURE AMBIANTE: UNE ÉTUDE PAR SIMULATION MONTE CARLO
Par
Shayla MUSTAREE
Département de médecine nucléaire et radiobiologie
Mémoire présenté à la Faculté de médecine et des sciences de la santé en vue de l’obtention du diplôme de maître ès sciences (M.Sc.) en sciences des radiations et imagerie biomédicale, Faculté de médecine et des sciences de la santé, Université de Sherbrooke, Sherbrooke, Québec, Canada, J1H 5N4.
Les simulations Monte Carlo constituent une approche théorique efficace pour étudier la chimie sous rayonnement de l'eau et des solutions aqueuses. Dans ce travail, nous avons utilisé ces simulations pour comparer l’action de deux types de rayonnement, à savoir, le rayonnement de 60Co (électrons de Compton ~1 MeV) et les électrons du tritium (~7,8
keV), sur la radiolyse de l’eau et des solutions aqueuses diluées de bromure. Les ions Br
-sont connus comme d’excellents capteurs des radicaux hydroxyles .OH, précurseurs du
peroxyde d’hydrogène H2O2. Les simulations Monte Carlo nous ont donc permis de
déterminer les rendements (ou valeurs G) de H2O2 à 25 °C pour les deux types de
rayonnements étudiés, le premier à faible transfert d'énergie linéaire (TEL) (~0,3 keV/m) et le second à haut TEL (~6 keV/m). L’étude a été menée pour différentes concentrations d’ions Br-, à la fois en présence et en absence d'oxygène. Les simulations ont montré que
l’irradiation par les électrons du tritium favorisait nettement la formation de H2O2
comparativement aux rayons du cobalt. Ces changements ont pu être reliés aux différences qui existent dans les distributions spatiales initiales des espèces radiolytiques (i.e., la structure des trajectoires d'électrons, les électrons du tritium déposant leur énergie sous forme de « trajectoires courtes » de nature cylindrique, et les électrons Compton produits par la radiolyse formant principalement des « grappes » de géométrie plus ou moins sphérique). Les simulations ont montré également que la présence d'oxygène, capteur d’électrons hydratés et d’atomes H. sur l'échelle de temps de ~10-7 s (i.e., avant la
fin des grappes), protégeait H2O2 d’éventuelles réactions subséquentes avec ces espèces.
Une telle « protection » conduit ainsi à une augmentation de G(H2O2) à temps longs. Enfin,
en milieu tant désaéré qu’aéré, les rendements en H2O2 obtenus lors de la radiolyse par les
électrons du tritium ont été trouvés plus facilement supprimés que lors de la radiolyse . Ces différences dans l’efficacité de capture des précurseurs de H2O2 ont été interprétées par
les différences quantitatives dans la chimie intervenant dans les trajectoires courtes et les grappes. Un excellent accord a été obtenu avec les données expérimentales existantes. Mots clés: Simulations Monte Carlo, radiolyse de l'eau, TEL, structure de trajectoire des rayonnements, peroxyde d’hydrogène (H2O2), ions bromure (Br-), radicaux hydroxyles
iv
S
UMMARYTHE .OH SCAVENGING EFFECT OF BROMIDE IONS ON THE YIELD OF H 2O2 IN THE RADIOLYISIS OF WATER BY 60Co -RAYS AND TRITIUM -PARTICLES AT
ROOM TEMPERATURE: A MONTE CARLO SIMULATION STUDY Shayla MUSTAREE
Département de médecine nucléaire et radiobiologie
Thesis presented at Faculty of Medicine and Health Sciences in order to obtain the Master degree of Sciences (M.Sc.) in Radiation Sciences and Biomedical Imaging, Faculty of Medicine and Health Sciences, Université de Sherbrooke, Sherbrooke, Québec, Canada, J1H 5N4.
Monte Carlo simulations were used here to compare the radiation chemistry of pure water and aqueous bromide solutions after irradiation with two different types of radiation, namely, tritium -electrons (~7.8 keV) and 60Co -rays/fast electron (~1 MeV) or high
energy protons. Bromide ions (Br-) are known to be selective scavengers of hydroxyl
radicals .OH precursors of hydrogen peroxide H
2O2. These simulations thus allowed us to
determine the yields (or G-values) of H2O2 in the radiolysis of dilute aqueous bromide
solutions by the two types of radiations studied, the first with low linear energy transfer (LET) (~0.γ keV/ m) and the second with high LET (~6 keV/ m) at 25 oC. This study was
carried out under a wide range of Br- concentrations both in the presence and the absence of
oxygen. Simulations clearly showed that irradiation by tritium -electrons favored a clear increase in G(H2O2) compared to 60Co -rays. We found that these changes could be related
to differences in the initial spatial distributions of radiolytic species (i.e., the structure of the electron tracks, the low-energy -electrons of tritium depositing their energy as cylindrical “short tracks” and the energetic Compton electrons produced by -radiolysis forming mainly spherical “spurs”). Moreover, simulations also showed that the presence of oxygen, a very good scavenger of hydrated electrons (e
-aq) and H. atoms on the 10-7 s time scale
(i.e., before the end of spur expansion), protected H2O2 from further reactions with these
species in the homogeneous stage of radiolysis. This protection against e
-aq and H. atoms
therefore led to an increase in the H2O2 yields at long times, as seen experimentally.
Finally, for both deaerated and aerated solutions, the H2O2 yield in tritium -radiolysis was
found to be more easily suppressed than in the case of cobalt-60 -radiolysis, and interpreted by the quantitatively different chemistry between short tracks and spurs. These differences in the scavengeability of H2O2 precursors in passing from low-LET 60Co -ray
to high-LET tritium -electron irradiation were in good agreement with experimental data, thereby lending strong support to the picture of tritium- radiolysis in terms of short tracks of high local LET.
Keywords: Monte Carlo simulations, radiolysis of water, LET, radiation track structure, hydrogen peroxide (H2O2), hydroxyl radicals (.OH), bromide ions (Br-), G-values, tritium
T
ABLE OF CONTENTS1 Résumé ... iii
2 Summary ... iv
3 Table of contents ... v
4 List of figures ... vii
5 List of tables ... xii
6 List of abbreviations ... xii
1 1. Introduction ... 1
1.1 Importance of aqueous radiation chemistry ... 1
1.2 Energy deposition events and interaction of ionizing radiation with matter……… 1.3 Track structure in water radiation chemistry………. 1.3.1 Low-LET radiation………...5
1.3.2 High-LET radiation………...8
1.4 Radiolyis of water……… 1.4.1 Time scale of events and formation of primary radical and molecular products in neutral water radiolysis……….. 1.5 Tritium (3( β-particle low energy electron ………. 1.6 A comparison between 3H - particles and 60Co -rays………... 1.7 Radiolysis of aqueous (dilute) Br- scavenger solutions……….……….23
1.7.1 Presence of Oxygen…... 5
1.8 Yields of H2O2……….. 1.8.1 Why H2O2 should be considered as an important………...26
product of water radiolysis 1.9 Research objectives………....27
. Monte Carlo simulation……… 2.1 Simulations in γ- radiolysis………..29
. . The IONLYS code………...…29
. . The IRT simulation code……….. . Simulations in tritium β-ray radiolysis………..37
vi
. . The IRT code………... 7
3. Article 1 ... 39
Shayla Mustaree, Jintana Meesungnoen, Sofia Loren Butarbutar, Patrick Causey,Craig R. Stuart and Jean-Paul Jay-Gerin
"Self-radiolysis of tritiated water. 3. The •OH scavenging effect of bromide ion on the yield of H2O2 in the radiolysis of water by 60Co γ-rays and tritium β-particles at room temperature."
RSC Adv., 2014, 4, 43572-43581
. Discussion……….……….. 4.1 Choice of using the electron energy of . keV………
for tritium β-particle radiation
4.2 Higher H2O2 yield found in tritium β-ray radiolysis of water ………
4.3 Effect of oxygen interfering with the scavenging function of Br- ………..…...
4.4 Lack of information and experimental data regarding
3( β-electron radiolysis………..
4.5 Significant reactions responsible for H2O2 yield
in radiolysis of water ……….……….……….70 4.6 Using ~ 300 MeV incident protons for 60Co γ-ray radiolysis of water………72
5. Conclusion……… . Acknowledgement……… 7. References ... 77
L
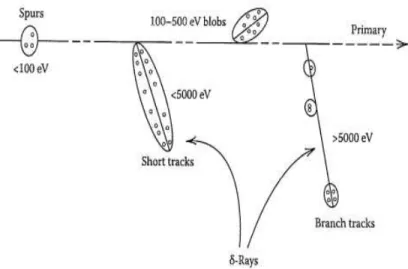
IST OF FIGURES Chapter 1Figure 1.1 Track structure classification by spurs ………7 (spherical entities, up to 100 eV), blobs (spherical or ellipsoidal, 100–500 eV), and short tracks (cylindrical, 500 eV–5 keV) for a primary high-energy electron (not to scale). “Adapted with permission from BURTON (1969). Copyright (1λ6λ) American Chemical Society”. The energy partition between the three track entities strongly depends on the incident particle energy, dividing approximately as the ratio of 0.75:0.12:0.13 between the spur, blob, and short track fractions for a 1-MeV electron in liquid water (PIMBLOTT et al., 1990).
Figure 1.2 Simulated tracks (projected into the XY plane of figure)………...7 for five 150-keV electrons in liquid water, showing the stochastic nature of
paths. Each electron is generated at the origin and starts moving vertically upwards.
Figure1.3 Primary energy loss events in high-LET radiation……….8 tracks (Ferradini, 1979).
Figure 1.4 Projections over the XY plane of track segments……….λ calculated (at ~10-13 s) for H+ (0.15 MeV), (b) 4He2+ (1.75 MeV/nucleon), (c) 12C6+ (25.5 MeV/nucleon), and (d) 20Ne10+ (97.5 MeV/nucleon) impacting ions.
Ions are generated at the origin and along the Y axis in liquid water under identical LET conditions (~70 keV/m). The track segments for the different ions have been chosen equal to 5 m, except for 1H+, for which we have
adopted a track length of 1 m. This reduction in the track length for 1H+ was
dictated by the fact that the penetration range of this ion in liquid water, at the considered energy of 0.15 MeV, amounts to only ~2.3 m. For the case of a 1-m segment of 0.15 MeV proton track, the LET is nearly constant (~70 keV/m) along the trajectory. Dots represent the energy deposited at points where an interaction occurred (MUROYA et al., 2006).
viii
Figure1.5 Time scale of events that occur in the low-LET radiolysis………..15 of neutral, deaerated water (MEESUNGNOEN, 2007).
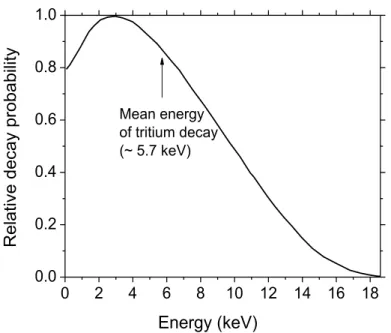
Figure 1.6 The 3H -decay energy spectrum (Bowels and Robertson, 1997)………….1λ
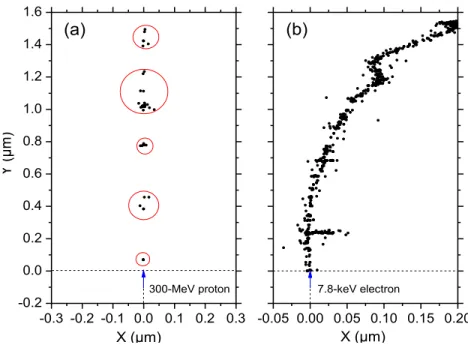
Figure 1.7 Simulated track histories (at ~10-13 s, projected………..β1
into the XY plane of figure) of a 300-MeV proton (panel a) and a 7.8-keV - electron (panel b) incident on liquid water at 25 °C. The two irradiating particles are generated at the origin and start traveling along the Y axis. Dots represent the energy deposited at points where an interaction occurred.
Chapter 2
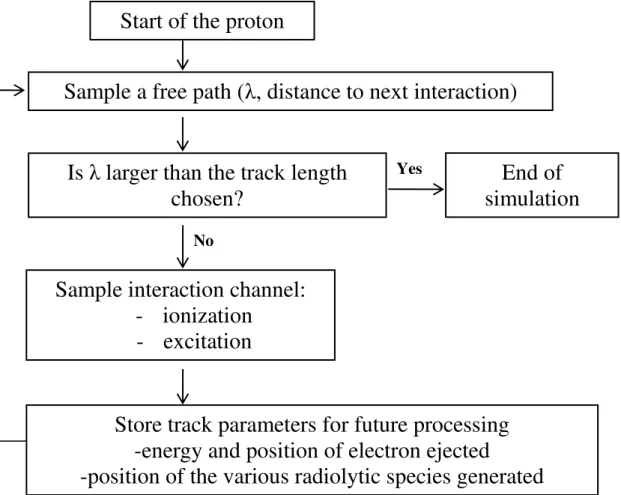
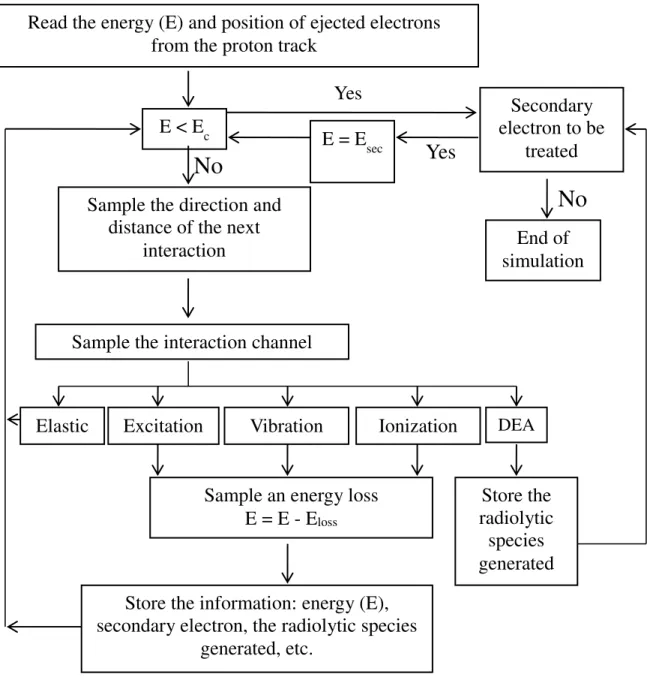
Figure 2.1 Algorithm of the TRACPRO simulation program………γ1
Figure 2.2 Algorithm of the TRACELE simulation program………γγ
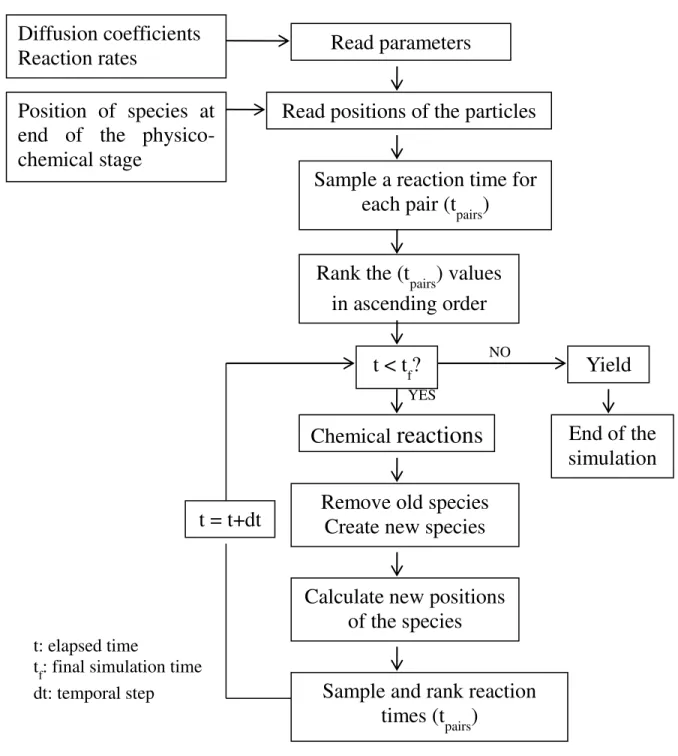
Figure 2.3 Algorithm of the IRT simulation program………....35
Figure 2.4 Diffusion coefficients (D) for the various track………γ6 species involved in our simulations (ELLIOTand BARTELS, 2009).
Chapter 3 - Article 1
Figure 1 Simulated track histories (at ~10-13 s, projected………..43 into the XY plane of figure) of a 300-MeV proton (panel a), a 7.8keV γH -electron (panel b), and a 150-keV electron (panel c) incident on liquid water at 25 °C. Panel c shows the similarity of the track structures of a 150-keV incident electron and of a 300-MeV irradiating proton (panel a). The three irradiating particles are generated at the origin and start traveling along the Y axis. Dots represent the energy deposited at points where an interaction occurred.
Figure 2 Time evolution of G(H2O2) (in molecule/100 eV)………...50
after 300-MeV proton irradiation (LET ~ 0.3 keV/m) of aqueous bromide solutions at neutral pH and 25 °C, calculated from our Monte Carlo simulations over the interval 10-12-10-4 s. The magenta, blue, red and green
lines correspond to four different initial concentrations of bromide ions: 10 -5, 10-3, 10-2 and 0.1 M, respectively. The solid lines show our simulated
results for deaerated solutions whereas the dashed lines are for air-saturated (the concentration of dissolved oxygen used in the calculations is 2.5 10-4 M) solutions. The black solid and dashed lines show the kinetics
of H2O2 formation in bromide-free deaerated and aerated solutions (shown
here for the sake of reference), respectively. The experimental primary (or “escape”) yield g(H2O2) for 60Co -irradiation of pure, air-free liquid water
(pH 7) is taken from ref. 7, 22, 43, and 61 (~0.70 ± 0.03 molecule/100 eV) (■) and from ref. 62 (0.67 ± 0.01 molecule/100 eV) (▲). Note that these latter data have been positioned at s ~ 2 10-7 s, the time at which spur
overlap is complete at 25 °C (ref. 9). The different color arrows pointing upwards give the times at which the scavenging of ●OH by Br is occurring
for the different considered bromide ion concentrations. The open squares are the H2O2 yields measured (in deaerated conditions) in ref. 22 using
bromide as ●OH scavenger for the corresponding scavenging powers (see
ref. 63) (i.e., ~105, 107, 108, and 109 s-1, respectively).
Figure 3 Decrease in G(H2O2) (in molecule/100 eV) with………..5β
concentration of Br ions for 300-MeV incident protons (LET ~ 0.3
keV/m) in the radiolysis of neutral pH aqueous bromide solutions at 25 °C, calculated from our Monte Carlo simulations over the range of ~6 10-7-0.2
M. Experimental data for 60Co -/fast electron irradiations: (□, deaerated),
ref. 22, (▲, aerated) ref. 24, and (○, deaerated) ref. 62. The solid and dashed lines represent our simulated results of G(H2O2), taken at the times at which
scavenging of ●OH by Br is occurring, for deaerated and aerated solutions,
respectively. The arrow indicates the Br ion concentration (~7 10-3 M)
below which the scavenging of eaq and H● atoms by O2 in aerated solutions
occurs before the scavenging of ●OH by Br.
Figure 4 Time dependence of G(H2O2) (in molecule/100 eV)………...5γ
for the radiolysis of aqueous bromide solutions (pH neutral, 25 °C) by 3H -
particles with initial energy of 7.8 keV (mean energy of energy deposition by the -particles), calculated from our Monte Carlo simulations over the interval 10-12-10-4 s. The magenta, blue, red and green lines correspond to
four different initial concentrations of bromide ions: 10-5, 10-3, 10-2, and 0.1
M, respectively. The solid lines show our simulated results for deaerated solutions whereas the dashed lines are for air-saturated (the concentration of dissolved oxygen used in the calculations is 2.5 10-4 M) solutions. The
black solid and dashed lines show the kinetics of H2O2 formation in
bromide-free deaerated and aerated solutions (shown here for the sake of reference), respectively. The different color arrows pointing upwards give the times at which the scavenging of ●OH by Br is occurring for the
different considered bromide ion concentrations. The black arrow pointing downwards indicates our calculated value of the H2O2 yield in the 7.8-keV
x
3H -electron radiolysis of pure, air-free water at ~10-6 s (~0.78
molecule/100 eV) that we have used in this work for G°(H2O2) (the yield
value obtained by “extrapolating the yields in bromide solutions to zero Br
concentration”) to calculate G(H2O2) from the ratios G(H2O2)/G°(H2O2).
Figure 5 Decrease in G(H2O2) (in molecule/100 eV) with………..55
concentration of Br ions for 7.8-keV incident electrons (LET ~ 6 keV/m)
in the radiolysis of neutral pH aqueous bromide solutions at 25 °C, calculated from our Monte Carlo simulations over the range of ~6 10-7-0.2 M. The
solid and dashed lines represent our simulated results of G(H2O2), taken at
the times at which scavenging of ●OH by Br is occurring, for deaerated and
aerated solutions, respectively. Experimental data for deaerated neutral solutions irradiated with tritium -particles: (▼), Fig. 2 of ref. 21, using G°(H2O2) = 0.78 molecule/100 eV (see ref. 65 and caption of Fig. 4). The
arrow indicates the Br ion concentration (~7 10-3 M) below which the
scavenging of eaq and H● atoms by O2 in aerated solutions occurs before the
scavenging of ●OH by Br.
Figure 6 Inhibition of G(H2O2) (in molecule/100 eV) by………...56
bromide ions as obtained from our Monte Carlo simulations of the radiolysis of deaerated (panel a) and aerated (panel b) neutral pH aqueous solutions by ~7.8-keV 3H -particles (solid lines) and ~300-MeV incident protons (which
mimic 60Co /fast electron radiolysis) (dotted lines) at 25 °C, as a function of
Br concentration. In both cases, it is seen that the inhibition of the H 2O2
yield for tritium -rays is greater than for 60Co -rays.
Chapter 4
Figure 4.1 Distribution of energy deposition by the……….65
tritium -electrons with respect to electron energy. The equivalent electron energy or mean energy deposition is 7.8 keV corresponds to the mean
energy derived from the distribution.
Figure 4.2 Comparison of the time dependence of………66 G(H2O2) (molec./100eV) calculated from our Monte Carlo simulations over
the interval 10-12-10-4 s that occur in air-free bromide solution (neutral pH)
at 25 oC after irradiation with 300 MeV incident protons (which mimic
irradiation with 60Co -rays) shown by (
—
) and with 7.8 keV tritium-electrons shown by (
—
). The arrows are indicating the G-values of hydrogen peroxide at a certain corresponding scavenging time.Figure 4.3 Comparison of the time dependence of……….68 G(H2O2) (molec./100eV) calculated from our Monte Carlo simulations over
the interval 10-12-10-4 s that occur in air-free (solid lines) and air-saturated
(dotted lines) bromide solution (neutral pH, 0.01 M [Br-]) at 25 oC after
irradiation with 300 MeV incident protons (which mimic irradiation with
60Co -rays) shown by (—,····) and with 7.8 keV tritium -particles, shown
by (—,····). The arrows are indicating the G-values of hydrogen peroxide at a certain corresponding scavenging time.
Figure 4.4 Comparison of the time dependence of………...6λ G(H2O2) (molec./100eV) calculated from our Monte Carlo simulations over
the interval 10-12-10-4 s that occur in air-free (solid lines) and air-saturated
(dotted lines) bromide solution (neutral pH, 10-3 M [Br-]) at 25 oC after
irradiation with 300 MeV incident protons (which mimic irradiation with
60Co -rays) shown by (—,····) and with 7.8 keV tritium -particles shown
by (—, ····). The arrows are indicating the G-values of hydrogen peroxide at
a certain corresponding scavenging time.
Figure 4.5 Comparison of the time dependent ΔG values………...71 of hydrogen peroxide after irradiation with tritium -particle radiolysis, panel (a) and 300 MeV protons (Co60- rays/fast electron), panel (b) for 0.01 M[Br-]
that occurred in air-saturated neutral water at 250c. The different coloured
lines are corresponding to the different reactions, indicated by arrows.
xii
L
IST OF TABLESChapter 1
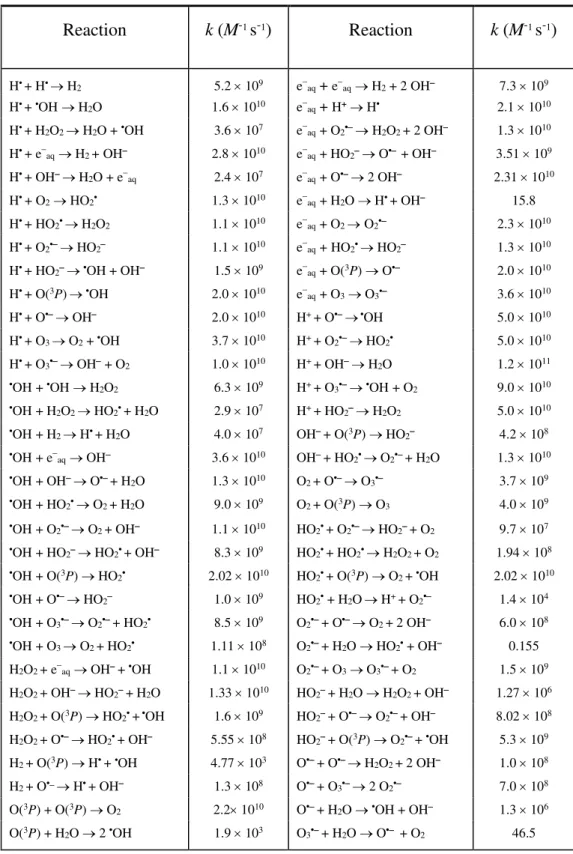
Table 1.1 Main spur/track reactions and rate constants (k)……….18 for the radiolysis of pure liquid water at 25 ºC (MEESUNGNOEN, 2007). Some values of k have been updated by using the most recently available data ofELLIOT and BARTELS (2009).
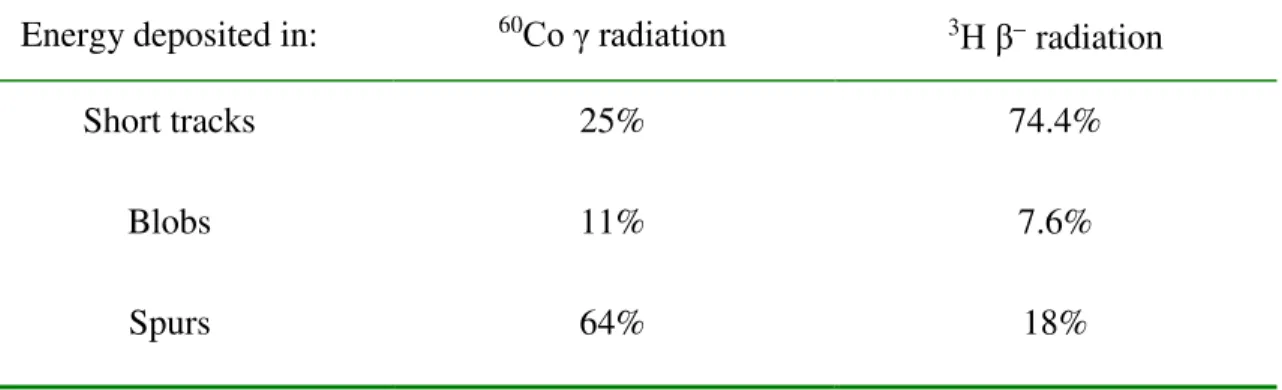
Table 1.2 Fraction of the total absorbed energy deposited………..ββ in short tracks, blobs, and spurs for different types of radiation: low-LET
60Co radiation and moderately high-LET 3H radiation (MOZUMDER
and MAGEE, 1966).
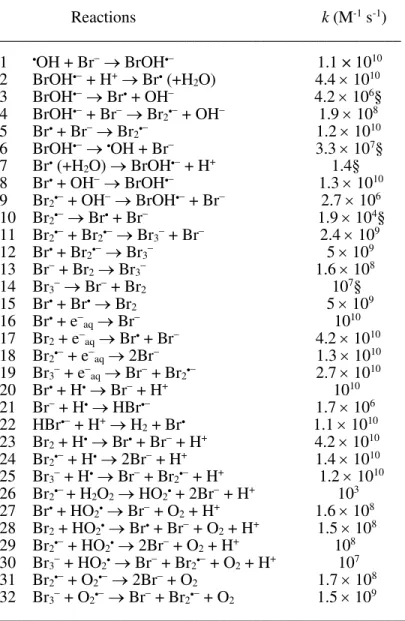
Table 1.3 Reactions and rate constants (k) used for………β4 modeling the radiolytic oxidation of Br- by •OH radicals in aqueous
solutions at 25 °C. For first-order reactions (indicated by the symbol §), the value of k is given in s-1. Note that the rate constants given here for the
reactions between ions are in the limit of zero ionic strength (i.e., at infinite dilution of ions).
Chapter 3- Article 1
Table 1 Reactions and rate constants (k) used………...45 for modeling the radiolytic oxidation of Br- by •OH radicals in aqueous
solutions at 25 °C. For first-order reactions (indicated by the symbol §), the value of k is given in s-1. Note that the rate constants given here for the
reactions between ions are in the limit of zero ionic strength (i.e., at infinite dilution of ions).
L
IST OF ABBREVIATIONS Cross section
DEA Dissociative electron attachment
DNA Deoxyribonucleic acid
e-aq Hydrated electron
eV Electronvolt
Gx or g(X) Primary yield of the radiolytic species X
G(X) Experimental 100-eV yield of the final product X
IRT Independent reaction times
k Reaction rate constant
keV Kilo-electronvolts (103 eV)
LET Linear energy transfer
MC Monte Carlo
MeV Mega-electronvolts (106 eV)
molec./100 eV Molecule/100 eV
Z Atomic number
3H Tritium
1
1. I
NTRODUCTIONRadiation chemistry is a broad and a comprehensive coverage clasping many areas of radiation science which is continually evolving and finding wider applications. Radiation research belongs to this field of chemistry with the meaning of investigations on the nature of penetrating radiations and their effects on the materials they traverse. This is particularly apparent in the study of the roles of free radicals in biology generally and radiation biology specifically. The history of radiation chemistry goes back to the end of the 19th century after the discovery of X-rays. Earlier understanding of the nature of chemical reactions induced by radiation was difficult since it was not possible to obtain sufficiently strong radiation sources to produce enough changes that could be observed with analytical techniques. Starting in the early 1λ40’s, progress in radiation and nuclear sciences was made rapidly with the development of nuclear reactors. Radiation chemical studies have attracted many interests due to its various applications and its ability to produce and investigate the reactive atomic species playing a part in chemical reactions, synthesis, industrial processes or in biological systems. The techniques are applicable to gaseous, liquid, solid and heterogeneous systems. Among them, the radiation chemistry of water and other aqueous solutions are one of the dominating radiation research areas dealing with the chemical changes induced in solutions by the absorption of radiation energy.
1.1 Importance of aqueous radiation chemistry:
The radiation chemistry studies of water and aqueous solutions belong to a large fraction of radiation science because of the unique importance of water in biological systems. It is relevant to a number of practical applications not only in the nuclear science and technology but also in radiotherapy and diagnostic radiology and the environmental management of radioactive waste materials (LAVERNE, 2004). This study of the radiolysis of water and aqueous solutions has been actively examined for more than a century. In biological systems, since all living cells and tissue consist of mainly water (~70% to 85% by weight), it plays a major role in radiobiology. Because, this radiolysis produces reactive species which are responsible for indirect radiation effects. It has also importance in nuclear technology, such as in water-cooled nuclear power reactors (where water, used both as
moderator and as a heat transport medium, is circulating around the reactor core at temperatures of 250-310 ºC) and in order to control water chemistry to mitigate the effects of water radiolysis and thus minimize corrosion. That corrosion can be occurred through the radiolytic production of oxidizing species, such as •OH, H2O2, O2, etc., the yields and
the activities of decomposition products of water. The irradiations of water by high energy electrons/protons or by 60Co -rays and by low-energy electrons or -particles (e.g., from
tritium, 3H) are both relevant to radiation biology and nuclear technology. In fact, the
radiolysis of water and aqueous solutions has been the subject of numerous experimental and theoretical investigations, but some general points concerning the initial yields of the species generated in the ionisation event, their initial distribution in space and the mechanisms of their formation are still not fully resolve. That’s why; the knowledge of radiation chemistry of aqueous solutions is of great importance as well as is critical for understanding. A good summary of aqueous radiation chemistry is given in the review articles of BUXTON (1987), FERRADINI and JAY-GERIN (1999), and LAVERNE (2004). From the theoretical point of view, stochastic simulation methods employing Monte Carlo techniques have been used successfully to model the complex sequence of events that are produced by the interaction of ionizing radiation with pure liquid water. These simulation methods have permitted detailed studies of the relationship between track structure and radiation-induced chemical change. Monte Carlo code can model the entire water radiolysis process to simulate the primary interactions and to describe the kinetics of reactive radicals and ions as a function of the linear energy transfer (LET) of the ionizing radiation, pH and temperature leading to determine the yields (or G-values) of the radicals and molecules produced by the irradiation.
In the work presented here, Monte-Carlo track chemistry simulations are used to determine the molecular yield of H2O2, produced by two types of radiation, namely, low-
LET (0.3 keV/m) 60Co -rays and high-LET (6 keV/m) tritium -electrons, in pure
water and aqueous bromide solutions at neutral pH and 25 oC, in conjunction with available
3 1.2 Energy deposition events and interaction of ionizing radiation with matter:
Ionizing radiations are defined as those types of energetic particles and electro-magnetic radiations that, either directly or indirectly, cause ionization of a medium, i.e., the removal of a bound orbital electron from an atom or a molecule and thereby, the production of a residual positive ion radical. Some molecules, instead of being ionized, may also be excited to upper electronic states (e.g., see: EVANS, 1955; ANDERSON, 1984; IAEA-TECDOC-799, 1995; MOZUMDER, 1999; TOBUREN, 2004). Directly ionizing radiations are fast moving charged particles (e.g., electrons, protons, -particles, stripped nuclei, or fission fragments) that produce ionizations through direct Coulomb interactions. In this case, note that particle-particle contact is not necessary since the Coulomb force between the incoming particle and the molecular electrons acts at a distance. Indirectly ionizing radiations are energetic electromagnetic radiations (like X- or -ray photons) or neutrons that can also liberate bound orbital electrons, but secondarily to a preliminary interaction. For photons, this interaction is predominantly via production of Compton electrons and photoelectrons (and, if the incident photon energy is greater than 1.02 MeV, then there is the production of electron-positron pairs). Regardless of the type of ionizing radiation, the final common result in all modes of absorption of ionizing radiation is thus the formation of tracks of physical energy-loss events in the form of ionization and excitation processes and in a geometrical pattern that depends on the type of radiation involved.
Generally, the electrons ejected in the ionization events may themselves have sufficient energy to ionize one or more other molecules of the medium. In this way, the primary high-energy electron can produce a large number (~ 4 104 by a 1 MeV particle)
of secondary or higher-order generation electrons (it is customary to refer to all electrons that are not primary as “secondary”) along its track as it gradually slows down (ICRU REPORT 31, 1979). From atomic physics it is known that most energy-loss events by fast electrons involve small transfers of energy. In fact, the probability of a given energy transfer, Q, varies inversely with the square of that energy loss (EVANS, 1955). “Distant”
or “soft” collisions, in which the energy loss is small, are therefore strongly favored over “close” or “hard” collisions, in which the energy loss is large (MOZUMDER, 1999). The vast majority of these secondary electrons have low initial kinetic energies with a distribution that lies essentially below 100 eV and a most probable energy below 10 eV
(LAVERNE and PIMBLOTT, 1995; SANCHE, 2002; AUTSAVAPROMPORN, 2006). In most cases, they loose all their excess energy by multiple quasi-elastic (i.e., elastic plus phonon excitations) and inelastic interactions with their environment, including ionizations and/or excitations of electronic, intramolecular vibrational or rotational modes of the target molecules (MICHAUD et al., 2003) and quickly reach thermal equilibrium (i.e., they are “thermalized”). Determining exactly which of these competing interaction types will take place is a complex function of the target medium and the energy range of the incident electron. By definition, a measure of the probability that any particular one of these interactions will occur is called the “cross section” (expressed in units of area) for that particular interaction type (see, for example: JOACHAIN, 1975). The total interaction cross section , summed over all considered individual processes i, is used to determine the distance to the next interaction, and the relative contributions i to are used to determine
the type of interaction. Actually, the mean distance between two consecutive interactions or “mean free path” is defined by
= σ 1
N ,
where N is the number of atoms or molecules per unit volume, and
i i
σ
In a dilute aqueous environment, thermalized electrons undergo trapping and hydration in quick succession (within ~10-12 s) as a result of the water electric dipoles
rotating under the influence of the negative charge (BERNAS et al., 1996). Some electrons that have kinetic energies lower than the first electronic excitation threshold of the medium, the so-called “subexcitation” electrons (PLATZMAN, 1955), may also undergo, prior to thermalization, prompt geminate ion recombination (FREEMAN, 1987) or induce the production of energetic (~1-5 eV) anion fragments via formation of dissociative negative ion states (resonances) (i.e., dissociative electron attachment, or DEA) (CHRISTOPHOROU et al., 1984; BASS and SANCHE, 2003). As a consequence of the energy gained by the medium, a sequence of very fast reactions and molecular rearrangements lead to the formation of new, highly nonhomogeneously distributed
5 chemical species in the system, such as charged and/or neutral molecular fragments, reactive free radicals, and other excited chemical intermediates. The trail of the initial physical events, along with the chemical species, is generally referred to as the track of a charged particle and its overall detailed spatial distribution, including contributions from secondary electrons, is commonly known as “track structure” (see, for exampleμ
PARETZKE, 1987; MAGEE and CHATTERJEE, 1987; KRAFT and KRÄMER, 1993;
PARETZKE et al., 1995; MOZUMDER, 1999; LAVERNE, 2000, 2004). 1.3 Track structure in radiation chemistry of water:
Experimental and theoretical studies have shown that in the radiolysis of water the quantities and proportions of the chemical products are highly dependent on the distances separating the primary radiolytic species from each other, referred to as the “track structure”. The distribution of the track structure is mainly defined by the distribution of the physical energy deposition events and their geometrical dispositions. Interestingly, the track structure is known as “LET effects” as most of the early studies used this parameter to characterize the different radiation chemical yields for various radiation-induced ions in liquid water. Furthermore, the radiation track structure is an important concept in identifying the precise spatial location of the radiolytic species and free-radical intermediates generated in the tracks, and their subsequent radiobiological action at the molecular and cellular levels. Overall, the scientific community agrees that different qualities of radiation must be analyzed in terms of track structure (CHATTERJEE and HOLLEY, 1993; MUROYA et al., 2006).
1.3.1 Low-LET radiation:
The average LET of a 1-MeV electron in water is ~0.3 keV/m. The track averaged mean energy loss per collision event by such a fast electron is in the region of ~48–65 eV. This means that the energy loss events are, on the average, separated by distances of about ~2000 Å (LAVERNE and PIMBLOTT, 1995; MOZUMDER, 1999; AUTSAVAPROMPORN, 2006; SANGUANMITH et al., 2012 (June), 11277-11280). This nonhomogeneous distribution of energy deposition events in space gives rise to the spur theory for low_LET track structure (KARA-MICHAILOVA and LEA, 1940; ALLEN, 1948; SAMUEL and MAGEE, 1953; MAGEE, 1953; GANGULY and MAGEE, 1956),
according to which the entire track is to be viewed as a random succession of (more or less spherical) “spurs”, or spatially localized energy-loss events (it is assumed that irradiating particles are isolated from each other, an assumption not necessarily correct at very high dose rates or with very short pulses of intense beams). The deposited energy (a few tens of electron volts) in a spur ejects an electron from a molecule and subsequently, the ejected electron undergoes collisions with the medium. The electron eventually losses its entire energy and becomes thermalized (~0.025 eV) within about 80–120 Å of its geminate positive ion (GOULET and JAY-GERIN, 1988; MUROYA et al., 2002; MEESUNGNOEN et al., 2002a; PIMBLOTT and MOZUMDER, 2004; UHERA and NIKJOO, 2006). This electron thermalization distance or ‘penetration range’ is an estimation of the average radius of the spurs in the first stages of their development. Thus, the individual spurs produced by low LET radiation (so-called sparsely ionizing radiation) are so far apart along the track that they are not initially overlapping (but they will overlap somewhat later as they develop in time).
Mozumber and Magee (MOZUMDER and MAGEE 1966a,b) expanded the “spur” model to the radiation chemical consequences of the different energy-loss processes and they specifically employed a low-LET track composed of a random sequence of three types of essentially nonoverlapping entitiesμ “spurs, blobs, and short tracks” (Figure 1.1). As shown in Figure 1.1, the spur category covers tracks created by the energy losses between the lowest excitation energy of water (~7.3 eV) and 100 eV. PIMBLOTT and MOZUMDER (1991) showed that usually there are one to three ion pairs in a spur and about the same number of excited molecules. Blobs are defined as track entities with energy deposition of between 100 and 500 eV and short tracks with energy deposition of between 500 eV and 5 keV. Secondary electrons produced in energy transfers above 5 keV are considered as “branch tracks”. Short and branch tracks are collectively described as -rays. This old concept of track entities proved to be very helpful in greatly facilitating the visualization of track processes and in modeling radiation-chemical kinetics. It is still a useful approach for the classification of track structures, since it takes into account the spatial arrangements of initial species, which affect their subsequent reactions.
7
Figure 1.1 Track structure classification by spurs (spherical entities, up to 100 eV), blobs (spherical or ellipsoidal, 100–500 eV), and short tracks (cylindrical, 500 eV–5 keV) for a primary high-energy electron (not to scale). From BURTON (1969). Copyright (1969) American Chemical Society. With permission. The energy partition between the three track entities strongly depends on the incident particle energy, dividing approximately as the ratio of 0.75:0.12:0.13 between the spur, blob, and short track fractions for a 1-MeV electron in liquid water (PIMBLOTT et al., 1990).
Figure 1.2 Simulated tracks (projected into the XY plane of figure) for five 150-keV electrons in liquid water, showing the stochastic nature of paths. Each electron is generated at the origin and starts moving vertically upwards along the Y axis in the XY plane (MEESUNGNOEN and JAY-GERIN, 2011). -300 -200 -100 0 100 200 300 -100 -50 0 50 100 150 200 y ( m) x (m)
Figure 1.2 presents an example of the low-LET tracks, in which Monte Carlo simulations were used to calculate the complete tracks of five 150-keV electrons and their produced secondary electrons in liquid water (MEESUNGNOEN and JAY-GERIN, 2011).
1.3.2 High-LET radiation:
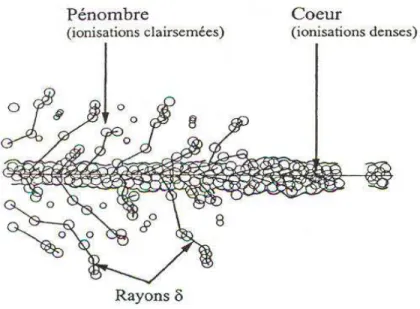
In this section, we will discuss how high-LET radiation tracks differ from those of low-LET radiation. It has been shown that with increasing LET, the distantly-spaced, nearly spherical spurs are formed more closely together and eventually overlap especially when LET becomes greater than ~10–20 keV/m and generate dense continuous columns. High-LET tracks produced by the heavy particles consist initially of a cylindrical “core” and a surrounding region traversed by the emergent, comparatively low-LET secondary electrons, called the “penumbra” (MOZUMDER et al., 1968; CHATTERJEE and SCHAEFER, 1976; FERRADINI, 1979; MAGEE and CHATTERJEE, 1980, 1987; MOZUMDER, 1999; LAVERNE, 2000, 2004).
9
Figure 1.4 Projections over the XY plane of track segments calculated (at ~10-13 s) for H+ (0.15 MeV), (b) 4He2+ (1.75 MeV/nucleon), (c) 12C6+ (25.5 MeV/nucleon), and (d) 20Ne10+ (97.5 MeV/nucleon) impacting ions. Ions are generated at the origin and along the Y axis in liquid water under identical LET conditions (~70 keV/m). The track segments for the different ions have been chosen equal to 5 m, except for 1H+, for which we have adopted a track length of 1 m. This reduction in the track length for 1H+ was dictated by the fact that the penetration range of this ion in liquid water, at the considered energy of 0.15 MeV, amounts to only ~2.3 m. For the case of a 1-m segment of 0.15 MeV proton track, the LET is nearly constant (~70 keV/m) along the trajectory. Dots represent the energy deposited at points where an interaction occurred. From MUROYA et al., 2006). Copyright (2006) Radiation Research Society. With permission.
Figure 1.4 shows typical two-dimensional representations of short (1–5 m) track segments of 1H+, 4He2+, 12C6+, and 20Ne10+ ions (MUROYA et al., 2006). These track
segments are calculated using our Monte Carlo simulation code, called IONLYS, under the same LET conditions (~70 keV/m). As it can be seen from the figure, these tracks can be considered as straight lines. It is also seen that the ejected high-energy secondary electrons travel to a farther distance away from the track core as the velocity of the incident ion increases, from protons to neon ions. In other words, although all the particles depositing the same amount of energy per unit path length, the energy is lost in a volume that increases in the order 1H+ 4He2+ 12C6+ 20Ne10+, indicating that the higher-Z particle (Z
et al., 2006). This irradiating-ion dependence of the track structure at a given LET (i.e., tracks of different ions with the same LET have different radial profiles) is in a good agreement with Bethe’s theory of stopping power and indicates that LET is not a unique descriptor of the radiation chemical effects within heavy charged particle tracks (SCHULER and ALLEN, 1957; SAUER et al., 1977; LAVERNE and SCHULER, 1987a; KAPLAN and MITEREV, 1987; FERRADINI and JAY-GERIN, 1999; PIMBLOTT and LAVERNE, 2002; LAVERNE, 2000, 2004).
1.4 Radiolysis of water:
Radiolysis of water is the dissociation of water molecules as a result of absorption of radiation energy such as neutrons, photons and electrons by the water itself. The result of absorption of such radiation by water is the formation of a variety of excited and ionized water molecules. The overall process when water exposed to high-energy radiation until producing of primary species at ~10-6 s can be described successively into three stages as
below (PLATZMAN, 1958):
a) Physical stage, consisting of deposition of radiant energy and formation of initial
products in a specific, highly nonhomogeneous track structure geometry.
b) Physicochemical stage is the stage leading to the establishment of thermal
equilibrium in the bulk medium with reactions and reorganization of initial products to give stable molecules and chemically reactive species such as free atoms and radicals.
c) Chemical stage is the stage where the various reactive species diffuse and react
with one another (or with molecules in the environment).
It is well-known that the radiolysis of pure deaerated (air free) liquid water by low “linear energy transfer” (LET), sparsely ionizing radiation (e.g., -rays from 60Co or fast electrons),
each energy-transfer event of a high-energy electron produces a cluster of reactive species, commonly known as a spur (SAMUEL and MAGEE, 1953; MAGEE, 1953). Under conventional irradiation conditions (i.e., at modest dose rates so that no track overlap occurs), these species are generated nonhomogeneously on subpicosecond time scales (PLATZMAN, 1958, see also KUPPERMANN, 1959) along the track of the incident radiation (MOZUMDER, 1999) and include the hydrated electron (e
-aq), H+, H●, ●OH, H2,
11 water at 25 °C], etc. (BUXTON, 1987; SPINKS and WOODS, 1990; FERRADINI and JAY-GERIN, 1999; MEESUNGNOEN and JAY-GERIN, 2011). As they diffuse away from the site where they were originally produced, these species either react within the spurs as they develop in time or escape into the bulk solution. At ambient temperature and pressure, the so-called “spur expansion” is essentially complete by ~2 10-7 s after the
initial energy deposition (SANGUANMITH et al., 2012 (October), 16731-16736). The so-called “primary” radical and molecular yields (“long-time” or “escape” yields) g(eaq-),
g(H•), g(H2), g(•OH), g(H2O2), represent the number of species formed or destroyed per 100 eV of absorbed energy that remains after spur expansion and becomes available to react with added solutes (treated as spatially homogeneous) in the bulk medium at moderate concentrations.
For low-LET radiation, following equation for the radiolysis of pure deaerated liquid water can be represented conceptually for an absorbed energy of 100 eV (FERRADINI and JAY-GERIN, 1999) (the symbol is used to distinguish reactions brought about by the absorption of ionizing radiation):
GH
2O H2O Ge
-aq e-aq + GH• H• + GH2 H2 + GH+ H+ + GOH-OH
+ G•OH•OH + GH2O2 H2O2 + GHO2•/O2• HO2•/O2•- + (1)
Where, the coefficients GX in the above equation is also written as g(X) that are the
“primary” radical and molecular yields of the various radiolytic species X, and GH2O
denotes the corresponding yield for net water decomposition. Mechanism of radiolysis of pure liquid water by low LET radiation is well understood at room temperature. It is already summarized in several text books. For 60Co -rays (photon energies of 1.17 and
1.33 MeV), hard X-rays or fast electrons of the same energies, at neutral pH and 25 ºC (average LET ~ 0.γ keV/ m), the most recently reported values of the primary yields are (LAVERNE, 2004) (in units of molecules per 100 eV)1.
1These units (sometime abbreviated as “molec./100 eV”) for g-values are used throughout in this work. For conversion into SI units (mol J-1)μ 1 molec./100 eV ≈ 1.0364 10-7 mol J-1.
Ge
-aq = 2.50 GH• = 0.56 GH2 = 0.45
G•OH = 2.50 GH2O2 = 0.70 (2)
These primary yield values, including the contribution of HO2•/O2•- [note that, for
low-LET radiolysis, HO2•/O2•- is a minor radiolytic product because it’s very small yield of
~0.02 molecule/100 eV (HART, 1955; BJERGBAKKE and HART, 1971) accounts for less than 1% of the other primary radiolytic species are linked by the following equations:
Ge
-aq + GOH-= GH+
Ge
-aq + GH• + 2 GH2 = G•OH + 2 GH2O2 + 3 GHO2•/O2•- , (3)
expressing the charge conservation and material balance of Eq. (1).
The yields of the free radical and molecular species formed in the radiolysis of water change with time, and also depend on the quality of radiation (refer to LET) and the concentration of additive or scavenger. One of the main goals in the study of the radiation chemistry of water is to determine the yields and their dependences on different parameters.
1.4.1 Time scale of events and formation of primary radical and molecular products in neutral water radiolysis:
The series of complex events of decomposition of water by ionizing radiation can be divided consecutively into three stages (PLATZMAN, 1958; KUPPERMANN, 1959). The scheme of time scale of events that occur in the radiolysis of water is clearly shown in
Figure. 1.5 while the detail explanation is given as below:
(i) The “physical stage” consists of the phenomena by which energy from the
incident ionizing radiation (energetic photons, for example, -rays from 60Co or X-ray
photons, or charged particles, such as fast electrons, protons or heavy ions generated by a particle accelerator, or neutron radiation, or high-energy α-particles from suitable radioactive nuclides) is absorbed by the system. Its duration is less than ~10-16 s. The main
consequences are the production of a large number of ionized and electronically excited water molecules, denoted H2O•+ and H2O*elec, respectively, along the path of the radiation.
13 excitation states (PLATZMAN, 1962a) and the collective electronic oscillations of the “plasmon” type (HELLER et al., 1974; KAPLAN and MITEREV, 1987; WILSON et al., 2001). The ionization and excitation event, consecutively, as the earliest processes in the radiolysis of water can be expressed in the equations below,
H2O H2O•+ + e- (4)
H2O H2O*elec (5)
Generally, the electron ejected in the ionization event has sufficient energy to ionize or excite one or more other water molecules in the vicinity, and this leads, as mentioned above, to the formation of track entities, or “spurs”, that contain the products of the events. For low-LET radiation, the spurs are separated by large distances relative to their diameter and the track can be viewed, at this stage, as a random succession of isolated spherical spurs.
(ii) The “physicochemical stage” consists of the processes that lead to the
establishment of thermal equilibrium in the system. Its duration is about 10-12 s for aqueous
solutions. During this stage, the ions and excited-state water molecules dissipate their excess energy by bond rupture, luminescence, energy transfer to neighbouring molecules, etc. The ionized water molecules are unstable. They are allowed to undergo a random walk during their very short lifetime (~10-14 s) (MOZUMDER and MAGEE, 1975) via a
sequence of electron transfer events (about 20, one the average, over a few molecular diameters; (COBUT et al., 1998) from neighbouring water molecules to the H2O•+ hole
(i.e., electron-loss center) (OGURA and HAMILL, 1973). These short-lived H2O•+ radical
cations subsequently decompose to form •OH radicals by transferring a proton to an
adjacent H2O molecule, where H3O+ (or equivalently, H+aq) represents the hydrated
hydrogen ion.
H2O•+ + H2O H3O+ + •OH (6)
The energetic (or “dry”) secondary electrons lose their kinetic energy via a sequence of interactions with the medium until they attain thermal energies (~0.025 eV at 25 ºC) after about 410-14 s (MEESUNGNOEN et al., 2002a). In the course of their
thermalization, “dry” electrons can be recaptured by their parent ions due to the Coulomb attraction of the latter which tends to draw them back together to undergo electron-cation “geminate” recombinationμ
e- + H
2O•+ H2O*vib (7)
As the electron is recaptured, the parent ion is transformed into a (vibrational) excited neutral molecule.
The electron released in the ionization event can cause further ionization and excitation to occur if it has sufficient kinetic energy. Eventually, its energy falls below the first electronic excitation threshold of water (~7.3 eV; see: MICHAUD et al., 1991), forming the so-called “sub excitation electron” (PLATZMAN, 1955). This latter loses the rest of its energy relatively slowly by exciting vibrational and rotational modes of water molecules. Once thermalized (e
-th), it can be localized or “trapped” (then forming the
so-called “wet” electron whose exact physical nature is still the subject of investigation) (e -tr)
in a pre-existing potential energy well of appropriate depth in the liquid before it reaches a fully relaxed, hydrated state (e
-aq) as the dipoles of the surrounding molecules orient under
the influence of the negative charge of the electron. In liquid water at 25 ºC, thermalization, trapping, and hydration can then follow in quick succession in less than ~10-12 s (for
example, see: JAY-GERIN et al., 2008): e- e
-th e-tr e-aq (8)
In the course of its thermalization, the ejected electron can also temporarily be captured by a water molecule to form a transient anion.
e- + H
2O H2O- (9)
Reactions (9) and (10) correspond to the so-called “dissociative electron attachment” (or DEA) process, which has been observed in amorphous solid water at ~20 K for electron energies between about 5 and 12 eV (ROWNTREE et al., 1991). DEA to water was suggested to be responsible, at least in part, for the yield of “nonscavengeable” molecular hydrogen in the radiolysis of liquid water at early times (PLATZMAN, 1962b; FARAGGI and DÉSALOS, 1969; GOULET and JAY-GERIN, 1989; KIMMEL et al., 1994; COBUT et al., 1996). This proposed mechanism for the production of H2 has received strong
support from recent experiments that have shown that the previously accepted nonscavengeable yield of H2 is due to precursors of e-aq and it can be lowered with
appropriate (dry electron) scavengers at high concentration (PASTINA et al., 1999).
Excited molecules may be produced directly in an initial act [reaction (5)] or by neutralization of an ion [reaction (7)]. We have little knowledge about the channels through which the excited water molecules in the liquid phase decay and the branching ratios associated with each of them. Fortunately, the contribution of the water excited states to the primary radical and molecular products in the water radiolysis is of relatively minor importance in comparison with that of the ionization processes, so that the lack of information about their decomposition has only limited consequences. Consequently, the competing deexcitation mechanisms of H2O* are generally assumed to be essentially the
same as those reported for an isolated water molecule (it should be noted here that the same decay processes have been reported to occur for the electronically and vibrationally excited H2O molecules in the gas phase), namely (e.g., see: SWIATLA-WOJCIK and BUXTON,
1995; COBUT et al., 1998; MEESUNGNOEN and JAY-GERIN, 2005a):
H2O* H• + •OH (12a)
H2O* H2 + O(1D) (12b)
H2O* 2 H• + O (3P) (12c)
17
where O(1D) and O(3P) represent oxygen atoms produced in their singlet 1D excited state
and triplet 3P ground state, respectively (see Figure. 1.5). Note that the dissociation of
H2O* via reaction (12a) is the main source of the “initial” (at ~10-12 s, i.e., at the end of the
physicochemical stage, prior to spur or track expansion) yield of hydrogen atoms. As for the different branching ratios (or decay probabilities) associated with reactions (12a-d), they are chosen in order to consistently match the observed picosecond G-values of the various spur species (MUROYA et al., 2002; MEESUNGNOEN and JAY-GERIN, 2005a). It should also be noted here that the O(1D) atoms produced in reaction (12b) react very
efficiently with water to form H2O2 or possibly also 2•OH (TAUBE, 1957; BIEDENKAPP
et al., 1970). By contrast, ground-state oxygen atoms O(3P) in aqueous solution are rather
inert to water but react with most additives (AMICHAI and TEININ, 1969).
(iii) The “nonhomogeneous chemical stage” consists of the period after ~10-12 s,
during which the radiolytic species generated previously in a nonhomogeneous track structure (e
-aq, •OH, H•, H3O+, H2, H2O2, OH-, •O•...) undergo chemical reactions as they
diffuse away from the site where they were originally produced. These species react together to form molecular or secondary radical products, or with dissolved solutes (if any) present at the time of irradiation, until all spur/track reactions are complete. Table 1.1 gives the principal reactions that are likely to occur while the spurs expand. The time for completion of spur processes is generally taken to be ~10-7-10-6 s. By this time, the spatially
nonhomogeneous distribution of reactive species has relaxed. Beyond a few microseconds, the reactions which occur in the bulk solution at room temperature can usually be described with conventional homogeneous chemistry methods (e.g., see: PASTINA and LAVERNE, 2001).
Table 1.1 Main spur/track reactions and rate constants (k) for the radiolysis of pure liquid water at 25 ºC (from MEESUNGNOEN, 2007). Some values of k have been updated by using the most recently available data of ELLIOT and BARTELS (2009).
Reaction k (M-1 s-1) Reaction k (M-1 s-1) H• + H• H2 5.2 109 eaq + eaq H2 + 2 OH 7.3 109 H• + •OH H2O 1.6 1010 e aq + H+ H• 2.1 1010 H• + H2O2 H2O + •OH 3.6 107 e aq+ O2• H2O2 + 2 OH 1.3 1010 H• + e aq H2 +OH 2.8 1010 eaq+ HO2 O• + OH 3.51 109 H• + OH H2O + e aq 2.4 107 eaq+ O• 2 OH 2.31 1010 H• + O2 HO2• 1.3 1010 eaq+ H2O H• + OH 15.8 H• + HO2• H2O2 1.1 1010 eaq+ O2 O2• 2.3 1010 H• + O2• HO2 1.1 1010 e aq+HO2• HO2 1.3 1010 H• + HO2 •OH + OH 1.5 109 eaq+ O(3P) O• 2.0 1010 H• + O(3P) •OH 2.0 1010 e aq+ O3 O3• 3.6 1010 H• + O• OH 2.0 1010 H+ + O• •OH 5.0 1010 H• + O3 O2 + •OH 3.7 1010 H+ + O2• HO2• 5.0 1010 H• + O3• OH + O2 1.0 1010 H+ + OH H2O 1.2 1011 •OH+ •OH H2O2 6.3 109 H+ + O3• •OH+ O2 9.0 1010 •OH+ H2O2 HO2• + H2O 2.9 107 H+ + HO2 H2O2 5.0 1010 •OH+ H2 H• + H2O 4.0 107 OH+ O(3P) HO2 4.2 108 •OH+ e aq OH 3.6 1010 OH+ HO2• O2• + H2O 1.3 1010 •OH+ OH O• + H2O 1.3 1010 O 2 + O• O3• 3.7 109 •OH+ HO2• O2 + H2O 9.0 109 O2 + O(3P) O3 4.0 109 •OH+ O2• O2 + OH 1.1 1010 HO2• + O2• HO2+ O2 9.7 107 •OH+ HO2 HO2• + OH 8.3 109 HO2• + HO2• H2O2 + O2 1.94 108 •OH+ O(3P) HO2• 2.02 1010 HO2• + O(3P) O2 + •OH 2.02 1010 •OH+ O• HO2 1.0 109 HO2• + H2O H+ + O2• 1.4 104 •OH+ O3• O2• + HO2• 8.5 109 O 2• + O• O2 + 2 OH 6.0 108 •OH+ O3 O2 + HO2• 1.11 108 O2• + H2O HO2• + OH 0.155 H2O2 + eaq OH+ •OH 1.1 1010 O2• + O3 O3• + O2 1.5 109 H2O2 + OH HO2+ H2O 1.33 1010 HO2+ H2O H2O2 + OH 1.27 106 H2O2 + O(3P) HO2• + •OH 1.6 109 HO2+ O• O2• + OH 8.02 108 H2O2 + O• HO2• + OH 5.55 108 HO2+ O(3P) O2• + •OH 5.3 109 H2 + O(3P) H• + •OH 4.77 103 O• + O• H2O2 + 2 OH 1.0 108 H2 + O•– H• + OH 1.3 108 O• + O3• 2 O2• 7.0 108 O(3P) + O(3P) O2 2.2 1010 O• + H2O •OH + OH 1.3 106 O(3P) + H2O 2 •OH 1.9 103 O3• + H2O O• + O2 46.5
19 1.5 Tritium (3H) -particle (low energy electron):
Hydrogen-3 or tritium (3H or T) is a radioactive isotope of hydrogen, its nucleus
consists of a proton and two neutrons. The most common chemical form of tritium is tritium oxide, also called “tritiated water” (usually represented as “3HOH”). In tritiated
water, a tritium atom replaces one of the stable hydrogen atoms in the water molecule. The chemical properties of tritium are essentially the same as those of ordinary hydrogen. The tritium atom is unstable with a half-life of 12.3 years.
3H → 3He+ + - + antineutrino (13)
As it decays, 3H is fully disintegrated into a nonradioactive, positively charged
helium-3 with emitting ionizing radiation in the form of -electron whose characteristics are: maximum kinetic energy Emax ~ 18.6 keV,
average kinetic energy released ~ 5.7 keV, shown in Figure 1.6.
maximum range in water at 25 °C is ~ 5.5 µm (~ 6 mm in air, WATT, 1996) mean LET in water ~ 6 keV/µm.
0 2 4 6 8 10 12 14 16 18 0.0 0.2 0.4 0.6 0.8 1.0 Mean energy of tritium decay (~ 5.7 keV) Rel
ative decay probab
ility
Energy (keV)
Generally, the energy of - particles formed through 3H radioactive decay is
sufficient to both ionize (Eion ~ 6.5 ± 0.5 eV for liquid water at 25 °C, GOULET et al.,
1990) and excite water. This interaction between -electrons and water molecules initiates the decomposition of water through the phenomenon called “self-radiolysis”. Tritium, taken into the body and incorporated into cellular structures within or near biologically important molecular sites such as the DNA, might do considerable damage either directly or indirectly through chemical attack by radiolytic products (STRAUME and CARSTEN, 1993; CHAO et al., 2012).
Nevertheless, in our present work, during the simulation of water radiolysis by tritium -particles or low-energy electrons, we consider the energy of 7.8 keV instead of 5.7 keV (average kinetic energy released ~ 5.7 keV, fig. 1.6). The decision of using an energy of 7.8 keV for tritium -electron radiolysis will be elaborated in discussion section. 1.6 A comparison between 3H - particles and 60Co -rays:
The LET of tritium -electrons in water is ~ 20 times greater than that of the Compton electrons (~ 1MeV) generated by 60Co -rays (~0.3 keV/m) (MCCRACKEN et
al., 1998; see also PLANTE et al., 2005). Compared to the chemical effects of 60Co
-radiolysis, which are mainly due to Compton electrons with an initial energy of about 1 MeV, the early physical stage of water radiolysis is very different after irradiation with the low-energy -electrons (18.6 keV maximum) emitted by tritium (3H) (WATT, 1996). This
difference reflects the influence of the electron energy on the initial spatial distribution of all the radiolytic species and free radical intermediates (i.e., the electron track structure) created in the two cases (APPLEBY and GAGNON, 1971; see also GAGNON and APPLEBY, 1971; LEMAIRE et al., 1972; see also LEMAIRE and FERRADINI, 1972; HARIS and PIMBLOTT, 2002; MIRSALEH KOHAN et al., 2013) and the primary events are more separated in the tracks of higher-energy electrons.