B. Buske, I. Sternstein and G. A. Brockmann
Institute for Animal Sciences, Humboldt-Universität zu Berlin, Germany Correspondence: [email protected]
Background
Material and Methods
Results
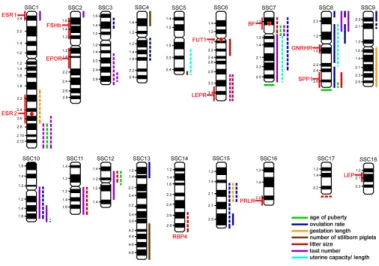
So far, at least 54 quantitative trait loci (QTL) and twelve candidate genes with association for reproductive traits in sows have been identified (Buske et al. 2006; Figure 1). In our approach, the genes encoding Properdin (BF), Glutathione peroxidase 5 (GPX5), Fucosyltransferase 1 (FUT1) and Estrogen receptor 2 (ESR2) were chosen as candidate genes to search for genetic variation influencing prolificacy in two different commercial sow populations. These genes have physiological relevance and are located in chromosomal regions, which have shown genetic effects on prolificacy in crossbreed populations.
Acknowledgement: We thank the H. Wilhelm Schaumann Stiftung (Hamburg, Germany) for the grant for B. Buske
Analysis of candidate genes for prolificacy
in two commercial sow populations
Traits: Total number born (TNB) piglets; Number born alive (NBA) piglets. Animal populations: Population 1: 129 F1-hybrid, paternal half-sib sows
(German Landrace sows x Duroc boar) with at least four litters.
Population 2: 61 F2-sows with extreme high (TNB 15.7±2.2, NBA 14.1±2.1)
and 62 F2-sows with extreme low litter size (TNB 10.4±2.4, NBA 9.8±2.3) of a
cross between (Large White x Landrace) sows x Leicoma boars were selected (second to fourth litter) from a population comprising 447 F2-sows.
All sows were mated with Piétrain boars to produce fattening piglets. Genotyping: Gene tests were adopted from Jiang and Gibson (1998) for BF, Bertani et al. (1999) for GPX5, Klukowska et al. (1999) for FUT1, and Muñoz et al. (2004) for ESR2.
Statistical analyses: In population 1, the effect of genotype on TNB and NBA piglets was studied using analysis of variance (ANOVA).
In population 2, the Chi-square test with the extension of the Fisher`s Exact test was used to test differences in the distribution of genotypes between the two extreme performance groups. Additionally, ANOVA including the Duncan test was used to investigate whether a special genotype was associated with TNB or NBA piglets (Buske et al. 2005).
Table 2. Population 2: Genotype distribution of candidate genes in groups of F2hybrid sows (Large White x Landrace) x Leicoma with extremely high
and low litter size
Concerning the ESR2 gene, an association with NBA piglets was found in
population 1. The FUT1 gene was associated with litter size in population 2,
in which sows of extreme performance groups were genotyped. However, it must be stated that the observed associations may also represent effects of linked genes. The results clearly show that population specific knowledge of gene effects may be helpful for more efficient selection strategies. To evaluate gene effects of candidate genes on litter size parameters more reliably, an improvement would be to perform an additional investigation with planned matings to obtain all genotypes in balanced genotype frequencies in the sow population. Furthermore, a population-wide candidate gene approach with a larger data set would be desirable to avoid overestimation of effects, which can occur by chance in association analyses with comparatively low animal numbers.
Conclusions
Population 1: Significant association of the ESR2 gene variants was found for
NBA piglets of the F1-sows (Table 1). Sows with the AB genotype had on
average 0.68 more NBA piglets than sows with the AA genotype (p=0.034). No BB genotype was detectable, because the sire was AA homozygous. For the other genes, no association with litter size parameters was observed, possibly due to extremely unbalanced genotype frequencies.
Table 1. Population 1: Association analysis between genotypes and litter size parameters (TNB, NBA) for the ESR2 gene in 129 F1 half-sib sows
(German Landrace x Duroc)
a,b LS Means in the same column with different superscripts significantly differ at p<0.05. SE = Standard error; TNB = Total number born piglets; NBA = Number born alive piglets.
∗For each sow, second up to fourth or fifth (when available) litter was analyzed. First litter was ignored.
* Three sows could not be genotyped for the FUT1 gene. ** Significantly different at p< 0.05, Chi-square-test.
Figure 1. QTL and candidate genes with association to prolificacy in pigs
Population 2: The analysis of genotype distribution pattern among F2
hybrid sows with extremely high and low litter size has identified significant differences for the FUT1 gene. The number of sows with the AB genotype was significantly increased in the high performance group in comparison to the low performance group (Table 2). For the BF gene, the A allele was the unfavorable one, leading to significantly less offspring (ANOVA; Duncan test).
References
Bertani, G.R., Marklund, S., Hu, Z.L., Rothschild, M.F. (1999) J. Anim. Sci. 77: 2855-2856. Buske, B., Sternstein, I., Brockmann, G. (2006) Anim. Reprod. Sci. Epub ahead of print.
Buske, B., Brunsch, C., Zeller, K., Reinecke, P., Brockmann, G. (2005) J. Anim. Breed. Genet. 122: 259-263. Jiang, Z.H. and Gibson, J.P. (1998) J. Anim. Sci. 76: 1716-1717.
Klukowska, J., Urbaniak, B., Świtoński, M. (1999) J. Anim. Breed. Genet. 116: 519-524. Muñoz, G., Óvilo, C., Amills, M., Rodríguez, C. (2004) Anim. Genet. 35: 242-244.
Red circles within the chromosome = investigated genes for this study; bold solid lines = level of significance p < 0.05; dashed lines = level of significance p > 0.05; cytogenetic positions of the lines at the end of the chromosomes and for RBP4 were not evaluable.
BF = properdin; ESR1= estrogen receptor 1; ESR2 = estrogen receptor 2; EPOR = erythropoietin receptor; FSHb = follicle stimulating hormone beta; FUT1 = fucosyltransferase 1; GNRHR = gonadotropin releasing hormone receptor; LEP = leptin; LEPR = leptin receptor; PRLR = prolactin receptor; RBP4 = retinol-binding protein 4; SPP1 (OPN) = secreted phosphoprotein 1
Reference: Buske et al. (2006); modified
Genotype No. of sows No. of litters LS Means TNB (≥ 2. litter) SE LS Means NBA (≥ 2. litter) SE AA 42 162 12.02 0.32 10.96a 0.30 AB 87 329 12.60 0.25 11.64b 0.23
Genotype BF GPX5 FUT1* ESR2
Performance Performance Performance Performance Low High Low High Low** High** Low High
AA 3 0 4 3 2 1 8 8
AB 13 7 24 17 11 24 54 53
BB 46 54 34 41 48 34 0 0
As estrogen receptors are important for prolificacy and the investigated polymorphism in the ESR2 gene is located in a coding region leading to the amino acid exchange Met 949 Val, ESR2 can be considered as a potential genetic marker to enhance NBA piglets of sows in future analyses.