Editorial Manager(tm) for Adsorption Manuscript Draft
Manuscript Number: ADSO51R1
Title: Use of x-ray microtomography to visualise dynamic adsorption of organic vapour and water vapour on activated carbon
Article Type: Manuscript
Section/Category:
Keywords: activated carbon; adsorption; tomography; modelling.
Corresponding Author: Dr Ir Angelique Leonard, Dr Ir
Corresponding Author's Institution: University of Liège
First Author: Peter Lodewyckx, Pr Dr Ir
Order of Authors: Peter Lodewyckx, Pr Dr Ir; Silvia Blacher, Dr; Angelique Leonard, Dr Ir
Use of x-ray microtomography to visualise dynamic adsorption of organic
vapour and water vapour on activated carbon
P. Lodewyckx1,*, S. Blacher2, and A. Léonard2
1Royal Military Academy, Department of Chemistry, Renaissancelaan 30, B-1000 Brussels, Belgium
2University of Liège – Dept. Applied Chemistry, Lab. Chemical Engineering – Sart-Tilman B6, B-4000 Liège, Belgium
Abstract:
X-ray microtomography coupled with image analysis was used to quantify the adsorption of vapours on activated carbon beds. This technique was tested using three different challenges: CCl4, water vapour and a mixture of water- and organic vapour. It is
shown that the used technique allows determining the adsorption front progress in the case of organic vapour and mixture of water and organic vapour whereas the existence of this front was not so obvious in the case of water vapour. Experimental results obtained for organic vapours were interpreted on the basis of the Wheeler-Jonas equation: a good agreement was found between experimental and theoretical breakthrough times.
Keywords: activated carbon, adsorption, tomography, modelling
1. Introduction
* E-mail: [email protected] Manuscript
The better knowledge of vapour adsorption dynamics is of high importance for both civil and military protection. When modelling organic vapour adsorption on activated carbon beds, one has to take into account the effects of water-vapour co-adsorption (Lodewyckx and Vansant, 1999, 2000). Both the pre-adsorbed water and the water present in the contaminated air stream can have a deleterious effect on the adsorption capacity of the activated carbon. This explains the renewed interest in the adsorption behaviour of water vapour on activated carbon. A good overview of recent publications in this area can be found in Brennan et al. (2001). However, this attention has been, almost exclusively, focussed on the static adsorption capacity, i.e. the water vapour adsorption isotherm. Even though this static capacity is very important, adsorption (and especially co-adsorption) is essentially a dynamic phenomenon. Apparently, there is no exploitable model available for the kinetics of water adsorption. The existing ones are semi-empirical, usually based on a linear driving force model (Foley et al., 1997; Lodewyckx and Vansant, 1998).
The first purpose of this work is to assess the suitability of x-ray microtomography to follow an adsorption phenomena taking place in activated carbon beds. The very first use of X-ray imaging, in radiography mode, to study adsorption in porous materials was performed by Dubinin et al. (1975). In this pioneer work, they employed X-ray contrast substances to analyse the nature of the mass transfer limiting step, i.e. adsorption in micropores or transport in meso and macropores, in activated carbons. Gravimetric measures were used to determine separately the diffusion coefficients of both transfer mechanisms. X-ray radiographies served as visual supports to explain adsorption kinetics data but no quantification was performed. The X-ray technique was taken up only 15 years after by Wittwer and Lavanchy (1990), to visualise, in a medical tomograph, the adsorption
of organic vapours in activated carbon. To our knowledge, this non-destructive 3D-technique has not been exploited much since the early 90's. During the last decade, the development of microfocus X-ray sources and high resolution CCD detectors led to the commercialisation of microtomographs with improved resolution and large field of applications. The objective of the present study is to contribute to a better understanding of the dynamics of water vapour adsorption by leaning on the local information obtained by x-ray microtomography coupled with image analysis. Though there exist other imaging techniques like magnetic resonance imaging (Bar et al., 2000) or positron emission profiling (Schumacher et al., 2000) providing a much larger wealth of information, they are much more expensive and not as easily accessible as x-ray microtomography.
2. Experimental
2.1. Adsorption set-up
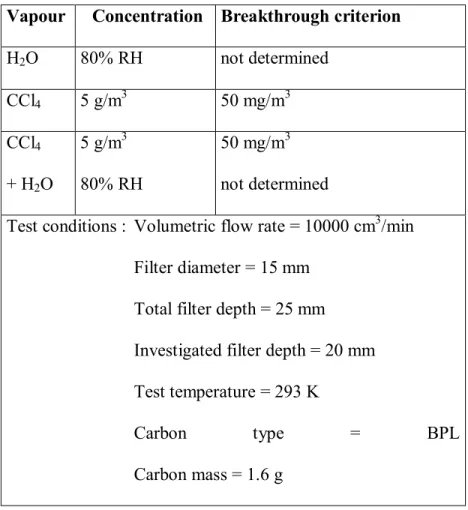
A plastic, cylindrical canister (diameter = 15 mm and height = 25 mm) filled with 1.6 g of BPL activated carbon was used to perform the adsorption tests in a classical breakthrough measurement system. Due to the space limitations in the tomograph, the height and, especially, the diameter of the bed had to be severely reduced compared to filters commonly used. Experiments were conducted successively for CCl4 in dry air, CCl4
in humid air (= water-organic co-adsorption), and humid air at the same temperature and flow rate, as indicated in Table 1. For each test, one out of the three gases was forced through the bed with renewed carbon during 3, 6 and 9 minutes. Tomographic investigations of the beds were performed before and after exposure to the vapours.
2.2. X-ray microtomograph
X-ray microtomography is a powerful non-invasive technique allowing the visualization of the internal texture of a sample based upon local variation of the x-ray attenuation coefficient. It was used to obtain 2-dimensional cross sections images of the carbon bed. During tomographic investigation, an X-ray beam is sent on the sample and the transmitted beam is recorded with a detector. According to Beer-Lambert law, the transmitted intensity is related to the integral of the X-ray attenuation coefficient along the path of the beam, µ. This coefficient µ depends on the material density, ρ, the atomic number of the material, Z, and on the energy of the incident beam, E, according to Eq (1):
+ = a b 33.2.8 E Z ρ µ (1)
where a and b are energy-dependent coefficients (Vinegar and Wellington, 1987). Projections (defined by the assembling of transmitted beams) are recorded for several angular positions by rotating the sample between 0 and 180°. Then a back-projection algorithm is used to reconstruct 2D or 3D images, depending on the method used. In the case of 2D images, each pixel is characterized by a grey level value corresponding to the local attenuation coefficient.
The x-ray tomographic device used in this study was a “Skyscan-1074 X-ray scanner” (Skyscan, Belgium). Advanced technical details about its conception and operation are described by Sasov and Van Dyck (1998). The cone beam source operated at 40 kV and 1 mA. The detector was a 2D, 768 pixels × 576 pixels, 8-bit X-ray camera with a spatial resolution of 41 µm. The rotation step was fixed at the minimum, 0.9°, in order to
improve image quality, giving total acquisition times close to 8 minutes. For each angular position a radiograph of the whole bed, instead of a 1D-projection of a cross section, was recorded by the 2D camera. In contrast to a classical medical scanner, the source and the detector were fixed, while the sample was rotated during the measurement. Once the sample was placed into the microtomograph, the scanning was performed, allowing the investigation of a height of max 25 mm. Cross sections separated by 205 µm were reconstructed along the carbon bed using a cone beam reconstruction software. However, the tomographic images of the bottom part of the filter were cluttered by the construction of the filter. For this reason only the first 20 mm of the filter were used for quantification.
2.3. Image analysis
Image analysis was performed using the Aphelion3.2 (Adsis) software on a PC that allowed implementing algorithms using signal processing and tools from mathematical morphology (Soille, 1999). The developed image analysis algorithm was based on the observation that the grey level intensity of the carbon grains darkens when vapour is adsorbed. Taking this into account, image analysis was performed on each cross section according to the following steps: from original grey-level image cross-section (Fig.1a), a binary mask was automatically constructed (Fig.1b) and used in order to isolate the bed from the background (Fig.1c). Next, the image was eroded to eliminate possible borders effects (Fig.1d). On this last image, the intensity, i.e. the addition of all the pixel values of the grey level image, was calculated. The intensity of the approximately 100 cross-sections images per sample was determined and the result drawn in function of the depth of the sample, i.e. the distance from the inlet of the carbon bed.
3. Results and discussion
3.1 Qualitative results: radiographs observation
Radiographs of the carbon bed in which different gases were adsorbed are shown in Fig 2. From these images two features can be observed: for one, variations of the grey level intensity which represent the adsorption progress and the adsorption front in the case of CCl4, are clearly visible. Secondly, the evolutions of the grey level intensities for CCl4,
water and water-organic vapour adsorption, are visibly not the same which suggests different adsorption mechanisms. To quantify these two qualitative observations, the grey level intensity of successive cross section tomographic images as a function of filter depth was determined, according to the image analysis processing previously described. The intensity (y-axis) in Fig 3.4 and 5 is given in arbitrary units as only the relative difference between the intensity of images at different time intervals is relevant for our study.
3.2 CCl4 adsorption
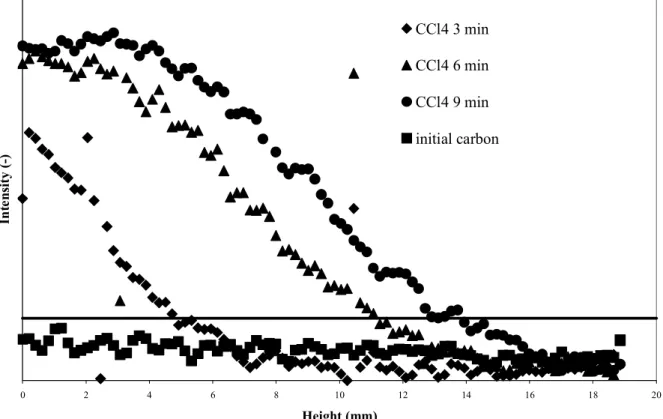
The CCl4 adsorption as a function of time is visualised in Fig 3. The adsorption
proceeds according to the theoretical model of a plug flow, i.e. one can see an adsorption front that moves through the carbon bed. Upstream of this front there is saturation of the carbon (clearly visible after 9 minutes), downstream the carbon is still in its initial state. The existence of a single, constant, front is further proven by the fact that the concentration profiles after 3, 6 and 9 minutes are clearly parallel.
During the experiment the exit concentration of CCl4 was monitored with an
IR-spectrometer Miran 1B2 (Foxboro). Usually the breakthrough criterion for this kind of tests is
taken at 0.1 to 1% of the inlet concentration. However, on the tomographic images it is impossible to distinguish this small amount of CCl4, as it disappears into the clutter of the
baseline (i.e. the carbon before adsorption). Therefore the breakthrough criterion was set at 10%. This is visualised in Fig 3 by the horizontal line at 10% between the baseline and the mean value of the saturation part at 9 minutes. With this criterion, breakthrough of the bed was detected after 12 minutes. This was further verified by modelling the adsorption with the Wheeler-Jonas equation (Eq 2) (Jonas and Rehrmann, 1973) and the annex equations proposed by Wood (1992) and Lodewyckx-Wood (2003).
− ρ − = out out in in v b e in e b c c c ln c k W Q c M W t (2)
These equations have been adequately verified and the resulting breakthrough times are very reliable (less than 10% error margin). As the last picture was taken after 9 minutes, it is impossible to verify the breakthrough time by tomography. Therefore the calculations were repeated for an imaginary filter of 1 cm bed depth. Here the theoretical calculation gives a breakthrough after 6 minutes (rounded up). This is in agreement with Fig 3: it is clear that the front passes the intersection of the 10% line with the 10 mm mark a few seconds before 6 minutes. This means there is a very good agreement between the theoretical and experimental breakthrough times and the tomographic images.
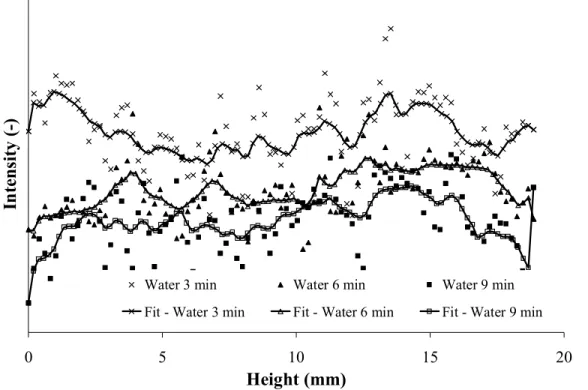
The situation is quite different in the case of pure water vapour adsorption (see Fig 4). The scatter on the data is extremely high. This was already visible on the image itself (Fig 2), where the difference between 3, 6 and 9 minutes is hardly noticeable and there is no visible adsorption front (comparing e.g. Fig 1b with 2b).
In order to extract some information, for each exposure time, a smooth curve was fitted for each point using locally weighted (10% of data) least-squares (Stineman, 1980) (see Fig 4). This kind of curve fit allowed distinguishing if some trend in the adsorption front evolution existed. The obtained smooth curves suggest that: apparently, water vapour adsorption does not show an adsorption front moving through the filter. Instead, the whole bed becomes more and more saturated with adsorbed water. These results are in agreement with previous experiments (Lodewyckx et al., 2005) and breakthrough data (Cosnier et al., 2005). In terms of the plug flow model, described by the Wheeler-Jonas equation, this can be interpreted as a very slow adsorption process, i.e. an extremely low value of the overall mass transfer coefficient kv in equation 1. In the earlier X-ray experiments performed by
Dubinin et al (1975), this was attributed to the diffusion resistance in the adsorption pores, i.e. the micropore system, being much higher than the resistance in the transport pores (macro- and mesopore system). However, they did not provide any explanation for this event. Possibly it is the same phenomenon as for organic vapours for which they demonstrated a clear positive relation between inlet concentration and diffusion control by resistance in the adsorption pores. In the present work, water adsorption experiments being carried out by 80%RH (See Table 1) it is safe to say water vapour inlet concentration was very high. Hence the experimental observation of water adsorption kinetics being
apparently determined by micropore resistance (surface diffusion) could be a direct effect of this high inlet concentration.
3.4 Water-organic vapour co-adsorption
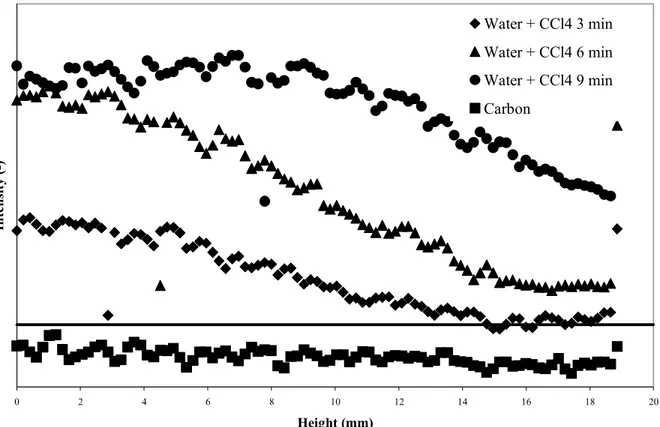
The results of water-organic vapour co-adsorption are represented in Fig 5. The image is very clear, and the adsorption front is visible. The interpretation however is not straightforward: the density change is due to both adsorbed organic vapour and water, and it is difficult to make a distinction between both phases. This is confirmed by comparing Fig 5 with the experimental and calculated breakthrough times. For the latter we used an adapted version of the Wheeler-Jonas equation in order to include the effects of water vapour co-adsorption. In this model the capacity (We) and kinetic (kv) parameters of Eq. 2
are not considered to be constants. They depend on the amounts of water present on the carbon and in the air stream as these will compete with the organic vapour for available adsorption space (Lodewyckx and Vansant, 1999, 2000). The tomographic image shows a “breakthrough” between 3 and 6 minutes. Experimentally, the breakthrough of CCl4 under
these conditions of relative humidity was detected after 8 minutes. The same result was obtained by the simulation. Clearly, there is a difference of 50 to 100% with the breakthrough of the front obtained from the tomographic images. Hence we can conclude that this front, although apparently a CCl4 front (comparing Figs 5, 4 and 3) is in fact a
mixed front. This could also explain its broadness: the front is clearly broader than in the case of pure CCl4, even though it is still visible, thus steeper than in the case of pure water
case for pure CCl4, the concentration profiles after 3, 6 and 9 minutes are almost parallel,
even though their slope it quite different from the one in Fig 3.
4. Conclusions
The results presented in this work show that x-ray microtomography coupled with image analysis constitutes a very promising technique to visualise and quantify the adsorption of vapours on activated carbon. Especially in the case of organic vapours, such as CCl4, one gets a clear image of the macroscopic adsorption process. It is however
difficult to use this technique to determine breakthrough of the bed, especially at low concentration.
In the case of water vapour adsorption, the observations seem to indicate another type of phenomenon with progressive water uptake through the bed: this apparent dependence of water vapour adsorption kinetics on micropore resistance needs further investigation. The water vapour adsorption images are however consistent with previous experiments and breakthrough data. Some of the differences could also result from the limited sensitivity of the used tomograph versus adsorbed water. Indeed, a better contrast is obtained with organic vapours characterized by higher densities than water.
One possible way to confirm these results is the use of an x-ray microtomograph with higher resolution (down to 5 µm) and extended possibilities in term of X-ray energy selection, in order to improve image quality and to get a better discrimination between the phases, i.e. water, organic and carbon, by applying a more sophisticated image analysis procedure. This will also be helpful for the interpretation of co-adsorption images, which remains difficult for the time being, in order to correlate with breakthrough data. Another
possibility consists in increasing the number of images (e.g. every minute in stead of every three minutes) and the amount of carbon in order to obtain more information that can show general trends. It will also be very interesting to perform a tomographic investigation very shortly after the start of the experiment: breakthrough curve analysis (Cosnier et al., 2005) has shown the presence of an adsorption front for water adsorption, but only at the very start of the experiment. After this initial phase all known experiments show the adsorption behaviour that is exhibited in Fig 4.
Acknowledgements
The authors wish to thank the technicians of the Belgian Defence Laboratories (DLD), for their much appreciated help with the experimental part of this work, as well as CHEMVIRON (Belgium) for kindly providing the carbon samples.
A. Léonard is indebted to the Belgian Fonds National de la Recherche Scientifique (FNRS) for a position of Postdoctoral Researcher.
S. Blacher acknowledges the ALFA Program of the E.U. (project ALFA II 0412 FA FI) for enabling fruitful exchanges.
Nomenclature
µ = x-ray linear attenuation coefficient, 1/m ρ = bulk density, kg/m³
a = energy-dependent coefficient, [-] b = energy-dependent coefficient, [-]
cin = contaminant concentration in air, g/cm3
cout = chosen breakthrough concentration, g/cm3
kv = overall adsorption rate coefficient, 1/min
E = X-ray energy, kV
M = weight of the carbon bed, gcarbon
Q = volumetric flow rate, cm3/min tb = breakthrough time to reach cout , min
We = equilibrium adsorption capacity, g/gcarbon
References
Bar, N.-K. and B.J.R.D.M Balcom, "Direct Measurement of Transient Concentration Profiles in Molecular Sieve Particles and Columns by MRI", Adsorption Science and Technology, D.D. Do (ed), pp. 6-13, World Scientific, Singapore, 2000.
Brennan, J.K., T.J. Bandosz, K.T. Thomson and K.E. Gubbins, "Water in porous carbons," Colloid Surface A, 187-188, 539-568 (2001).
Cosnier, F., A. Celzard, G. Furdin, Bégin D. and J.F. Marêché, "Influence of water on the dynamic adsorption of chlorinated VOCs on activated carbon: relative humidity of the gas phase versus pre-adsorbed water," Proceedings of Carbon 2005, Gyeongju, Korea, July 3-7, 2005.
Dubinin, M.M., I.T. Erashko, O. Kadlec, V.I. Ulin, A.M. Voloshchuk and P.P. Zolotarev, "Kinetics of physical adsorption by carbonaceous adsorbents of biporous structure," Carbon, 13, 193-200 (1975).
Foley, N.J., K.M. Thomas, P.L. Forshaw, D. Stanton and P.R. Norman, "Kinetics of Water Vapor Adsorption on Activated Carbon," Langmuir, 13, 2083-2089 (1997).
Jonas, L.A. and J.A. Rehrmann, "Predictive equations in gas adsorption kinetics," Carbon,
11, 59-64 (1973).
Lodewyckx, P., A. Léonard and S. Blacher, "The use of tomography to determine the kinetics of water vapour adsorption," Proceedings of Carbon 2005, Gyeongju, Korea, July 3-7, 2005, (2005)
Lodewyckx, P. and E.F. Vansant, "The dynamic adsorption of water vapour on activated carbon," Carbon, 36, 304 (1998).
Lodewyckx, P. and E.F. Vansant, "Influence of humidity on adsorption capacity from the Wheeler-Jonas model for prediction of breakthrough times of water immiscible organic vapors on activated carbon beds," AIHA J., 60, 612-617 (1999).
Lodewyckx, P. and E.F. Vansant, "The influence of humidity on the overall mass transfer coefficient of the Wheeler-Jonas equation," AIHA J., 61, 461-468 (2000).
Sasov, A. and D. Van Dyck, "Desktop X-ray microscopy and microtomography," J. Microsc., 191, 151-158 (1998).
Schumacher, R.R., B.G. Anderson, N.J. Noordhoek, F.J.M.M. de Gauw, A.M. de Jong, M.J.A. de Voigt and R.A. van Santen, "Tracer-exchange experiments with positron emission profiling: diffusion in zeolites," Microporous and Mesoporous Materials, 35-36, 315-326 (2000).
Soille, P., Morphological Image Analysis – Principles and Applications, Springer-Verlag, New York, (1999).
Stineman, R.W., "A consistently well-behaved method of interpolation," Creative Comput.,
6, 54-57 (1980).
Vinegar, H.J. and S.L. Wellington, "Tomographic imaging of three-phase flow experiments," Rev. Sci. Instrum., 58, 96-107 (1987).
Wittwer, A. and A. Lavanchy, "X-ray computer tomography: A non destructive method to investigate dynamic sorption processes on activated carbon," Proceedings of the International Carbon Conference, Paris, France, 1990, 102-103, (1990).
Wood, G.O., "Activated carbon adsorption capacities for vapors," Carbon, 30, 593-599 (1992).
Wood, G.O. and P. Lodewyckx, "An extended equation for rate coefficients for adsorption of organic vapors and gases on activated carbons in air-purifying respirator cartridges," AIHA Journal: a Journal For The Science Of Occupational And Environmental Health And Safety, 64, 646-650 (2003).
Figure 1. Image analysis processing - a. original cross section image b. binary mask c. elimination of background d. erosion of the image to exclude border effects.
aaaa bbbb
(1a) (1b) (1c)
(2a) (2b) (2c)
(3a) (3b) (3c)
Figure 2. Radiographs of the carbon bed during adsorption of CCl4 (1), H2O (2) and CCl4 +
H2O (3). Respectively after 3 (a), 6 (b) and 9 minutes (c). Comparison with “virgin”
0 2 4 6 8 10 12 14 16 18 20 Height (mm) In te ns ity (-) CCl4 3 min CCl4 6 min CCl4 9 min initial carbon
Figure 3. Intensity (arbitrary units) versus bed depth for different exposure times to pure CCl4 in dry air.
0 5 10 15 20 Height (mm) In te ns ity (-)
Water 3 min Water 6 min Water 9 min
Fit - Water 3 min Fit - Water 6 min Fit - Water 9 min
Figure 4. Intensity (arbitrary units) versus bed depth for different exposure times to pure water vapour (80% RH) in air.
0 2 4 6 8 10 12 14 16 18 20 Height (mm) In te ns ity (-) Water + CCl4 3 min Water + CCl4 6 min Water + CCl4 9 min Carbon
Figure 5. Intensity (arbitrary units) versus bed depth for different exposure times to CCl4 in
Table 1. Experimental conditions for the H2O, CCl4 and CCl4+H2O dynamic adsorption
experiments.
Vapour Concentration Breakthrough criterion
H2O 80% RH not determined CCl4 5 g/m3 50 mg/m3 CCl4 + H2O 5 g/m3 80% RH 50 mg/m3 not determined
Test conditions : Volumetric flow rate = 10000 cm3/min Filter diameter = 15 mm
Total filter depth = 25 mm Investigated filter depth = 20 mm Test temperature = 293 K
Carbon type = BPL Carbon mass = 1.6 g
ANSWER TO REVIEWER 1 Rem. 1
From my perspective, this is an important aspect supporting publication: Though other imaging techniques like magnetic resonance imaging (Bär, N.-K.; Balcom, B. J.; Ruthven, D. M., Direct Measurement of Transient Concentration Profiles in Molecular Sieve Particles and Columns by MRI. In Adsorption Science and Technology, ed.; Do, D. D., World Scientific: Singapore, 2000; 6-13) or positron emission profiling (Schumacher, R. R.; Anderson, B. G.; Noordhoek, N. J.; de Gauw, F. J. M. M.; de Jong, A. M.; de Voigt, M. J. A.; van Santen, R. A., Tracer-Exchange Experiments with Positron Emission Profiling: Diffusion in Zeolites. Microporous Mesoporous Mater. 2000, 6, 315-326) provide a much larger wealth of information, they are much more expensive and not as easily accessible as x-ray monitoring. We found the first comment of the Reviewer so interesting that we decided to include it in the introduction of the paper.
Rem. 2
The authors might like to refer to the fact that the very first investigations of x-ray imaging - probably not only with carbons - have been performed by Dubinin and co-workers (Dubinin, M. M.; Erashko, I. T.; Kadlec, O.; Ulin, V. I.; Voloshchuk, A. M.; Zolotarev, P. P., Kinetics of Physical Adsorption by Carbonaceous Adsorbents of Biporous Structure. Carbon 1975, 13, 193-200). A short presentation of these studies (as well as of other imaging techniques) may also be found in the textbook "Diffusion in Zeolites" by J. Kärger and D. M. Ruthven.
We added some sentences about the work of Dubinin et al. in the introduction part.
“The first purpose of this work is to assess the suitability of x-ray microtomography to follow an adsorption phenomena taking place in activated carbon beds. The very first use of X-ray imaging, in radiography mode, to study adsorption in porous materials was performed by Dubinin et al. (1975). In this pioneer work, they employed X-ray contrast substances to analyse the nature of the mass transfer limiting step, i.e. adsorption in micropores or transport in meso and macropores, in activated carbons. Gravimetric measures were used to determine separately the diffusion coefficients of both transfer mechanisms. X-ray radiographies served as visual supports to explain adsorption kinetics data but no quantification was performed.”
Rem. 3
In chapter 3.3 of the MS, two limiting cases of adsorption front propagation are discussed, viz. the simultaneous uptake by the whole bed or subsequent filling of adjacent particles in the bed (leading to a genuine front propagation). In the above cited references, these limiting cases have been attributed to uptake limitation by the individual particles constituting the bed (case of low intra-particle diffusivity) and to bed limitation (i.e. low bed ("long-range") diffusivity), respectively. Is such a simplistic (and, hence, very helpful and instructive) view also possible in the given case?
We agree with the suggestion of the Reviewer. According to this comment and the work of Dubinin et al., the following paragraph was added in the text:
“In the earlier X-ray experiments performed by Dubinin et al (1975), this was attributed to the diffusion resistance in the adsorption pores, i.e. the micropore system, being much higher than the resistance in the transport pores (macro- and mesopore system). However, they did not provide any explanation for this event. Possibly it is the same phenomenon as for organic vapours for which they demonstrated a clear positive relation between inlet concentration and diffusion control by resistance in the adsorption pores. In the present work, water adsorption experiments being carried out by 80%RH (See Table 1) it is safe to say water vapour inlet concentration was very high. Hence the experimental observation of water adsorption kinetics being apparently determined by micropore resistance (surface diffusion) could be a direct effect of this high inlet concentration.”
ANSWER TO REVIEWER 2 Rem. 1
Page 2, line 10: adsorption is also a dynamic process, not only co-adsorption; this sentence should be re-phrased
According to this comment, the sentence was modified in this way:
“Even though this static capacity is very important, adsorption (and especially
co-adsorption) is essentially a dynamic phenomenon.” Rem. 2
It seems that the technique used is less sensitive on the amount adsorbed. It is possible to distinguish adsorption of organic vapor from adsorption of water vapor, however profiles for adsorption of organic in presence of water vapor seem to be similar to those for organic vapor. Thus, this technique may be less convenient to monitor adsorption process of organics in presence of water. A comment on this subject would be desirable.
We totally agree with the comment of the reviewer. This is the reason why we dedicated a paragraph to this sensitivity problem in our conclusions. Nevertheless we add some more in that sense:
“Some of the differences could also result from the limited sensitivity of the used tomograph versus adsorbed water. Indeed, a better contrast is obtained with organic vapours
characterized by higher densities than water.
One possible way to confirm these results is the use of an x-ray microtomograph with higher resolution (down to 5 µm) and extended possibilities in term of X-ray energy selection, in order to improve image quality and to get a better discrimination between the phases, i.e.
water, organic and carbon, by applying a more sophisticated image analysis procedure. This
will also be helpful for the interpretation of co-adsorption images, which remains difficult for the time being, in order to correlate with breakthrough data.”