The VLT-FLAMES Tarantula Survey
?
XXIX. Massive star formation in the local 30 Doradus starburst
F. R. N. Schneider
1, O. H. Ramírez-Agudelo
2, F. Tramper
3, J. M. Bestenlehner
4,5, N. Castro
6, H. Sana
7, C. J. Evans
2,
C. Sabín-Sanjulián
8, S. Simón-Díaz
9,10, N. Langer
11, L. Fossati
12, G. Gräfener
11, P. A. Crowther
5, S. E. de Mink
13,
A. de Koter
13,7, M. Gieles
14, A. Herrero
9,10, R. G. Izzard
14,15, V. Kalari
16, R. S. Klessen
17, D. J. Lennon
3, L. Mahy
7,
J. Maíz Apellániz
18, N. Markova
19, J. Th. van Loon
20, J. S. Vink
21, and N. R. Walborn
22,??1 Department of Physics, University of Oxford, Denys Wilkinson Building, Keble Road, Oxford OX1 3RH, UK
e-mail: [email protected]
2 UK Astronomy Technology Centre, Royal Observatory Edinburgh, Blackford Hill, Edinburgh EH9 3HJ, UK
3 European Space Astronomy Centre, Mission Operations Division, PO Box 78, 28691 Villanueva de la Cañada, Madrid, Spain 4 Max-Planck-Institut für Astronomie, Königstuhl 17, 69117 Heidelberg, Germany
5 Department of Physics and Astronomy, Hicks Building, Hounsfield Road, University of Sheffield, Sheffield S3 7RH, UK 6 Department of Astronomy, University of Michigan, 1085 S. University Avenue, Ann Arbor, MI 48109-1107, USA 7 Institute of Astrophysics, KU Leuven, Celestijnenlaan 200D, 3001 Leuven, Belgium
8 Departamento de Física y Astronomía, Universidad de La Serena, Avda. Juan Cisternas 1200, Norte, La Serena, Chile 9 Instituto de Astrofísica de Canarias, 38205 La Laguna, Tenerife, Spain
10 Departamento de Astrofísica, Universidad de La Laguna, 38206 La Laguna, Tenerife, Spain 11 Argelander-Institut für Astronomie der Universität Bonn, Auf dem Hügel 71, 53121 Bonn, Germany 12 Austrian Academy of Sciences, Space Research Institute, Schmiedlstraße 6, 8042 Graz, Austria
13 Astronomical Institute Anton Pannekoek, Amsterdam University, Science Park 904, 1098 XH Amsterdam, The Netherlands 14 Department of Physics, Faculty of Engineering and Physical Sciences, University of Surrey, Guildford GU2 7XH, UK 15 Institute of Astronomy, The Observatories, Madingley Road, Cambridge, CB3 0HA, UK
16 Departamento de Astronomía, Universidad de Chile, Camino El Observatorio 1515, Las Condes, Santiago, Casilla 36-D, Chile 17 Institut für Theoretische Astrophysik, Zentrum für Astronomie der Universität Heidelberg, Albert-Ueberle-Str. 2, 69120
Heidelberg, Germany
18 Centro de Astrobiología, CSIC-INTA, ESAC campus, camino bajo del castillo s/n, 28 692 Villanueva de la Cañada, Spain 19 Institute of Astronomy with National Astronomical Observatory, Bulgarian Academy of Sciences, PO Box 136,
4700 Smoljan, Bulgaria
20 Lennard-Jones Laboratories, Keele University, Staffordshire ST5 5BG, UK 21 Armagh Observatory, College Hill, Armagh BT61 9DG, UK
22 Space Telescope Science Institute, 3700 San Martin Drive, Baltimore, MD 21218, USA
Received 15 May 2018/ Accepted 3 July 2018
ABSTRACT
The 30 Doradus (30 Dor) nebula in the Large Magellanic Cloud (LMC) is the brightest HII region in the Local Group and a prototype starburst similar to those found in high redshift galaxies. It is thus a stepping stone to understand the complex formation processes of stars in starburst regions across the Universe. Here, we have studied the formation history of massive stars in 30 Dor using masses and ages derived for 452 mainly OB stars from the spectroscopic VLT-FLAMES Tarantula Survey (VFTS). We find that stars of all ages and masses are scattered throughout 30 Dor. This is remarkable because it implies that massive stars either moved large distances or formed independently over the whole field of view in relative isolation. We find that both channels contribute to the 30 Dor massive star population. Massive star formation rapidly accelerated about 8 Myr ago, first forming stars in the field before giving birth to the stellar populations in NGC 2060 and NGC 2070. The R136 star cluster in NGC 2070 formed last and, since then, about 1 Myr ago, star formation seems to be diminished with some continuing in the surroundings of R136. Massive stars within a projected distance of 8 pc of R136 are not coeval but show an age range of up to 6 Myr. Our mass distributions are well populated up to 200 M . The
inferred IMF is shallower than a Salpeter-like IMF and appears to be the same across 30 Dor. By comparing our sample of stars to stellar models in the Hertzsprung–Russell diagram, we find evidence for missing physics in the models above log L/L = 6 that
is likely connected to enhanced wind mass loss for stars approaching the Eddington limit. Our work highlights the key information about the formation, evolution and final fates of massive stars encapsulated in the stellar content of 30 Dor, and sets a new benchmark for theories of massive star formation in giant molecular clouds.
Key words. stars: formation – stars: massive – stars: luminosity function, mass function – Magellanic Clouds – galaxies: star clusters: individual: 30 Doradus
? Based on observations collected at the European Southern Observatory under programme ID 182.D-0222. ?? We regret to inform that Dr Nolan Walborn passed away earlier this year.
within 30 Dor. Schneider et al.(2018) have further shown that 30 Dor formed an excess of massive stars (≥30 M ) compared to
a Salpeter-like stellar initial mass function (IMF;Salpeter 1955). At a distance of 50 kpc (Pietrzy´nski et al. 2013), 30 Dor is a unique star-forming region that allows us to study massive star evolution, star formation and cluster evolution in great detail. It is a template for distant, unresolved starbursts and can be used to explore their role in galaxies and the overall cosmos.
For example, the integrated spectrum of the central NGC 2070 region shows similar nebular emission characteris-tics to so-called Green Pea galaxies (Cardamone et al. 2009), and its size and star-formation rate are comparable to knots and clumps of intense star formation in high redshift galaxies (Crowther et al. 2017). Some Green Pea galaxies are Lyman con-tinuum leakers that have escape fractions of ionising radiation of up to 50% (e.g.Izotov et al. 2016,2018;Jaskot et al. 2017) and their high-redshift counterparts have therefore been suggested to play an important role for the reionisation of the Universe. Chevance et al.(2016) model the radiation field and gas density in 30 Dor and find a highly porous interstellar medium surround-ing R136 that allows hard photons to reach large distances from the ionising cluster.Doran et al.(2013) estimate an escape frac-tion of ionising photons from 30 Dor of 6+55−6%.
The central R136 star cluster has further been suggested to be a young counterpart of relatively low-mass globular clusters (e.g. Kennicutt & Chu 1988; Meylan 1993; O’Connell et al. 1994; Hunter et al. 1995;Andersen et al. 2009;Bosch et al. 2009) and the star formation and stellar populations in this region may pro-vide insights for our understanding of multiple main-sequences and abundance anomalies observed in globular clusters (see e.g. Gratton et al. 2012;Bastian & Lardo 2018;Rahner et al. 2018). 30 Dor therefore offers the unique possibility to understand the star formation process of giant starbursts across the Universe.
The 30 Dor nebula is a huge and complex star-forming region that has produced stars over the last ≈30 Myr (e.g. Walborn & Blades 1997;Grebel & Chu 2000; De Marchi et al. 2011;Cignoni et al. 2015). Its main constituents are the star clus-ters R136 in the central NGC 2070 region, Hodge 301, SL 639 and NGC 2060, which further hosts the TLD 1 star cluster. Star formation in 30 Dor is currently further explored in detail within the Hubble Tarantula Treasury Project (Sabbi et al. 2013,2016; Cignoni et al. 2015;Ksoll et al. 2018), a panchromatic imaging survey of 30 Dor using the Hubble Space Telescope, and the heart of 30 Dor has been dissected with the Multi Unit Spec-troscopic Explorer (MUSE) on the Very Large Telescope (VLT; Crowther et al. 2017;Castro et al. 2018).
1 http://messier.obspm.fr/xtra/ngc/n2070.html
unprecedented sample of early-type stars in one of the largest, resolved starburst regions in the local Universe. In combina-tion with stellar evolucombina-tionary models and sophisticated statistical methods,Schneider et al.(2018) used this dataset to determine fundamental stellar parameters such as initial mass and age for each star, and thereby derive the star formation history and initial mass function in 30 Dor. Here, we utilise the inferred ages and masses to further our understanding of the star formation process in 30 Dor and in similar starbursts across cosmic history.
This paper is structured as follows. In Sect. 2, we briefly explain how the atmospheric parameters and the ages and masses of individual stars are determined. We further show how we compute age and mass distributions from these parameters to shed light on the star formation process in 30 Dor. In Sect.3, we describe our sample stars with respect to stellar models, the inferred age and mass distributions of massive stars in various sub-regions of 30 Dor, the spatial distribution of stellar ages and masses, and the derived IMFs. The emerging picture of the over-all star formation process is discussed in Sect.4and our main conclusions are summarised in Sect.5.
2. Methods
Obtaining age and mass distributions of the VFTS stars in 30 Dor is a three stage process. First, the observed spectra are modelled with stellar atmosphere codes to determine spectro-scopic parameters such as surface gravity, effective tempera-ture and luminosity. Second, the spectroscopic parameters are matched against stellar evolutionary models to determine the ages and initial masses of each star. Third, the inferred ages and masses are combined to finally infer distributions of age and ini-tial mass of various samples of the VFTS stars. The first two steps have been completed in Schneider et al. (2018) and we only briefly describe the most important aspects here.
Stars with composite spectra, for example due to binary stars or visual multiples, have been removed from our sam-ple. Binaries are identified thanks to the multi-epoch nature of VFTS (Sana et al. 2013; Dunstall et al. 2015) and visual mul-tiples and nearby contaminating sources by comparison of the position of the FLAMES fibres on the sky with Hubble-Space-Telescope photometry (GO12499, PI: D. Lennon;Walborn et al. 2014;Dunstall et al. 2015). We further exclude those stars for which it is not possible to obtain reliable spectroscopic param-eters or to find stellar models that reproduce all observables within their uncertainties simultaneously. Also, stars cooler than 9000 K have been removed from our sample because it is di ffi-cult to obtain robust ages and masses from their position in the Hertzsprung–Russell (HR) diagram alone. There are at most four
our results and conclusions (see Sect.3.1).
We will now briefly describe how we determine stellar parameters (Sect. 2.1), age and mass distributions (Sect. 2.2), and which completeness corrections have been applied to cor-rect for biases introduced by our sample selection (Sect. 2.3). For more details and a full list of stellar parameters see Schneider et al.(2018) and Table S3 therein.
2.1. Determination of stellar parameters
The observed VFTS spectra have been analysed in several steps, depending on spectral type and luminosity class. The hydrogen-rich Wolf–Rayet (WNh) and slash stars are mod-elled inBestenlehner et al.(2014), the O-type giants and super-giants in Ramírez-Agudelo et al. (2017), the O-type dwarfs in Sabín-Sanjulián et al. (2014, 2017), the B-type supergiants in McEvoy et al. (2015), and the B-type dwarfs, classical Wolf–Rayet stars and cool-type stars (A-type and later) in Schneider et al. (2018). For each star, we usually match the inferred effective temperature, surface gravity, luminosity and projected rotational velocity against the stellar models of Brott et al.(2011) and Köhler et al.(2015) using the Bayesian code BONNSAI2(Schneider et al. 2014b,2017) to determine full posterior probability distributions of age and initial mass. The above mentioned atmospheric parameters are not always all available and Table S3 in Schneider et al.(2018) contains the exact atmospheric parameters that have been used to match indi-vidual stars against the stellar models. We assume uniform prior distributions for age and initial mass, use the observed rotational velocity distributions of OB stars (Ramírez-Agudelo et al. 2013; Dufton et al. 2013) as initial rotational velocity prior distribu-tion, and assume that rotational axes are randomly orientated in space. Post main-sequence (MS) stars are not covered by the stellar models ofBrott et al.(2011) andKöhler et al.(2015), and the inference of their masses and ages requires special proce-dures (see Schneider et al. 2018, for more details). This holds true for so-called Hertzsprung-gap (HG) stars that left the main-sequence and evolve on a thermal timescale across the HR dia-gram to the red (super)giant branch, and for classical WR stars.
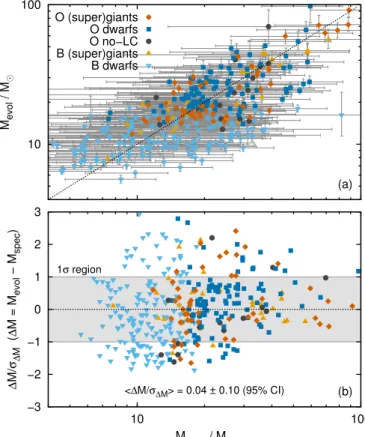
The present-day evolutionary masses determined by match-ing all available observables against stellar models are, on average, in agreement with the spectroscopic masses, Mspec= 1/(4πσG) (gL/Te4ff), derived directly from surface
grav-ity g, effective temperature Teff and luminosity L (see
AppendixA). This is a consistency check of our methods and shows that the inferred stellar parameters are on average robust.
2.2. Determination of age and mass distributions
Once we have full posterior probability distributions of the ages and masses of each star, we sum them to obtain age and mass distributions of samples of stars. We apply completeness correc-tions (Sect.2.3) to correct for biases introduced by our sample selection. Using a bootstrap technique, we estimate 1σ uncer-tainties of our age and mass distributions that allow us to judge the significance of individual features in the distributions. The uncertainties are the standard deviations of 10 000 realisations of age and mass distributions of stellar populations that have been
2 The BONNSAI web-service is available at http://www.astro.
uni-bonn.de/stars/bonnsai
Our inferred age and mass distributions are not star for-mation histories (SFHs) and initial mass functions (IMFs), respectively, because our distributions do not account for those stars that already ended their nuclear burning lifetime. In Schneider et al.(2018), we describe how to correct for such stars and infer the true SFH and IMF. Here, we use the same tech-niques to also infer the IMF in distinct sub-regions of 30 Dor.
2.3. Completeness corrections
The VFTS was designed to observe as many stars as pos-sible with V-band magnitudes brighter than V= 17 mag with the FLAMES instrument (Evans et al. 2011). Because of the use of the FLAMES fibres, very crowded regions such as the core region around the R136 star cluster were avoided (see Fig. 2 below and, in particular, Fig. 4 for the position of VFTS targets near the crowded R136 star cluster), but there are no further biases. Currently, it is unknown how many mas-sive stars have been missed in this crowded region and it is difficult to assess the completeness of the VFTS. Follow-up spectroscopy with the Hubble Space Telescope (Crowther et al. 2016) revealed at least 57 O-stars in the cluster core, within 0.5 pc of R136a1. Ongoing efforts with VLT MUSE will soon give a much clearer picture of the massive star content in the central region of NGC 2070 (Castro et al. 2018;Crowther et al. 2017). As shown in Schneider et al.(2018), the completeness of the VFTS with respect to a more complete census of stars in 30 Dor (Doran et al. 2013), is independent of V-band magni-tude, indicating an unbiased target selection. The spectroscopic completeness of theDoran et al.(2013) census is estimated to be about 85% outside 5 pc and about 35% within the R136 region. However, our sample selection, for example against binaries, introduces biases that we need to correct for. As described in Schneider et al. (2018), we apply four corrections when con-structing age and mass distributions: Firstly, our sample selec-tion introduce a completeness that varies with spectral types and luminosity class, which we correct for. Secondly, because crowded regions were avoided, we apply an averaged spatial completeness correction as a function of distance from the R136 cluster core that utilises the more complete census of stars in 30 Dor of Doran et al. (2013) as reference. Thirdly, a subset of stars in the VFTS were observed with the ARGUS instru-ment instead of FLAMES (Evans et al. 2011). However, only six emission line objects of the 37 VFTS ARGUS targets have yet been analysed, introducing a bias towards emission line stars which we correct for. Fourthly, the sample ofBestenlehner et al. (2014) contains the massive (≈190 M ) supergiant Mk 42 which
we remove from our sample because it has not been included in the VFTS. Including this object in our discussion might intro-duce a bias which we want to avoid. These four corrections hardly change our derived age and mass distributions, and hence our results and conclusions are robust (see AppendixB).
3. Results
Overall, there are 934 stars in the VFTS of which 487 (52%) are in our final sample (after removing identified binaries, mul-tiple systems, stars with contaminated spectra etc.); of these 487 stars, 35 (7%) cannot be reproduced by the used stellar models, leaving us with a sample of 452 stars with robust stellar param-eters. Our final sample of 452 stars comprises 13 hydrogen-rich Wolf–Rayet and slash stars, four classical Wolf–Rayet stars,
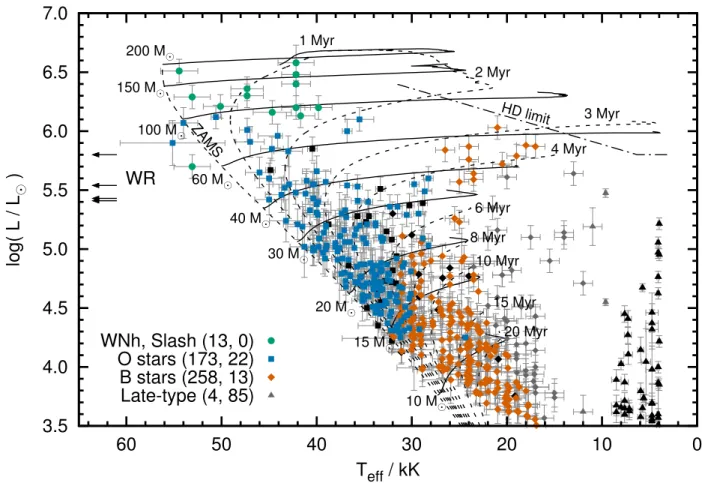
lution of massive stars across a wide range of masses and evolu-tionary stages. Since the VFTS sample is magnitude limited, we find a temperature-dependent cut-off in the HR diagram at effec-tive temperatures Teff. 30 kK and luminosities log L/L . 4.0.
The empirical ZAMS seems to coincide with that of the mod-els but we note that our sample lacks stars younger than ≈1 Myr (Sect.4). This lack results in a sparsely populated region in the HR diagram between the ZAMS, the 1 Myr isochrone and the 30 and 100 M stellar tracks.
There is a clear dearth of stars at effective temperatures of about 18–9 kK that seems to extend up to the Humphreys– Davidson (HD) limit (Humphreys & Davidson 1979) at around log L/L ≈ 5.9. This dearth of stars is where stellar models
pre-dict the so-called Hertzsprung-gap that, in the past, was often found to be densely populated with blue supergiants, giving rise to the blue-supergiant problem (e.g.Blaha & Humphreys 1989; Fitzpatrick & Garmany 1990). The VFTS sample is unbiased for stars with initial masses ≥15 M , implying that the lower star
density around Teff≈ 15 kK and log L/L & 4.8 compared to the
higher star density towards the MS is not due to a selection bias. The star-formation rate in 30 Dor accelerated 8–10 Myr ago (Schneider et al. 2018), reducing the number densities on the cooler and lower luminosity side of the 8–10 Myr isochrone in the HR diagram. For stars less massive than 15 M , our
sam-ple becomes incomsam-plete such that the number densities are not a reliable indicator of stellar physics or star formation. However, even in this regime, we do find a gap of stars at Teff≈ 13 kK in
the HR diagram that separates the red supergiant branch from the main sequence. A gap in the SFH would produce a reduced stellar density along an isochrone, but not such a gap. It there-fore seems that the blue-supergiant problem and the lack of a Hertzsprung-gap are less severe with the current data and stellar models.
The terminal-age main-sequence (TAMS) of the models does not coincide with the beginning of the Hertzsprung-gap but seems to be slightly hotter. Convective core overshooting plays an important role in determining the position of the TAMS and our data may suggest that the models require more overshooting than is currently used (see also discussion in the VFTS predeces-sor survey, e.g.Vink et al. 2010). This idea is further supported by some VFTS B supergiants that are in relatively close bina-ries (such that binary mass transfer has most likely not occurred yet) and that are apparently cooler than the TAMS of the stel-lar models (seeMcEvoy et al. 2015). There are further ways to push the apparent TAMS to cooler temperatures for example by merger products (e.g.de Mink et al. 2014;Justham et al. 2014) and uncertain physics such as semi-convection (e.g.Langer et al. 1989;Langer 1991). The consequences of our finding therefore
B-type supergiants at Teff≈ 22 kK and log L/L ≈ 5.8.
Two stars, VFTS 108 (WN7h) and 125 (Ope), appear to be hotter than the ZAMS. Chemically homogeneously evolv-ing models can explain their observables well. If true, these two stars are expected to rotate relatively fast (present-day rotational velocities of &170 km s−1 and &250 km s−1, respectively) and may retain enough angular momentum to produce long-duration gamma-ray-bursts at the end of their lives (e.g.Yoon & Langer 2005;Woosley & Heger 2006). Further candidates of this evolu-tionary channel have been identified (Martins et al. 2009,2013; Almeida et al. 2015). There is the alternative possibility that VFTS 108 and 125 are classical WR stars with highly inflated envelopes that place the stars so close to the ZAMS as dis-cussed byBestenlehner et al.(2014). The large projected rota-tional velocity of VFTS 125 of about 270 km s−1 is rather unexpected for a classical WR star with an inflated envelope and thus seems to favour a chemically homogeneous star. The pro-jected rotational velocity of VFTS 108 is not well measured (it seems to be smaller than 200 km s−1) and is thus of limited help for constraining its evolutionary status. We note that the e ffec-tive temperature of VFTS 125 is considerably uncertain and it can therefore not be excluded that it is actually cooler than the ZAMS and thus not a strong candidate of a chemically homoge-neously evolving star.
We find no star above the HD limit. Furthermore, no star is found to be cooler than 35 kK and brighter than log L/L = 6.1
despite the fact that initially slowly rotating (.100 km s−1),
100–200 M stellar models ofKöhler et al.(2015) spend about
30–40% of their MS lifetime in this part of the HR diagram. Given that there are 14 stars hotter than 35 kK and brighter than log L/L = 6.1, the models predict five to six stars in a region
of the HR diagram where no star is observed, a more than 2σ mismatch3.
Another independent hint towards a mismatch of the mas-sive star models and the observed stars comes from the sur-face helium enrichment of stars brighter than log L/L = 6.1 (for
helium abundances see Table S3 inSchneider et al. 2018). Sur-face helium enrichment is obtained in two ways in single star models: first, by the removal of the hydrogen envelope through stellar winds which exposes material processed by nuclear burn-ing and, second, by (rotationally induced) mixburn-ing that transports chemically enriched material from the core to the surface. An initial rotational velocity of larger than 300 km s−1is required in
eight to nine of these 14 bright stars, that is in more than 50–60%
3 The implicit assumption here is that stars formed continuously and
at a similar rate over the last 2–3 Myr, which seems reasonable (e.g.
log( L / L
⊙)
T
eff/ kK
HD limitLate-type (4, 85)
B stars (258, 13)
O stars (173, 22)
WNh, Slash (13, 0)
3.5
4.0
4.5
5.0
5.5
6.0
6.5
0
10
20
30
40
50
60
10 M⊙ 15 M⊙ 20 M⊙ 30 M⊙ 40 M⊙ 60 M⊙ 100 M⊙ 150 M⊙ 200 M⊙ ZAMS 1 Myr 2 Myr 3 Myr 4 Myr 6 Myr 8 Myr 10 Myr 15 Myr 20 MyrWR
¨Fig. 1. Hertzsprung–Russell diagram of the VFTS stars analysed in this paper. The solid and dashed black lines are the non-rotating stellar
evolutionary tracks and isochrones ofBrott et al.(2011) andKöhler et al.(2015), respectively. The Humphreys–Davidson (HD) limit is shown by the dot-dashed line in the top-right. Black symbols represent stars which cannot be reproduced by the stellar models (for reference, stars cooler than 9000 K and hence removed from our sample are also shown in black). In the legend, we provide the number of stars of each class that are in our final sample and those where not all observables can be reproduced by the stellar models simultaneously in parenthesis. Symbols in grey denote stars that fall off the MS part of the stellar tracks and are hence treated as Hertzsprung-gap stars (Sect.2.1), but the symbols themselves keep their meaning. The luminosities of the four classical WR stars in our sample are indicated by the arrows on the left (they have surface temperatures of 80–90 kK).
of them, to explain the high surface helium mass fractions, because the stellar wind in our models is – on its own – not e ffi-cient enough to enrich the stellar surfaces to the observed values. We consider such a large fraction of initially fast rotators implau-sible given that less than 20% of OB stars in 30 Dor rotate that fast (Dufton et al. 2013; Ramírez-Agudelo et al. 2013). Hence, single star models alone likely lack physics to fully describe the upper part of the HR diagram.
Bestenlehner et al.(2014) come to a similar conclusion when studying the mass-loss properties of the most massive stars in 30 Dor and find evidence for a wind enhancement of stars close to the Eddington limit as theoretically predicted by for exampleGräfener & Hamann(2008) andVink et al.(2011). An increased wind mass loss with Eddington factor may help to remove the tension between the stellar models and observations in this part of the HR diagram. Additionally, some of the very massive stars may be products of binary mass exchange (e.g. Schneider et al. 2014a;de Mink et al. 2014), that could explain their large observed surface helium abundances and hotter tem-peratures.
There are three stars in our sample (VFTS 682, 1022 and 1025) with an initial mass in excess of 150 M . In the
past, this mass has been suggested to be the largest possi-ble birth mass of stars (e.g. Weidner & Kroupa 2004; Figer
2005;Oey & Clarke 2005;Koen 2006). VFTS 1025 aka R136c belongs to the four very massive stars in the R136 star clus-ter already found byCrowther et al.(2010) to exceed this limit. There are probably at least two further stars in 30 Dor that are initially more massive than 150 M : Mk 42 and VFTS 695. The
latter likely has a composite spectrum and is therefore removed from our sample, and Mk 42 is not part of the VFTS sample and is hence not considered in this work to avoid modifying our selection strategy (see Sect.2.3). So there are currently about eight candidates with initial masses in excess of 150 M . Some
of them may be merger products (e.g. Portegies Zwart et al. 1999;Banerjee et al. 2012;Schneider et al. 2014a) and further work is needed to establish the origin of their high masses (see also discussion inVink et al. 2015).
3.2. Age and mass distributions of massive stars in 30 Dor 3.2.1. Full 30 Dor region
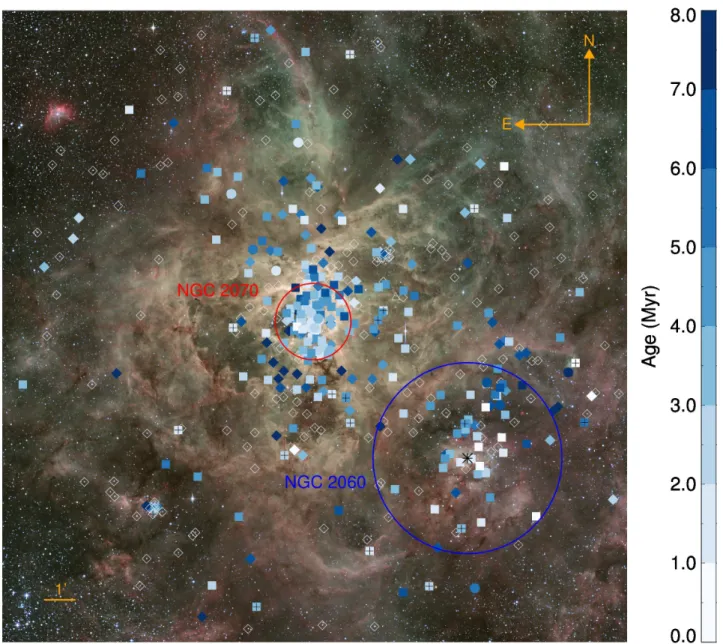
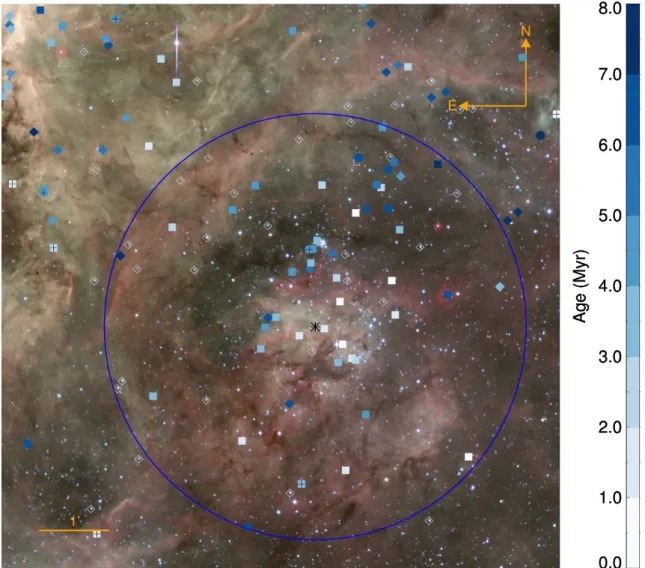
In Fig.2, we show the positions of our sample stars in 30 Dor and colour-code their ages. Massive stars cluster around R136 in the NGC 2070 region encircled in red and the NGC 2060 region encircled in blue. The radii of the two circles are chosen arbitrarily such that they roughly contain the same number of
Fig. 2.Age map of our sample of massive VFTS stars. Symbols are as in Fig.1, i.e. circles denote slash, WNh and WR stars, squares O-stars, diamonds B stars and triangles later-type stars. Runaway stars are marked by additional plus-signs and the position of the pulsar PSR J0537−6910 by a black asterisk. The red and blue circles show regions of 1.2 arcmin (≈18 pc) around R136 (NGC 2070) and 3 arcmin (≈44 pc) around the pulsar (NGC 2060), respectively. Symbols without filling indicate stars older than 8 Myr. The background image of 30 Dor is an optical (B, V, [O iii] and Hα) composite taken with the Wide Field Imager (WFI) at the MPG/ESO 2.2-m telescope on La Silla under programme ID 076.C-0888, processed and released by the ESO VOS/ADP group.
VFTS stars. The energetic 16 ms X-ray pulsar PSR J0537−6910 and its supernovae remnant N157B reside in the centre of NGC 2060 (Chen et al. 2006). Hodge 301, a 15–30 Myr old star cluster (Grebel & Chu 2000; Evans et al. 2015; Cignoni et al. 2016) hosting three red supergiants and VFTS B stars, lies about 3 arcmin (44 pc) north-west of R136, and the star cluster SL 639 (10–15 Myr;Evans et al. 2015) about 7.5 arcmin (110 pc) south-east of R136.
Stars of all ages are scattered throughout the 30 Dor region and there are no obvious spatially coherent age patterns. Wher-ever groups of massive stars are found, they span a considerable range of ages. This finding already provides important informa-tion regarding the formainforma-tion process of massive stars: either stars formed rather randomly in 30 Dor with some high concentra-tions of stars such as in and around NGC 2070, or they formed in dense star clusters and migrated in some cases over large distances (tens to hundred of pc) to be found at their current
positions in such a scattered fashion. We will come back to this aspect later.
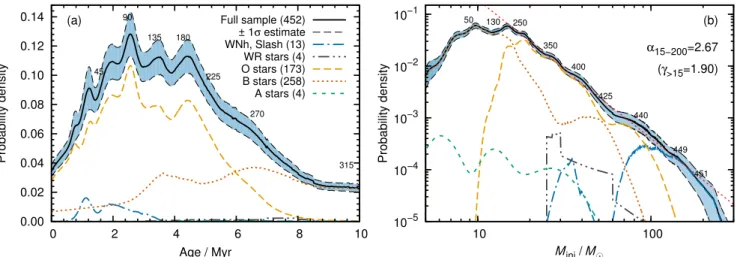
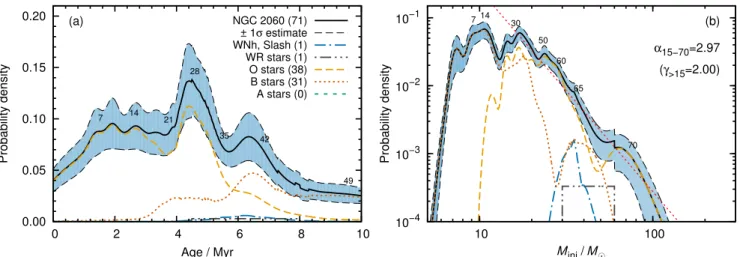
In order to study the star formation process more quantita-tively, we show the distribution of ages and initial masses in Fig. 3. The age distribution starts to increase at about 8 Myr and reaches a plateau at 1.5–5.0 Myr before it declines again; the median age of our full stellar sample is 5.3 Myr. We only show the age distributions up to 10 Myr, because there are no features beyond this age. The age distribution simply levels off and essentially drops to zero by about 40 Myr.
There are wiggles, peaks and shoulders in the age distribu-tion in Fig.3a (for example at ≈2.5, ≈4.4 and ≈6.4 Myr) that are not significant given the bootstrapped error estimates. Given the current accuracy and precision of the stellar ages, we are unable to easily identify coeval groups of stars. However, some fea-tures may indicate groups of stars that formed at the same time either spatially localised in for example star clusters or stellar
Fig. 3.Probability density functions of ages (panel a) and initial masses (panel b) of all stars in our sample. The contributions of slash and WNh, WR, O, B and A stars are shown. The blue shaded areas are bootstrapped ±1σ estimates (Sect.2.2) and the numbers along the curves indicate the cumulative number of stars up to certain ages and masses to judge which features of the distributions are populated by how many stars. The age distribution beyond 10 Myr keeps dropping and is essentially zero after ≈40 Myr. In panel b, a power-law mass-function, ζ(M)= dp/dM ∝ M−α, is fitted to the mass distribution and the inferred high-mass IMF slope γ>15after correcting for those stars that already ended their nuclear burning
lifetime is also provided (see Sect.3.4). For reference, a Salpeter IMF has a power-law slope of γ= 2.35 (Salpeter 1955).
associations, or non-localised during an enhanced star formation period in 30 Dor. We will show below (Sects.3.2.2–3.2.4) that some of the features in Fig.3a can be attributed to certain regions in 30 Dor.
The distribution of initial masses reaches a plateau below about 15 M , indicating the mass threshold above which our
sample is unbiased. Also the HR diagram (Fig.1) indicates the same 15 M threshold. At this mass, the VFTS magnitude limit
does not affect the ZAMS. The mass distribution is well sam-pled up to at least 200 M and can be fitted with a single
power-law (ζ(M)= dp/dM ∝ M−α) of slope α= 2.67 in the mass range 15–200 M . The slope is steeper than the 2.35 of the Salpeter
IMF (Salpeter 1955) because our mass distribution represents the distribution of initial masses of stars observed today, mean-ing that it lacks those stars that already ended their nuclear burn-ing lifetime. In Sect.3.4, we infer the true IMF slopes of our sample stars from the age and mass distributions in Fig.3.
Our sample is only unbiased above 15 M and from the
VFTS magnitude limit in the HR diagram (Fig.1) it can be seen that we lack young B and A stars that would be located close to the ZAMS. This implies that our age and mass distributions of B and A stars are biased towards older and more massive stars. Quantitative results derived from these distributions may there-fore be used within this study for differential comparisons, but should not be compared to other studies where stars have been selected differently.
There are ten B stars and one O-star within 1/3 arcmin of Hodge 301, and twelve B stars within 1/3 arcmin of SL 639 in our sample that have median ages of 13.5 Myr and 11.1 Myr, respectively. In all cases, it is not certain which of these stars are genuine cluster members and whether some are rejuvenated binary products, but these ages appear to be consistent with ages derived for these clusters in the literature (e.g. Grebel & Chu 2000; Evans et al. 2015). However, we note thatCignoni et al. (2016) derive an older age of 25–30 Myr for Hodge 301, which is at odds with the median age of VFTS sources in the vicinity of this cluster.
In the following, we investigate the age and mass distri-butions of our sample stars in three spatially distinct regions, namely in NGC 2070 (R136 region), in NGC 2060 and out-side of these two regions to further disentangle and understand
the age distribution in Fig. 3a and the star formation process in 30 Dor.
3.2.2. NGC 2070 (region around R136)
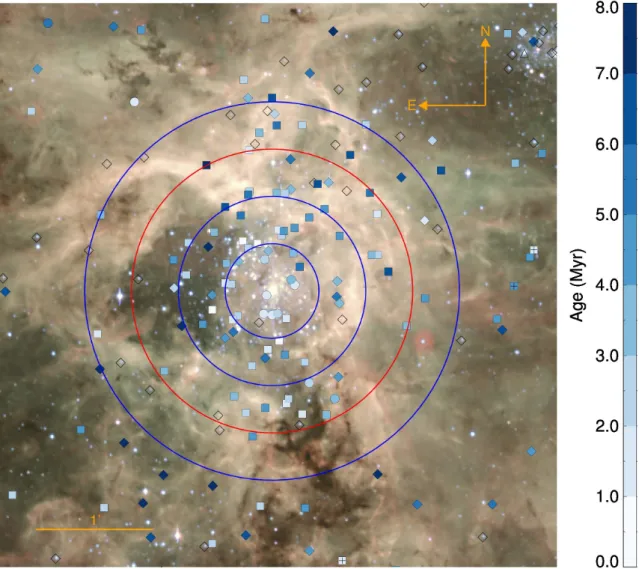
NGC 2070 resides at the heart of 30 Dor and is the most promi-nent site of recent, massive star formation. The R136 star cluster lies just in the centre of this region and we show the positions and ages of our sample stars around it in Fig.4. The core region of R136 has not been observed within the VFTS because of crowd-ing and it is not immediately evident which of our sample stars are genuine R136 cluster members. This is in part also because we are observing the projection of a 3D structure on the sky which makes it difficult to assign an age to R136 from nearby stars in our sample.
The massive and young WNh stars VFTS 1001 and VFTS 1025 aka R136c are close to the R136 cluster core and may thus belong to R136. From the VFTS data, we have inferred ages of 3.0 ± 0.3 Myr and 1.8 ± 0.2 Myr for VFTS 1001 and VFTS 1025, respectively. To put a lower limit on the ages of these two stars, and thus to the age of R136, we con-sider their observed surface helium mass fractions. The sur-face helium mass fraction holds information of how much helium has at least been synthesised in stellar cores. Lower age limits can then be derived by assuming that the helium core mass fraction, Ycore, is the same as that observed on the
surface and that the core helium mass fraction scales linearly with age, that is t/τMS= (Ycore− Yini)/(1 − Yini) with t being
the age of the star, Yini≈ 0.26 the initial helium mass
frac-tion and τMS the main-sequence lifetime. These age limits are
larger if the star was initially rotating faster, prolonging the main-sequence life, or if the star is a binary product in which case it was likely rejuvenated. The surface helium mass frac-tions inferred byBestenlehner et al.(2014) for VFTS 1001 and VFTS 1025 are 0.85 ± 0.05 and 0.70 ± 0.05, respectively. Given the observed luminosity of log L/L ≈ 6.2 and effective
temper-ature of Teff≈ 42.2 kK of VFTS 1001, it falls on an initially
100 M stellar track. Such stars have main-sequence lifetimes of
about 2.6 Myr, meaning VFTS 1001 must be older than 1.7 Myr with 98% confidence. The confidence levels are derived from
Fig. 4.As Fig.2but zoomed into the NGC 2070 region around the R136 star cluster. To guide the eye, we show four circles centred on R136 with radii of 0.4 (6), 0.8 (12), 1.2 (18) and 1.6 arcmin (23 pc). As is evident from the distribution of stars, the innermost region around the crowded R136 cluster has not been observed in the VFTS.
Fig. 5.As Fig.3but for stars within 1.2 arcmin of R136 (18 pc; red circles in Figs.2and4).
the uncertainties in the observed surface helium mass fraction. VFTS 1025, with an observed luminosity of log L/L ≈ 6.6 and
effective temperature of Teff≈ 42.2 kK, is close to an initially
200 M track that has a main-sequence lifetime of about 2.1 Myr.
Hence, VFTS 1025 is older than 1.0 Myr with 98% confidence. From our data, it therefore seems that stars in R136 are older
than 1 Myr.Crowther et al.(2016) find a most likely cluster age for R136 of 1.5+0.5−0.7Myr (i.e. 0.8–2.0 Myr). This is in agreement with our conclusion from VFTS 1001 and VFTS 1025.
The age and mass distributions of our sample stars within 1.2 arcmin of R136 (red circles in Figs.2 and4) are shown in Fig.5. The median age is 3.6 Myr, meaning it is younger than
Fig. 6.As Fig.2but zoomed into the NGC 2060 region. The blue circle of radius 3.0 arcmin (44 pc) is centred on the pulsar PSR J0537−6910 (black asterisk) and stars within this circle are used to compute age and mass distributions.
that of the full 30 Dor region. Stars closer to R136 are, on aver-age, younger than stars further out, giving rise to a core-halo age gradient: stars in the 0.0–0.4 arcmin annulus have a median age of 3.4 Myr, which increases to 3.6, 4.4 and 6.7 Myr in the 0.4–0.8, 0.8–1.2 and 1.2–1.6 arcmin annuli, respectively.
The age distribution in Fig.5a shows a (potential double) peak at 2–4 Myr which represents the characteristic age of our sample stars in NGC 2070. This includes stars just north-east of R136, the north-east (NE) clump, that might be in the process of merging with R136 as suggested bySabbi et al.(2012). The same authors find ages of 2–5 Myr for pre-MS stars in the NE clump, which appears consistent with our age estimates of mas-sive stars in this part of NGC 2070. A tail of about 6 Myr old stars are primarily found >0.4 arcmin from R136, contributing to the appearance of the core–halo age gradient.
The initial-mass distribution (Fig.5b) is filled up to ≈200 M
and the most massive and youngest stars are concentrated within 0.4 arcmin (6 pc) of R136. A power-law fit to the mass distribu-tion gives a slope of 2.33 – we discuss the true IMF of this region in Sect.3.4.
3.2.3. NGC 2060
The second-highest concentration of OB stars is found in NGC 2060. In Fig.6we show the positions and ages of our stars
in this part of 30 Dor. The 16 ms pulsar PSR J0537−6910 forms the centre of a 3 arcmin (≈44 pc) region that we use to compute the age and mass distributions of this sample (see Fig.7).
About 1.2 arcmin north of the pulsar PSR J0537−6910 lies the stellar association TLD 1 (Brey 73) that hosts several OB stars and the WN6(h) star VFTS 147 (Testor et al. 1988; Bica et al. 1999, 2008). Within the TLD 1 association are the O dwarf VFTS 154 and the O supergiants VFTS 141, 151 and 153. The latter two are visual multiples of at least five and three stars, respectively (Walborn et al. 2014); the stellar models cannot reproduce the properties of VFTS 141 and the inferred stellar parameters of VFTS 147 are discarded as highly uncer-tain byBestenlehner et al.(2014). We thus only have one good age estimate for the TLD 1 association from our stellar sample of 3.4+0.3−0.3Myr based on the age of VFTS 154.
Based on the spectral classifications ofWalborn et al.(1999) and the calibrations ofCrowther et al.(2016) applied to stars in the R136 cluster core, we derive effective temperatures and lumi-nosities for eight OB stars in TLD 1 (AppendixC). We deter-mine masses and ages of these stars with the same methods and assumptions as described in Sect.2.1and compute an age dis-tribution (Fig.C.1). The age distribution peaks at about 3.3 Myr (median age of 3.5 Myr) which is in good agreement with the age inferred for TLD 1 from VFTS 154.
Fig. 7.As Fig.3but for stars within 3.0 arcmin (44 pc) of the pulsar PSR J0537−6910 in NGC 2060 (blue circles in Figs.2and6).
Fig. 8.As Fig.3but for stars outside NGC 2060 and NGC 2070.
There seems to be an age gradient in NGC 2060 with the on average oldest stars located north to north-west of PSR J0537−6910 and the on average youngest in its direct vicin-ity. The association TLD 1 and surrounding stars are rather inter-mediate in terms of location and age. It therefore seems that star formation in the last 8–10 Myr started north to north-west of PSR J0537−6910 and along the molecular filament between NGC 2060 and NGC 2070, and then moved towards the position of the pulsar.
The age distribution of stars in NGC 2060 (Fig.7a) shows that stars are on average older than in NGC 2070, with a median age of 5.7 Myr. The dominant feature in the age distribution of stars in NGC 2060, a peak at about 4.4 Myr, is also found in our age distribution of all sample stars (Fig. 3a), but not in that of stars around the R136 star cluster (Fig.5a). The older median age is also represented by, on average, less massive and fewer massive stars: the distribution of initial masses in Fig.7b is trun-cated above 100 M and the fitted power-law exponent is 2.97,
steeper than for stars in NGC 2070.
The age and mass distributions of stars in NGC 2060 provide probabilistic constraints on the progenitor star that gave rise to the pulsar PSR J0537−6910 and the supernova remnant N157B. Various studies have attempted to obtain such constraints on other nearby supernova remnants from photometric measure-ments of the surrounding stellar population; for example see Williams et al.(2014) for a discussion of constraints on the
pro-genitor masses of 17 historical supernovae. The age distribution around N157B is fairly broad, but peaks at ≈4.4 Myr (Fig.7a). So, if the progenitor of PSR J0537−6910 also belonged to stars aged 4–5 Myr, its initial mass is between 35 and 50 M ,
assum-ing that the star lived its life as a genuine sassum-ingle star.
3.2.4. Stars outside NGC 2060 and NGC 2070
The age distribution of stars outside NGC 2060 and NGC 2070 (Fig.8a) shows a significant over-abundance of ≈4.4 Myr old stars. A similar over-abundance is found in NGC 2060 (Fig.7), but not in the region around R136 (Fig.5). Also the shoulder at about 6.6 Myr is reminiscent of that in NGC 2060 whereas the 2.5 Myr peak is rather found in R136. The median age of stars in this sample is 8.1 Myr, older than the median age of stars in NGC 2060 and NGC 2070, demonstrating that the NGC 2060 and NGC 2070 regions contain on-average the youngest stars in 30 Dor.
Despite the older median age, the mass distribution (Fig.8b) is filled up to the highest masses (in contrast to the mass dis-tribution of stars in NGC 2060; Fig 7b). It is difficult to fit the mass distribution with a single power-law because a flatter slope is required at the high mass end (&60 M ) than at lower
masses. Such a trend is expected because the mass-luminosity exponent x is smaller in more massive stars such that a present-day mass function of a population of stars that underwent
Ages / Myr Distance from R136 / pc Median 0.1 1.0 10.0 0 20 40 60 80 100 120 140 160 Mini / M ⊙ Distance from R136 / pc 10.0 100.0 0 20 40 60 80 100 120 140 160
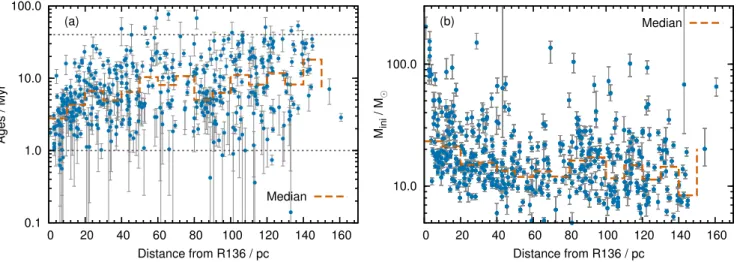
Fig. 9.Distribution of ages (panel a) and initial masses (panel b) of our sample stars as a function of distance from the central R136 star cluster.
The dashed lines show the median age and mass in 10 pc distance intervals and the grey dotted lines highlight ages of 1 and 40 Myr. The median ages and masses have not been corrected for sample completeness (cf. Sect2.3).
constant star formation in the past is flattest at the highest masses (see Sect.3.4).
3.3. Spatial distribution of stellar ages and masses
In Fig.9, we show the distribution of ages and initial masses of our sample stars as a function of distance from the central R136 star cluster. The age gradient in the close vicinity of R136 is vis-ible, highlighting again that the youngest stars are concentrated towards R136 and a core–halo age gradient is present. In fact, this trend even prevails over the whole 30 Dor nebula: massive stars are on average older and less massive the further away they are from R136.
Stars of all ages and masses are found across the whole 30 Dor nebula (e.g. Figs.2and9). Even stars up to 100 M are
found far from R136 without clear association to other massive stars in terms of location and age. Stars that were born around the same time in the same region of 30 Dor would be expected to stand out as “groups” in Fig.9a and potentially as peaks in our age distributions. At a distance of 80–100 pc from R136, there is such a group of stars with an age of 4–5 Myr; the massive stars close to NGC 2060 and north of it (see Fig.6and Sect.3.2.3). The same group of stars has also been identified in our age dis-tributions: the peaks at about 4.4 Myr in the age distributions of stars in NGC 2060 and in the whole 30 Dor field (Figs.7and8, respectively). In total, there are about 50–60 OB stars in our sam-ple that could belong to this group given their age of ≈4.4 Myr. However, these stars are scattered around the whole 30 Dor neb-ula without an obvious spatial concentration towards NGC 2060, so it seems that not all of them formed in the same location.
Except for the group of 4.4 Myr old stars, there are no obvious other coeval groups of stars in our sample. The distribution of stel-lar ages as a function of distance is quite homogeneous and there are no other peaks in our age distributions that are significant at the&1σ level. This is not to say that other, approximately coeval groups of stars do not exist in 30 Dor (e.g. TLD 1 and R136), but they are not easily identified with our current data and analysis.
3.4. Initial mass function of massive stars in 30 Dor
Our age and mass distributions of stars in 30 Dor (Figs.3,5,7 and8) are not SFHs and IMFs, respectively, because they lack
stars that already ended their nuclear burning. Our mass dis-tributions are the convolution of the underlying SFH and IMF. For example, for a constant star-formation rate and a mass-luminosity relation of the form L ∝ Mx, the slope of the
present-day mass-function is α= γ + x − 1, meaning it is steeper than the true IMF slope γ because x ≥ 1. The steepening is because of shorter lifetimes associated with more massive stars such that the present-day mass function is depleted from the high mass end onwards. The true IMF slope γ of our different stellar sam-ples in 30 Dor must thus be flatter than the slopes α obtained by fitting the mass distributions with power-law functions.
The SFH and IMF can only be unambiguously derived if both the present-day distributions of ages and initial masses are known. With our data, we are therefore able to infer the SFH and IMF of different samples of VFTS stars. To do so, it is important to consider unbiased samples of stars. As described inSchneider et al.(2018) and in this work, our sample of mas-sive VFTS stars is unbiased for stars more masmas-sive than 15 M ;
for lower mass stars, the magnitude limit of the VFTS intro-duces a bias (see for example the turn-over in the mass func-tion in Fig.3b at masses smaller than 15 M and the magnitude
cut in the HR diagram in Fig. 1). We follow the approach of Schneider et al.(2018) to infer the SFH and IMF: we assume a power-law IMF, ξ(M) ∝ M−γ, and vary the IMF slope γ until we find the best-fit to the distribution of initial masses as observed for all stars that are presently in our sample and more massive than 15 M . To that end, we first infer the SFH for a given IMF
and then—for the inferred SFH and assumed IMF—predict the distribution of initial masses as observed today which we com-pare to the observed mass distribution by computing the usual χ2. From the χ2values, we compute probability distributions for
the IMF slopes γ. A summary of the median ages and inferred IMF slopes of the different regions in 30 Dor are provided in Table1.
As shown inSchneider et al.(2018), the IMF of the VFTS stars is shallower than a Salpeter-like IMF. This raises the ques-tion of why this is the case. Most theoretical star-formaques-tion mod-els (e.g.Padoan & Nordlund 2002; Krumholz & McKee 2005; Hennebelle & Chabrier 2008;Federrath & Klessen 2012) intro-duce a characteristic mass for cloud fragmentation and collapse that is closely related to theJeans(1902) mass, MJ∝ρ−1/2T3/2.
and the resulting stellar mass decreases. Vice versa, when the temperature T increases, such as in regions of strong feedback or when the stabilising effects of small-scale turbulent motions or magnetic fields are included in the analysis, the character-istic stellar mass becomes larger. For a more detailed account, see for example the reviews by Mac Low & Klessen (2004), McKee & Ostriker (2007) and Klessen & Glover (2016). It is conceivable that the energy and momentum input from previ-ous stellar generations in 30 Dor results in a IMF with a shal-lower slope than Salpeter (see e.g. Larson 2005). If true, the youngest stellar populations in 30 Dor have formed from the most intensively heated gas and should follow an even shallower IMF. The youngest stars in our sample are found in NGC 2070 around the R136 star cluster and their IMF slope of γ= 1.65+0.63−0.42 appears to be marginally flatter than γ= 1.90+0.37−0.26, which is the value inferred for all stars in 30 Dor (Table 1). However, in regions of massive star formation, also the density is higher than on average. In addition, at number densities above ≈105cm−3
the gas becomes thermally coupled to the dust, which can act as an efficient thermostat due to its high thermal inertia, and so the gas temperature typically does not increase by much (Elmegreen et al. 2008). Consequently, it is often assumed that the competing effects influencing the IMF largely compensate each other, leading to a roughly universal distribution of stellar masses (Elmegreen 2005,2011). Given the large uncertainties in the derived IMF slopes in 30 Dor, we do not find statistically sig-nificant evidence for a spatial dependence of the IMF and thus cannot distinguish between these two scenarios.
We also want to mention the possibility (see also Schneider et al. 2018) that if high-mass stars form via grav-itationally focussed mass accretion with mass accretion rates scaling with the square of the mass, that is Bondi–Hoyle– Littleton like accretion (Zinnecker 1982;Bonnell et al. 2001a,b), the power-law index of the mass spectrum of massive stars approaches the asymptotic limit γ → 2.00 (Zinnecker 1982; Ballesteros-Paredes et al. 2015). This limit can only be reached if stars accrete a substantial fraction of their seed mass which could be the case for the high mass stars considered in this study. In this picture, our inferred IMF slope for high mass stars in 30 Dor would rather be the norm than the exception.
In an alternative model, it is assumed that the IMF is inher-ited from the core mass function and that the two are similar (see e.g. Sect. 3.3 in McKee & Ostriker 2007). Motte et al. (2018) have been able to obtain the core mass function in the Galactic star-formation region W43-MM1 in the mass range 1.6–100 M .
They find a power-law index of 1.96 ± 0.13 that is similar to our high-mass IMF slope and also flatter than the slope of a Salpeter-like IMF.
The 30 Dor region has a complex structure and it remains uncer-tain what may have triggered the first star formation. It has been suggested that star formation at the leading edge of the LMC disc has been instigated through ram pressure with the Milky Way’s hot halo gas (de Boer et al. 1998). This may have lead to a general progression of star formation throughout the molecular ridge south from 30 Dor. In an alternative scenario, it has been suggested that gas from the Small Magellanic Cloud may be accreting onto the LMC disc in the region of 30 Dor and the molecular ridge, and has thereby triggered star formation (Olsen et al. 2011;Fukui et al. 2017).
The oldest massive stars in 30 Dor formed at least 20–30 Myr ago (e.g. Walborn & Blades 1997; Grebel & Chu 2000; De Marchi et al. 2011) whereas the youngest stars are still embedded in dense molecular clumps, primarily found to the north and west of R136 (e.g. Walborn & Blades 1987, 1997; Hyland et al. 1992; Rubio et al. 1998; Brandner et al. 2001; Walborn et al. 2002; Maercker & Burton 2005; Nayak et al. 2016; Kalari et al. 2018). There are several star clusters such as Hodge 301 (15–30 Myr, e.g. Grebel & Chu 2000; Evans et al. 2015; Cignoni et al. 2016), R136 (1.5+0.5−0.7Myr, e.g. Crowther et al. 2016), SL 639 (10–15 Myr; Evans et al. 2015) and TLD 1 (≈3.5 Myr; Sect. 3.2.3 and Appendix C). Walborn & Blades (1997) further suggest the existence of a loose association of stars around the luminous blue variable R143, about 2.2 arcmin (32 pc) south to south-east of R136, and Sabbi et al.(2012) find a second clump of stars just north-est of R136 that they suggest might be in the process of merging with R136.
Using the Atacama Large Millimeter Array and the Australia Telescope Compact Array, Indebetouw et al. (2013), Anderson et al. (2014) andNayak et al. (2016) find molecular clumps in the filamentary structure around R136 that seem to be gravitationally unstable and are likely to collapse to form the next generation of stars. This is in the same region where Walborn & Blades(1987) already identified knots of embedded young stars and where Kalari et al. (2018) suggest that stars currently form. Also maser emission is found in these regions, indicative of young massive objects hidden from direct view (e.g. van Loon & Zijlstra 2001;Oliveira et al. 2006).
Pre-MS stars trace recent star formation and are found all over 30 Dor with clear over-densities in and around NGC 2060 and NGC 2070 (e.g. Sabbi et al. 2016; Ksoll et al. 2018). De Marchi et al. (2011) find that pre-MS stars younger than 4 Myr primarily cluster around R136 and towards its north whereas those older than about 12 Myr are rather found east and south-east of R136. These two groups overlap in the outskirts of R136, highlighting the 3D structure of the 30 Dor nebula.
ilar to ours for stars in NGC 2070. They also find that the region around R136 consists of several stellar populations. Selman et al. (1999) find that the youngest stars are concen-trated towards the core of R136, in agreement with our results. Similar core–halo age gradients are found in other star form-ing regions, for example in the Orion nebula, the Flame neb-ula (NGC 2024) and W40 (Getman et al. 2014a,b). They even occur in 80% of young star clusters studied by Getman et al. (2018) and thus appear to be a ubiquitous feature of star formation.
4.2. Influence of binary stars
Binary stars influence our work in two ways: (i) unrecognised binaries can lead to overestimated luminosities and hence masses (see discussion in Schneider et al. 2018), and (ii) mass can be exchanged in binaries (e.g. stellar mergers), which increases the masses of stars and leads to rejuvenation, that is to under-estimated ages (e.g. Hellings 1983; Podsiadlowski et al. 1992; Langer 2012;Schneider et al. 2016). These two aspects need to be kept in mind when interpreting our data and drawing conclu-sions from it.
Schneider et al.(2018) show that both unrecognised binaries and binary mass-exchange products have a negligible effect on the inferred IMF slopes in our case, because the VFTS is a multi-epoch spectroscopic survey where the binary detection probabil-ity increases with mass, shorter orbits and larger mass ratios. This means that those binaries that would affect the inference of the IMF most strongly are more likely to be detected and hence removed from our sample.
However, the ages and masses of individual stars, and also the raw age and mass distributions derived in this work are affected by binary stars.de Mink et al.(2014) estimate that about 30% of stars in a sample similar to ours are products of binary interactions. This implies that the ages of about one third of our sample stars are potentially underestimated because of rejuvena-tion. This needs to be accounted for when drawing conclusions about the star formation process in 30 Dor.
4.3. Extinction
The visual extinction towards OB stars in 30 Dor is rel-atively low, though is inhomogeneous across the region (Maíz Apellániz et al. 2014).De Marchi et al.(2016) have quan-tified the spread in visual extinction across 30 Dor (A555of 0.5
to 3.0 mag) which needs to be kept in mind when discussing the average ages of our OB stars in different regions because of potentially varying completeness of the VFTS with location in 30 Dor. For example,De Marchi et al.(2016) find that there is more extinction towards the south-east of NGC 2060 and NGC 2070 than towards the north-west.
The mass distributions of our sample stars in NGC 2070 (Fig.5b), NGC 2060 (Fig.7b) and outside these regions (Fig.8b) show the same transition from a plateau to a power-law function at about 15 M such that it seems that differences in extinction
between these regions are on average not so important for stars &15 M . However, if the average extinction is indeed larger in
NGC 2060 than in NGC 2070, we might lack more BA stars in NGC 2060 than in NGC 2070 because of the magnitude limit of the VFTS. If true, this would make the median age of NGC 2060 older, reinforcing our finding that stars in NGC 2060 are on aver-age older than those in NGC 2070.
There are clear overdensities of massive stars in NGC 2060 and NGC 2070, indicating that the bulk of these stars formed in these two regions. But where did the stars outside of NGC 2060 and NGC 2070 form? They could have formed close to where they are observed today or travelled to their current positions from NGC 2060 and NGC 2070. To test the relevance of these for-mation channels in 30 Dor (i.e. star forfor-mation in relative isola-tion vs. star formaisola-tion in clusters and associaisola-tions4), we consider three probes: (i) similarities between our age distributions of dif-ferent regions in 30 Dor, (ii) the radial-velocities of the VFTS stars and (iii) the proper motions of some VFTS stars from the second Gaia data release (Gaia DR2).
If stars were to move fast enough such that they are strongly mixed, the age distributions derived for sub-regions in 30 Dor would show similar features. From our age distributions of the different studied sub-regions (Figs.3a,5a,7a and8a), it is evi-dent that this is not necessarily the case. There are features in the age distributions that appear to be unique to certain sub-regions, such as the most dominant feature at ≈3.5 Myr in the age dis-tribution of stars in NGC 2070 (Fig.5a), which neither stands out in the age distribution of stars in NGC 2060 (Fig.7a) nor in that of stars outside NGC 2060 and NGC 2070 (Fig.8a). The same holds true for the group of 4.4 Myr stars which are rather found outside of NGC 2070 and not within it. Also, the age dis-tributions of stars in NGC 2060 and NGC 2070 are qualitatively and quantitatively different, suggesting that the bulk of stars in NGC 2060 and NGC 2070 formed locally and that only a limited amount of mixing occurred between these two regions.
The 1σ radial-velocity (RV) dispersion of VFTS O-type stars in NGC 2060 and NGC 2070 is ≈8.0 km s−1 and ≈8.6 km s−1,
respectively (Sana et al., in prep.), and our sample contains 27 RV runaway candidates, that is stars with a radial velocity of &25.8 km s−1(indicated by crosses in Figs.2,4and6). With such velocities, stars can travel considerable distances within typical lifetimes of a few Myr and thus contribute to the dilution and mixing of stellar populations in 30 Dor.
To further quantify how far stars might have migrated in 30 Dor, we compute the transverse velocities of stars required to move to their current position from R136 given the inferred stel-lar ages. It is important to account for rejuvenation (Sect.4.2) and we assume that our sample contains 30% of rejuvenated binary products (de Mink et al. 2014) which appear to be 30% younger than they truly are (this is a characteristic average of rejuvenation in stellar mergers;Schneider et al. 2016). To avoid biases, we focus on stars with an initial mass ≥15 M . For
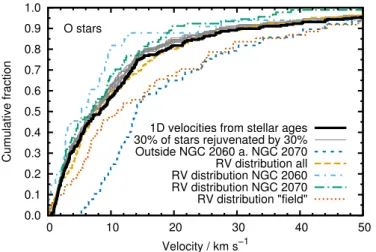
com-parison with the distribution of radial velocities of VFTS single O-stars from Sana et al. (2013), we convert the 2D transverse velocities into their 1D equivalent by dividing by√2. The result-ing cumulative velocity distributions of all stars and those that are 2.4 arcmin outside NGC 2060 and NGC 2070 are shown in Fig.10alongside the RV distributions for stars in various sub-regions of 30 Dor. We have chosen a slightly different definition of NGC 2060 and NGC 2070 than in the rest of this work for consistency with Sana et al. (in prep.); this does not affect our conclusions.
4 We want to point out that by massive star-formation in relative
iso-lation we do not have in mind that massive stars form completely alone but rather without an obvious association to other massive stars and the known dense star clusters in 30 Dor. It might well be that some stars that apparently formed in isolation are actually accompanied by other, yet undetected stars (see e.g.Stephens et al. 2017).
Fig. 10.Cumulative distribution of O-star velocities (Mini≥ 15 M ) in
30 Dor. The comparison radial-velocity (RV) distributions are from
Sana et al.(2013). The term “field” refers to stars outside NGC 2060
and NGC 2070, and we show ten realisations of the inferred veloc-ity distribution under the assumption that 30% of stars are rejuvenated binary products that appear younger by 30% compared to their true age (solid thin grey lines).
To reach their current positions from R136 within the inferred ages, our sample stars require faster velocities than expected by the RV distributions of stars in NGC 2060 and NGC 2070, even when accounting for rejuvenation. This suggests that some stars outside NGC 2060 and NGC 2070 formed in situ. How-ever, there is also the possibility that the RV distributions of stars in NGC 2060 and NGC 2070 are biased against fast veloc-ities because such stars could have potentially left these regions already. It is therefore instructive to also compare our inferred velocities to RVs of stars outside these two regions. Indeed, the RV distribution is shifted to higher velocities (Fig.10), indicative of a larger contribution of fast moving stars outside NGC 2060 and NGC 2070. While the RV distribution of stars with veloc-ities &14 km s−1 appears broadly consistent with the distribu-tion of velocities of stars outside NGC 2060 and NGC 2070 inferred from the stellar ages, the two distributions differ at lower velocities. There are O-stars outside NGC 2060 and NGC 2070 whose RV distribution predicts too slow velocities to reach their observed positions in 30 Dor within the inferred ages if these stars formed in R136. This again indicates that some stars most likely formed in situ outside NGC 2060 and NGC 2070.
In general, the RV distribution of VFTS O-stars in 30 Dor agrees with the inferred velocity distribution from the stellar ages. This demonstrates that O-stars in 30 Dor can travel over large distances and that this contributes to the overall mixing of stellar populations.
Thanks to the Gaia satellite and its second data release (Gaia Collaboration 2016, 2018), there is information avail-able on the proper motions of stars in 30 Dor. We cross-correlate Gaia targets with VFTS stars more massive than 15 M for which we have determined stellar ages. We exclude
RV runaway candidates, exclude stars closer than 3 arcmin to NGC 2060 and NGC 2070, and select those Gaia targets for which proper motions are known to better than 0.07 mas yr−1 in right-ascension and declination (corresponding to.20 km s−1
at a distance of 50 kpc to the LMC; the chosen proper-motion threshold is arbitrary and does not affect the conclusions). In Fig. 11, we show the positions of these stars and a “cone” indicating their likely birth places computed from the proper motions, their uncertainties and the inferred ages. Already from
outskirts of 30 Dor. Also, pre-MS stars are found all over 30 Dor and not only in NGC 2060 and NGC 2070 (e.g. Ksoll et al. 2018), suggesting that stars formed across the whole 30 Dor nebula and not exclusively in dense associations and clusters. This is also in agreement with the work ofWard & Kruijssen (2018), who find that large fractions of stars in Galactic OB associations appear to rather form in situ than in dense cluster-like environments. A similar conclusion has been reached by Wright et al.(2016) for stars in the massive Cygnus OB2 asso-ciation. We therefore conclude that the massive star population outside NGC 2060 and NGC 2070 consists of two components: runaways and walkaways, and stars that formed in situ.
4.5. Picture of massive star formation from the VFTS
The oldest stars in our sample have ages of&50 Myr (Fig.9a). With a velocity of 10 km s−1, such stars could have travelled a distance of about 500 pc, so it is not clear whether these stars formed in 30 Dor or are interlopers from nearby star-forming regions. Our sample of stars is only unbiased for stars more massive than 15 M . Such stars have a nuclear burning
life-time of about 12 Myr, which sets the oldest age up to which we can constrain the SFH. From deeper photometric observa-tions,Cignoni et al.(2015) conclude that the star-formation rate in 30 Dor more than ≈20 Myr ago was indistinguishable from the average star formation in the LMC and has increased since then. This coincides with our results that the number of stars in our sample starts to increase at ages of .40 Myr and has reached a considerable level at ages of.20 Myr (Fig.9a). The star-formation rate then increased rapidly 8 Myr ago as evident from our age distribution (Fig.3a) and the SFH of massive VFTS stars derived inSchneider et al.(2018).
There is a lack of stars younger than 1 Myr in our sam-ple (Fig. 9a) and also stars in the R136 star cluster are most likely older than ≈1 Myr (Sect.3.2.2). This suggests that either stars younger than 1 Myr are still hidden from our view (e.g. they might still be embedded in their birth clouds; see also Sect.4.3) or that star formation ceased with the birth of R136. At least there is currently no evidence for a second R136-like star cluster hidden in 30 Dor (Romita et al. 2016) such that it seems reasonable to assume that the overall star-formation rate has dropped after giving birth to the bulk of very massive stars in R136 about 1–2 Myr ago. One could speculate whether the birth of very massive stars in R136 might be responsible for sup-pressing star formation through their strong feedback locally in NGC 2070, but this can of course not explain the apparent lack of stars younger than 1 Myr throughout 30 Dor (cf. Fig.9a). Unfor-tunately, alsoCignoni et al.(2015) are currently unable to probe
Fig. 11. Backtracing the birth places of some VFTS O-stars outside NGC 2060 and NGC 2070 with Gaia DR2 proper motions. The thick lines indicate the past movement of stars given their inferred stellar ages and the “cones” (dotted lines) represent the range of possible motions because of proper-motion uncertainties. The longer thin lines represent the larger travelled distances from the age uncertainties. The red circles show NGC 2060 and NGC 2070 while the green circles show Hodge 301 and SL 639. The background image is a ESO WFI composite based on observations made with ESO Telescopes at the La Silla Observatory under programme ID 076.C-0888, processed and released by the ESO VOS/ADP group.
the SFH in the last ≈1 Myr from their deeper observations of lower mass stars in 30 Dor.
Between 1.5 and 5 Myr, our age distribution of the full 30 Dor region shows a plateau (Fig. 3). This is in agreement with the star-formation history of considerably lower mass stars in NGC 2070 as inferred byCignoni et al.(2015). The formation history of low and high mass stars therefore appears to be similar and no obvious delay between their formation is found.
Taking all our evidence together, the following picture of star formation in 30 Dor emerges. First, stars formed in the 30 Dor field outside NGC 2060 and NGC 2070. We observe an age gradient in NGC 2060 (Sect. 3.2.3) that implies that star formation started in the north and north-west of NGC 2060 and then proceeded inwards towards the position of the pulsar PSR J0537−6910. More or less at the same time, star formation also proceeded into the NGC 2070 region, but lasted longer than in NGC 2060 (giving rise to the younger median age) and cul-minated in the formation of the R136 star cluster. In this sce-nario, R136 formed last and thereby produced the core–halo age structure in NGC 2070. A considerable fraction of stars have been ejected and/or moved away from their birth places and thereby contribute to the formation of the age gradient across 30 Dor (stars being more spread out the older they are) and to the large age ranges found all over 30 Dor. Residual star forma-tion still takes place in the north and north-west of NGC 2070 and some of it may have even been triggered by the energetic feedback of young stars in R136 as suggested for example by Walborn & Blades (1997), but we cannot test this hypothesis with our data.
This sequence of star formation is evident from the median ages of stars in NGC 2070, in NGC 2060 and outside these two regions (Table 1), and even more so from the cumulative age distributions of stars in these regions of 30 Dor (Fig. 12). The
Cumulative fraction Age / Myr Full sample NGC 2070 NGC 2060 Outside NGC 2060 and NGC 2070 0.0 0.1 0.2 0.3 0.4 0.5 0.6 0.7 0.8 0.9 1.0 0 5 10 15 20
Fig. 12. Cumulative age distributions of stars in our full sample, in
NGC 2070, in NGC 2060 and outside these two regions. The differ-ent average ages of these samples are eviddiffer-ent (cf. Table1) and also the ages at which the star formation rate increased rapidly (kinks in the dis-tributions).
kinks in the cumulative age distributions indicate the onset of the rapid increase in star formation and thereby trace the sequence of how stars formed in 30 Dor. It appears that the rapid increase of star formation is offset by ≈2 Myr in the different regions of 30 Dor (see also Figs. 2a, 5a, 7a and 8a), but is overall quite synchronised.
Simulations of the collapse of (giant) molecular clouds show fragmentation and the formation of filaments, sheets and clumps where stars subsequently form (e.g.Larson 1978;