HAL Id: dumas-00643757
https://dumas.ccsd.cnrs.fr/dumas-00643757
Submitted on 30 Nov 2011
HAL is a multi-disciplinary open access
archive for the deposit and dissemination of sci-entific research documents, whether they are pub-lished or not. The documents may come from teaching and research institutions in France or abroad, or from public or private research centers.
L’archive ouverte pluridisciplinaire HAL, est destinée au dépôt et à la diffusion de documents scientifiques de niveau recherche, publiés ou non, émanant des établissements d’enseignement et de recherche français ou étrangers, des laboratoires publics ou privés.
quality
Thannaletchimy Thanagopal
To cite this version:
Thannaletchimy Thanagopal. Estimating import price elasticity while controlling for quality. Pricing of Securities [q-fin.PR]. 2011. �dumas-00643757�
ESTIMATING IMPORT PRICE ELASTICITY WHILE CONTROLLING FOR QUALITY
Nom du directeur de la soutenance : Professor Paul Zagamé Présenté et soutenu par Thannaletchimy Thanagopal (2011)
Université de Paris 1- UFR 02 Sciences Economiques- Mention du Master - Master 2 Recherche (Economie de la Mondialization)
Dissertation in part fulfillment for Masters Degree in M2R Economie de la Mondialization presented to the University of Paris 1-Pantheon Sorbonne 2010-2011
DISCLAIMER
L‟université de Paris 1 Panthéon Sorbonne n‟étend donner aucune approbation ni
désapprobation aux opinions émises dans ce mémoire ; elles doivent être considérées
comme propre à leur auteur.
ACKNOWLEDGEMENTS
I would like to thank my supervisor, Professor Paul Zagamé, Head of ERASME Laboratory and Professor at the Université Paris 1-Panthéon Sorbonne, for his encouragement and guidance throughout the course of my research. He has contributed many suggestions and ideas for my research and has also aided me tremendously in my understanding of econometric modeling, in particular the use of the NEMESIS model for the course of my research.
I would like to extend my gratitude to my colleagues at École Centrale, specifically Arnaud Fougeyrollas, Pierre Le Mouel, Boris Le Hir, Nicolas Lancesseur, Baptiste Boitier and Pierre Haddad, who were responsible for helping me with the data analysis and providing me with good sources for my research topic. In addition, I would like to extend my gratitude to Professor Mathieu Crozet whose work has inspired my own paper and whose aid helped to define the direction of my paper. Most importantly, I would like to thank my partner Louis Xavier Raffestin with whom I had worked closely for this dissertation.
I would also like to thank my close friends, especially Lee Siew Sze, Nunthiya Paisan, Olli Karjalainen and Anne Popovich, for their understanding and support during this testing period and most importantly, my family especially my dearest mother for their devotion and love showered upon me throughout this semester.
ABSTRACT
Import price elasticity tends to be under-estimated due to the omission of quality effects. This dissertation aims to fill this gap by analyzing 1) how quality effects affect the estimation of import price elasticity, 2) the impact of quality innovation in the various goods sectors of an economy and 3) the limitations pertaining to the estimation of the true import price elasticity as well as the policy implications of quality innovation on trade. In order to adjust for quality effects, a quality proxy is constructed. This proxy considers the role of product innovation in the form of Research and Development (R&D) expenditure as well as externalities arising from the knowledge acquired in other sectors and countries. A gravity model is formulated to isolate the price effect from the quality effect in estimating the import price elasticity. A panel analysis is used, covering 9 European countries (Germany, Denmark, Spain, Finland, France, Ireland, Italy, Netherlands and United Kingdom) over the period of 1996 to 2003. The empirical results indicate that the import price elasticities are higher with adjustments for quality, although they do not reach unity as predicted by the theoretical elasticity of substitution. The high values of price elasticity show that quality innovation not only encourages trade but also encourages domestic consumption of local and better quality products. In particular, the sectors which recorded an import price elasticity superior to 1 are those which produce homogeneous and non-industrialized products like metal products, non-metallic mineral products, textiles, rubber and plastics. Exporting countries that gain the most through quality innovation are Spain, Finland and the UK. The role of quality innovation has a significant effect of increasing overall trade for the region. Quality innovation of 1% on the part of the exporters increases their exports by a range of 0.2 to 1.2 percentage points. As such, quality innovation should be strongly encouraged to increase trade flows of the countries so as to increase the economy‟s overall growth.
Keywords: import price elasticity, quality, innovation, elasticity of substitution, international
TABLE OF CONTENTS
Content Title of Chapter Page
Acknowledgements i
Abstract ii
Table of Contents iii
List of Tables iv
List of Figures iv
Chapter 1 Introduction 1.1 Background/Motivation 1
1.2 Descriptive statistics 3
Chapter 2 Overview of Economic Literature 2.1 Overview of Price and Quality Effects 7
2.2 Overview of Endogenous Growth Theory 10
2.3 Role of R&D Innovation 11
Chapter 3 Overview of the Gravity Model 3.1 The Gravity Model 13
3.2 Data and Methodology of Model 14
3.3 Variables for Analysis 15
Chapter 4 Regression Results 4.1 General Results 20
4.2 Sectoral Results 23
Chapter 5 Policy Conclusion 5.1 Policy Applications and Limitations 34
5.2 Conclusion 39 Bibliography 41
LIST OF TABLES
Table Title of Table Page
1.2.1 Trade Performance of 7 Countries on the External Markets (Overall 4 Performance of Exporting Countries (rows) on Importing Countries (columns)
2.1.1 Past Estimations on Trade Price Elasticities (1982-2004) 8
3.2.1 Sectoral Classification 15
3.3.1 Distance Measured from Cities 19
4.1.1 General Results (Entire Sample) 21
4.2.1 Sectoral Results 24
4.2.2 Import Price Elasticity by Importing Country 29 4.2.3 Impact of 1% Increase in Product Quality on Exports where Rows 31
Refer to Domestic Markets and Columns to Exporting Countries
4.2.4 R&D Expenditures from 1996 to 2007 (%GDP) 33
LIST OF FIGURES
Figure Title of Figure Page
1.2.1 Share of Exporting Countries‟ Value of Exports with High Quality 5 In 2005
3.3.1 Constructing the Knowledge Variable 18
5.1.1 GDP and its Components in Europe in % deviation with respect to the 37 Baseline
5.1.2 Sectoral Comparison in Europe in 2030, Production and Employment 38 in % deviation with respect to the Baseline
1. INTRODUCTION 1.1 Background/Motivation
International trade is an important subject in the field of economics for most countries. The years of being self-sufficient and closed to external markets are over and the world itself is increasingly becoming borderless, allowing for greater exchanges of goods and factors of
production. As such, a study of trade flows between countries, though not a novelty, continues to take centre-stage in the analysis of economic policies.
In particular, European countries tend to trade largely among themselves than with the rest of the world. In contrast to the United States, Europe is still lagging in terms of economic growth. One way in which Europe may catch up in terms of economic growth is via increasing its net exports. Policies that focus on international trade, thus, require detailed analysis of import price elasticity, typology of competitiveness and regulation of open economies in order to construct useful policies. In this sense, the need to correctly estimate import price elasticity becomes pertinent.
Most traditional trade models fail to take into account the new trade theory, leading to seriously under-estimated trade price elasticities. Traditional trade theory explains trade based on relative endowments or differences in productivity when producing homogenous goods. New trade theory, on the other hand, models horizontal product differentiation as a source of intra-industry trade. According to the new trade theory, elasticity of substitution (between
domestically produced goods and foreign produced goods) and import price elasticity tend to be greater than unity (based on Dixit-Stiglitz formulation) and they tend to be equal in industries that produce large varieties of products. However, due to various specification difficulties, the estimated import price elasticities usually portray a downward bias. This, in turn, distorts the proper construction of policy measures to improve trade in these economies.
The objectives of the dissertation are as such. Firstly, the dissertation considers the
increasing importance of vertical product differentiation and quality in trade of goods in Europe. Secondly, it dwells into the possible and contrasting effects of price and quality in the estimation of import price elasticity. In fact, adjusting for quality would allow one to reduce the positive yet indirect effect of product quality through prices from the negative overall relative price effect. Thus, the relative price contribution would be a pure price effect in explaining trade while the positive effect of product quality would be separately captured by the quality proxy. Thirdly, the dissertation tries to estimate the import price elasticities for a sample of 9 European countries over a period of 8 years (from 1996 to 2003). Fourthly, the dissertation extends the analysis to 18 goods sectors and it aims to show that the import price elasticities are usually lower in industries with highly differentiated products relative to homogenous goods sectors. Finally, the dissertation considers the positive impact of quality innovation on trade and also on economic growth as a whole. The dissertation then draws to an end by considering the limitations of this study while proposing possible policy proposals to improve the net exports of Europe in contributing to higher economic growth.
Chapter 1 introduces the dissertation, its objectives and provides an overview of the
motivation behind the topic. Chapter 2 gives an overview of the increasing importance of quality in traded products. This chapter establishes the role of quality improvements on products so as to encourage greater demand for higher quality products within and outside of the economy. The next chapter begins with an introduction of a theoretical gravity trade model that studies the impact of price and quality on trade flows between countries and between sectors. The chapter then proceeds on to introduce the key variables of the gravity equation and describes how they were constructed for the estimation of import price elasticity. Chapter 4 presents the results of the analysis on all the countries involved as well as a sectoral analysis of the sample.
Acknowledging the limited scope of the model, Chapter 5 devotes some attention to the limitations of the model and discusses some policy applications based on simulations that
strengthen the role of quality innovation in increasing trade and economic growth. Finally, this dissertation collates the concluding remarks in the same chapter.
1.2 Descriptive Statistics
The main motivation for this study is to examine the increasing importance of quality trade within Europe. In fact, the Lisbon Agenda was put into place for Europe so as to “lead, compete and prosper as a greener, knowledge-based economy, growing fast and sustainably, creating high-levels of employment and social progress. To achieve this, Europe needs a strengthened industrial base, a modern service sector and a thriving rural economy. As „first mover‟ in
building this society for the future, Europe can derive important benefits by developing competitive, innovative products, rolling out the infrastructure of the future, entering new markets and creating high quality jobs”.
According to a paper written by Fontagné, Freudenberg and Péridy in 1998, despite the low level of trade in varieties, trade in quality has become increasingly prevalent in Europe since the beginning of the 1990s. As such, the roles of quality in trade price elasticities as well as that of quality innovation in trade remain a study of interest for Europe.
When dealing with trade in quality, the question of relative prices becomes all the more relevant. Thus, the concept of competitiveness is useful in assessing the relative strengths of one country compared to another when trading a particular good. A study by Hélène Erkel-Rousse and Françoise Le Gallo (2002), which proceeded the study done by Fontagné et al (1998), uses the concept of price and quality competitiveness in classifying the countries in Europe in terms of their performance. According to their analysis, some countries in Europe perform better in terms of price competitiveness while others fare better in quality competitiveness.
“If unit values reflect costs and the product is homogenous, then countries with lower costs
countries. If a country is a net exporter in quantities, despite the fact that it has higher unit values, then it must be due to quality differences” (Aiginger, 1995). This was the way in which quality competitiveness was distinguished from price competitiveness. With this classification, Erkel-Rousse and Le Gallo were able to dissect the trade performance of 12 OECD countries on the external markets. The table below reproduces the results for the 7 countries on which our analysis is based.
Table 1.2.1: Trade Performance of 7 Countries on the External Markets (Overall Performance of Exporting Countries (rows) on Importing Countries (columns))
Germany France Netherlands UK Italy Spain Ireland
Germany Q Q Q Q Q M France Q Q Q P Q M Netherlands P Q Q Q M M UK Q P P P P P Italy P P M S P M Spain S P S S P M Ireland S M M P Q M
Note: M-poor price competitiveness, P-good price competitiveness, Q-good quality competitiveness, S-structural problem
Source: FLUBIL database (figures from OECD Series C), extracted from Erkel-Rousse and Le Gallo (2002)
From Table 1.2.1, Germany and, to a small extent, France are characterized by good quality competitiveness. On the other hand, Italy and Spain owe their trade performance to price competitiveness when they do not run into structural difficulties. The Netherlands and the UK take on intermediary positions, alternating between price competitiveness and quality
competitiveness. Given this classification, it is reasonable to say that trade in qualities is a dominant phenomenon in Europe. Thus, ignoring quality effects will ultimately downward bias the import price elasticities leading to biased policy prescriptions.
In addition, another study performed by Antoine Berthou and Charlotte Emlinger (2010) also emphasizes the importance of quality in trade. In fact, the authors concluded that the crisis had greatly lowered the demand for high-quality products in the world, while establishing the trend that these countries were trading more in quality rather than variety. Figure 1.2.1 shows the share of high-quality exports in selected European countries and other countries in the world during the crisis period.
Figure 1.2.1: Share of Exporting Countries‟ Value of Exports with High Quality in 2005
Source: Calculations based on tariff-line trade data from United Nations Statistical Division, extracted from study by Berthou A. and Emlinger C. (2010)
According to Figure 1.2.1, most countries in the world export more than 40% share of high quality products, with the exception of Turkey, EU new member states, Russia, India, China and the less developed countries. In considering the more developed countries within Europe, quality does play a large role in determining trade between countries. Thus, this dissertation aims to make appropriate adjustments for quality in explaining trade between the countries as well as draw our attention to the role of quality innovation in promoting higher trade and higher economic growth in these countries.
2. OVERVIEW OF ECONOMIC LITERATURE 2.1 Overview of Price and Quality Effects
Traditional trade models generally ignore the role of product differentiation or quality effects when estimating trade price elasticity. Conforming to the traditional Armington framework (1969), the estimations of trade equations usually produce lower and relatively unstable trade price elasticities. This is because the quality effects are not taken into account. Also, simplifying assumptions such as perfectly competitive markets and homogenous products are assumed under the Armington framework that further distorts the estimation.
When accounting for quality, many authors readdress this bias and obtain relatively higher trade price elasticities, generally superior to 1, which is in line with the theoretical elasticities of substitution. Notably, work by Hummels (1999), Rousse and Daniel Mirza (2002), Erkel-Rousse and Le Gallo (2002) and Crozet and Erkel-Erkel-Rousse (2004) have proven that trade price elasticities do increase significantly, often above 1, when corrected for quality effects.
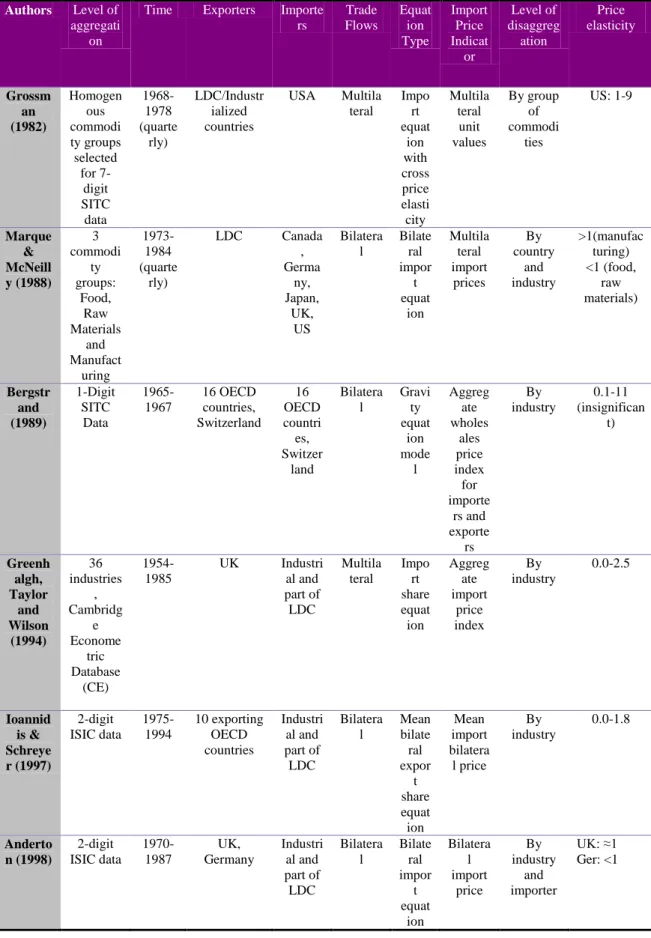
Table 2.1.1 compiles the various estimations of trade price elasticities performed till 2004. The results obtained shed light on the under-estimated trade price elasticities and reveal heterogeneity not only across countries, but also across industries.
Table 2.1.1: Past Estimations on Trade Price Elasticities (1982-2004)
Authors Level of aggregati
on
Time Exporters Importe rs Trade Flows Equat ion Type Import Price Indicat or Level of disaggreg ation Price elasticity Grossm an (1982) Homogen ous commodi ty groups selected for 7-digit SITC data 1968-1978 (quarte rly) LDC/Industr ialized countries USA Multila teral Impo rt equat ion with cross price elasti city Multila teral unit values By group of commodi ties US: 1-9 Marque & McNeill y (1988) 3 commodi ty groups: Food, Raw Materials and Manufact uring 1973-1984 (quarte rly) LDC Canada , Germa ny, Japan, UK, US Bilatera l Bilate ral impor t equat ion Multila teral import prices By country and industry >1(manufac turing) <1 (food, raw materials) Bergstr and (1989) 1-Digit SITC Data 1965-1967 16 OECD countries, Switzerland 16 OECD countri es, Switzer land Bilatera l Gravi ty equat ion mode l Aggreg ate wholes ales price index for importe rs and exporte rs By industry 0.1-11 (insignifican t) Greenh algh, Taylor and Wilson (1994) 36 industries , Cambridg e Econome tric Database (CE) 1954-1985 UK Industri al and part of LDC Multila teral Impo rt share equat ion Aggreg ate import price index By industry 0.0-2.5 Ioannid is & Schreye r (1997) 2-digit ISIC data 1975-1994 10 exporting OECD countries Industri al and part of LDC Bilatera l Mean bilate ral expor t share equat ion Mean import bilatera l price By industry 0.0-1.8 Anderto n (1998) 2-digit ISIC data 1970-1987 UK, Germany Industri al and part of LDC Bilatera l Bilate ral impor t equat ion Bilatera l import price By industry and importer UK: ≈1 Ger: <1
Head & Mayer (2000) 20 digit Eurostat database 1986-1995 12 EC countries 12 EC countri es Bilatera l Gravi ty equat ion mode l Price index at industr y level By industry Average price elasticity ≈1 Erkel-Rousse & Mirza (2002) 3-4 digit ISIC data 1972-1994 12 OECD countries 12 OECD countri es Bilatera l Gravi ty equat ion mode l Bilatera l unit values Pooled and by industry 1-7 Crozet & Erkel-Rousse (2004) 2 commodi ties: consumer goods and other goods 1994-1997 4 EC countries 4 EC countri es Bilatera l Gravi ty equat ion mode l with qualit y proxy Bilatera l unit values By group of commodi ties Average price elasticity >1
Source: Extracted from Erkel-Rousse and Mirza (2002)
The problem of under-estimated trade price elasticities has repercussions on other economic analysis. Notably, these values are pertinent for the evaluation of welfare effects of trade and the consequences of exchange rate policies. Thus, biased policy implications could arise with wrongly estimated trade price elasticities.
In the past, economists have tried to justify such errors via imperfect measurement of trade prices and the potential endogeneity problems that arise from such trade equations. However, Crozet and Erkel-Rousse (2004) highlight that there is another potential source of bias that is being ignored – the role of product quality. Thus, adjustments have to be made to account for quality effects that are inherent in the price effects.
The problem with making corrections for quality in these equations is that quality of a product is usually unobservable. Thus, a good proxy for quality is required. Many authors have used innovation as well as R&D expenditures as quality proxies (Greenhalgh et al, 1994; Ioannidis and Schreyer, 1997; Eaton and Kortum, 2002). In particular, Crozet and Erkel-Rousse (2004) used a survey to establish quality perceptions of goods coming from a competing
country. All these proxies do deliver robust results. As such, our choice of proxy for quality incorporates not only the effect of innovation on product (arising from the direct R&D expenditure in that particular industry) but also knowledge spillovers coming from other industries as well as from other countries that may improve the good further.
2.2 Overview of Endogenous Growth Theory
The Barcelona objective of March 2002 marked the start of Europe‟s concern with
innovation and quality. Indeed, the fact that Europe lagged in terms of economic growth as well as productivity growth incited the European countries to come up with a catch-up program to rival that of the United States. Largely influenced by the endogenous growth theory, Europe focused on investing in innovation, both product (quality) and process innovation, so as to increase the region‟s economic growth as well as close the productivity gap with the United
States.
In particular, the Barcelona objective advocates that the EU member states raise their R&D intensity and expenditures to up to 3% by the end of 2010. However, this time frame was re-adjusted to 2015 in light of the global economic crisis that largely affected the investments on R&D between 2008 and 2009. A policy paper was written by the European Commission on the possible benefits of innovation in these countries (ERASME, 2004). Simulations run on the benefits of innovation report that, with an increase of R&D intensity to 3%, GDP growth of Europe would be 12% higher than the baseline scenario (scenario without a 3% increase of R&D expenditure). As such, the benefits of innovation cannot be understated.
Endogenous growth theory aims to explain the components of technological progress in contributing towards economic growth. Endogenous growth theory attributes technological progress to innovation and investment in R&D as well as investing in human capital (skilled labor). Endogenous growth theorists stress the importance of government in making suitable
policies to affect individual behavior to invest in research and being innovative. As such, knowledge is the key towards economic growth.
Knowledge stock is formulated via positive externalities arising from different sectors. So, the social marginal benefits from accumulating knowledge far outweigh the private marginal gains from investing in research and innovation. In addition, there are spillover effects from investing in R&D. A sector can well benefit from the knowledge accrued by other sectors that have invested in R&D without it investing in its own R&D. As such, knowledge becomes a positive externality since its benefits are shared by third parties who have not incurred any cost of investing in it. Thus, investing in R&D can lead to higher knowledge via direct and indirect means which in turn contributes to higher growth.
2.3 Role of R&D Innovation
The key to explaining endogenous growth is the knowledge stock. Knowledge is accumulated through investing in R&D. This stock of knowledge is then transmitted to
innovation or technological progress. There are two forms of innovation - quality innovation and process innovation. Process innovation leads to an increase in the global productivity of factors. Quality innovation, on the other hand, involves improving the quality of an existing array of products. In addition, it is a means by which to expand the types or varieties of products. This is akin to setting up a new industry. For the purpose of this dissertation, we will only consider the role of quality (product) innovation in explaining technological progress. This is because empirical studies have shown the importance of variety expansion.
Mark Bils and Peter Klenow (2001) concluded that there have been shifts in spending shares wherein consumers buy goods that have a wider variety scope than goods with little changes in variety. These shifts suggest an expansion in product variety. Dinopoulos and Sener (2007) studied the recent developments to the Schumpeterian growth theory and concluded that an expansion in variety does lead to endogenous long term growth. Finally, Broda and Weinstein
(2004) showed that the expansion of variety and trading these varieties across countries can lead to an increase in world welfare. The estimates from this paper show that the welfare of United States improved by 3% due to a rise in imported varieties of products. Thus, the role of
expanding varieties cannot be further stressed in contributing to long term economic growth and welfare.
3. OVERVIEW OF THE GRAVITY MODEL 3.1 The Gravity Model
The gravity model is a useful framework in modeling the development of trade between countries. Gravity models are derived from various international trade theories. In a nutshell, these trade theories try to determine the equilibrium trade flows between two trading countries. The demand for merchandise goods comes from the importing country with the supplier being the exporting country.
The first model used Cobb-Douglas and CES utility functions to derive the demand side of the model (Anderson, 1979). Anderson assumed that consumers differentiated goods by the country of production. A second model based on the model by Armington (1969) used the CES function as well as price levels to derive the demand side of trade flows.
In this study, we adopted the basic model used by Armington wherein Dixit-Stiglitz preferences are used in a monopolistic setting and goods are differentiated according to the countries in which they were produced. The gravity model hence reduces to this simple form:
where reflects the value of manufactures imports from country i (exporter) to j (importer)
for a particular good k over time. reflects export potential of country i in sector k, refers
to the import price index for a particular good k over time. refers to the elasticity of
substitution between domestic and foreign goods. is a preference parameter. It denotes the
preferences for quality of a particular import good coming from the exporting country; in other words, it considers how the quality of a foreign good (import) is viewed in light of that of the domestically produced good. records the distance between the two trading partners. And
finally,
denotes the importer-industry fixed effects where refers to the nominal fixed
effects.
Transforming the above equation in log terms, we use the following equation for our regression.
3.2 Data and Methodology of Model
In this dissertation, we used the data for 9 countries namely Germany, Denmark, Spain, Finland, France, Ireland, Italy, Netherlands and the United Kingdom over a period of 8 years (from 1996 to 2003). In assessing the bilateral trade flows, we only focused on the manufactures import trade for 18 industries. The data is organized wherein each unit of observation
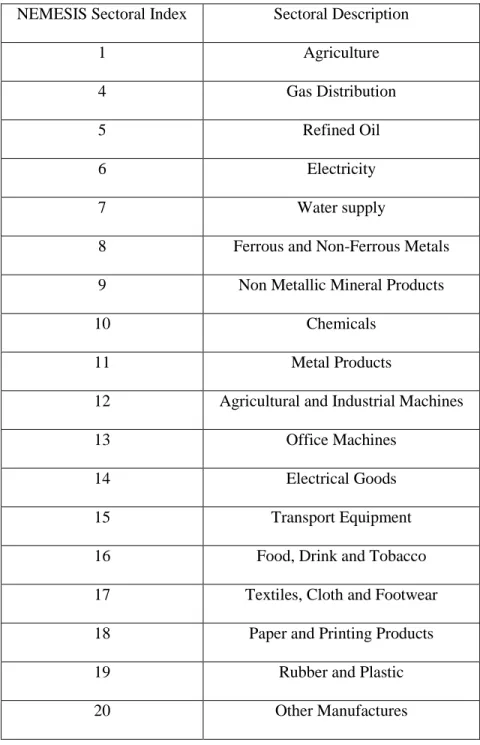
corresponds to a pair of importing and exporting countries for a particular industry or good k over time. The major sources of data are the WIOD (World Input-Output Database), which is an improvement of the EUKLEMS database, for trade data segregated by sectors and the CEPII database for the distance variable. In addition, the quality proxy was formulated using R&D expenditures of the countries in a particular sector as well as using the spillovers from other sectors. These figures were obtained from EUKLEMS database as well. Table 3.2.1 lists the sectors that were considered for our analysis.
For the analysis, we make use of a panel format in handling the dataset with the identifiers measured across sectors and trading partners. We have a total of 10 368 observations (importers x trading partners x years x sectors). Under the panel structure, we run both Ordinary Least Squares as well as Two-Stage Least Squares (using lagged values as instruments). We also allow for sectoral heterogeneity when running the regressions. In addition, some of the trade data has missing values. As such, Poisson estimation is considered in accounting for some of the missing trade values (Westerlund and Wilhelmsson, 2006).
Table 3.2.1: Sector Classification
NEMESIS Sectoral Index Sectoral Description
1 Agriculture
4 Gas Distribution
5 Refined Oil
6 Electricity
7 Water supply
8 Ferrous and Non-Ferrous Metals
9 Non Metallic Mineral Products
10 Chemicals
11 Metal Products
12 Agricultural and Industrial Machines
13 Office Machines
14 Electrical Goods
15 Transport Equipment
16 Food, Drink and Tobacco
17 Textiles, Cloth and Footwear
18 Paper and Printing Products
19 Rubber and Plastic
20 Other Manufactures
3.3 Variables for Analysis
The initial idea of the gravity model is to quantify the factors that affect bilateral trade between two countries. In attempting to estimate the trade price elasticity, we have included some key factors that affect the value of trade imports between countries.
Value of manufactures imports
The dependent variable that we consider for our analysis is the value of manufactures imports from i (exporter) to j (importer). The value of manufactures is measured in USD
millions. They are segregated across sectors over time. This is useful when estimating the import price elasticities for the various sectors of an economy.
Firm size
The parameter captures the export potential of the exporting country. The best way to
proxy the export potential is to use the value of total production for each sector. Unfortunately, due to the lack of time in collating the data, we have opted for a second-best alternative. We used the firm size as a proxy for its export potential. The firm size proxy is formulated based on the number of employees employed in a particular industry. According to Acemoglu and Ventura (2002), the number of varieties a country produces is proportional to its employment. As such, a large firm which employs more workers can be said to have a higher export potential and is capable of producing more varieties than a small firm with fewer employees. In this way, this proxy helps to control for the role of varieties coming from the exporting country.
According to Erkel-Rousse (2002), the optimal number of varieties is an increasing function of production at firm level. Thus an industry with a higher export potential (proxied by higher employment) can be expected to have increasing varieties of goods. As an exporting country, a higher export potential would mean that the exporter is able to cater to the needs of its domestic consumers on top of those of its foreign consumers. As such, we would expect a higher export potential on the part of the exporting country to increase its exports going to other countries, a priori.
Price index
Price indices are often hard to obtain since they are readily unobservable. We use the value of manufactures imports divided by the volume of trade flows between the countries for a particular industry in order to obtain the price indices relevant for our study. These price indices correspond to the price indices from the point of view of the importing country. According to Crozet and Erkel-Rousse (2004), “import unit values would be a more convincing approximation for bilateral prices than export unit values, as the former take into account price competition between exporters at the entry of market j”. Adhering to this reasoning, we focus on import price
indices rather than export price indices for our analysis.
We expect to estimate the import price elasticity that approach unity according to the theoretical models of elasticity of substitution. The estimations of the coefficient of price are given as 1-σ where σ refers to the elasticity of substitution as well as the trade price elasticity. Thus, in order to have a trade price elasticity superior to 1, we need the price index to be negatively correlated to the value of imports. Intuitively, the higher the import prices, the lower the trade of imports since it is more expensive to import these products.
Quality proxy
We understand that the quality of the product can influence the demand of the product from the point of view of the consumer. If the consumer prefers a higher quality product, he is still willing to pay for it despite its higher price. Thus, ignoring the quality aspect of a product leads to an underestimation of the trade price elasticity since it generates a positive correlation between import price indices and the value of manufactures imports. With quality, the relationship between price and imports change.
In this study, we proxy consumer‟s preference for a high quality good using the knowledge variable. The knowledge variable attempts to capture both the R&D expenditure on a particular good as well as other knowledge spillovers arising from innovation performed on other sectors.
With such improvements in innovation on a particular product, we are able to correlate the quality of the product with the amount spent on improving the product via innovation.
The construction of the knowledge variable is slightly complex. We use the value of R&D expenditures in a particular sector as well as the R&D expenditures in other sectors. We convert the R&D expenditures from other sectors via technology flow matrices. These matrices were constructed under the methodology developed by Johnson for the OECD with sectoral
differentiation (Johnson, 2002). Figure 3.3.1 charts the construction of the knowledge variable as a quality proxy.
Figure 3.3.1: Constructing the Knowledge Variable
Source: The NEMESIS Reference Manual (ERASME lab work)
The knowledge variable considers the quality of the imported good. Thus, if the quality of the imported good is high, then this will increase imports coming into the country. So, we expect a positive coefficient when regressing the quality proxy in the gravity equation.
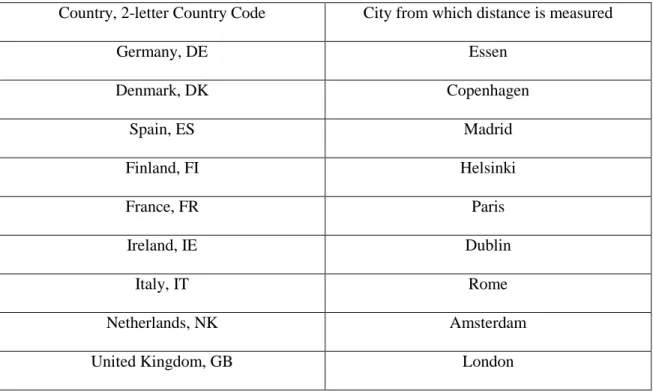
Distance
Distance is measured in kilometers (km) between the largest cities of the trading partners. Table 3.3.1 shows the cities from which the distances were measured. Distance is negatively correlated to trade, as proven by many studies on gravity models. This is because the transport
costs are a lot higher when trading over long distances. Thus, we expect a negative relationship between distance and the value of manufactures imports.
Table 3.3.1: Distance measured from Cities
Country, 2-letter Country Code City from which distance is measured
Germany, DE Essen Denmark, DK Copenhagen Spain, ES Madrid Finland, FI Helsinki France, FR Paris Ireland, IE Dublin Italy, IT Rome Netherlands, NK Amsterdam
4. REGRESSION RESULTS 4.1 General Results
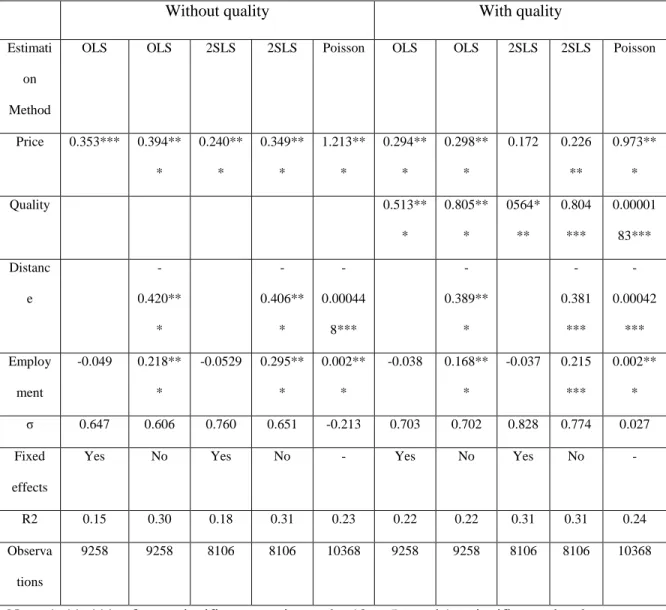
The first set of regressions is based on the entire sample where it includes all countries as well as all sectors. We have considered three types of estimation methods namely the Ordinary Least Squares (OLS), the Two-Stage Least Squares (2SLS) and the Poisson estimation. In addition, we consider the role of including the importer-industry fixed effects for each of the estimation method. In particular, the Poisson estimation has been considered because it accounts for missing trade data for some countries and sectors. According to Westerland and Wilhelmsson (2006), they proposed the use of the Poisson estimation because the usual log-linear estimation method, in the midst of missing trade, can result in highly deceptive inferences. So instead of using log-linear estimation, the Poisson estimation estimates the gravity equation in its true form as shown below.
The authors justified that the use of the Poisson estimation works especially well for small sample size estimations.
Table 4.1.1: General Results (Entire Sample)
Without quality With quality
Estimati on Method
OLS OLS 2SLS 2SLS Poisson OLS OLS 2SLS 2SLS Poisson
Price 0.353*** 0.394** * 0.240** * 0.349** * 1.213** * 0.294** * 0.298** * 0.172 0.226 ** 0.973** * Quality 0.513** * 0.805** * 0564* ** 0.804 *** 0.00001 83*** Distanc e -0.420** * -0.406** * -0.00044 8*** -0.389** * -0.381 *** -0.00042 *** Employ ment -0.049 0.218** * -0.0529 0.295** * 0.002** * -0.038 0.168** * -0.037 0.215 *** 0.002** * σ 0.647 0.606 0.760 0.651 -0.213 0.703 0.702 0.828 0.774 0.027 Fixed effects
Yes No Yes No - Yes No Yes No -
R2 0.15 0.30 0.18 0.31 0.23 0.22 0.22 0.31 0.31 0.24 Observa
tions
9258 9258 8106 8106 10368 9258 9258 8106 8106 10368
Note: *, **, *** refers to significance testing under 10%, 5% and 1% significance level
The results from Table 4.1.1 show the regression performed on the entire sample size. With respect to the price variable, the estimation methods yield somewhat robust results, with the exception of the Poisson estimation. Since the sample size is larger for the entire sample, the Poisson estimation does not seem to work that well. The results are, nonetheless, important in explaining the role of quality in trade.
As predicted, without quality, the import price elasticities of substitution were under-estimated. Adjusting for quality increases the import price elasticities under all estimations.
However, the import price elasticities are still inferior to unity. This could be due to the insufficient industry disaggregation in the dataset (Erkel-Rousse and Mirza, 2002). As the dataset is segregated according to sectors, sector heterogeneity might play a significant role in determining the „true‟ import price elasticities. As such, a sectoral analysis could be useful in
drawing significant conclusions on the import price elasticities. In addition, the price variable is highly significant from the results. Thus, price indices do play a significant role in determining import trade between countries.
The quality proxy is highly significant according to the results above. Indeed, an improvement in the quality of products from the exporting countries (proxied by the R&D expenditure and other externalities that determine the quality of the product) does lead to higher exports from these countries. This conclusion is in line with our intuition. Thus, quality also plays a significant role in determining trade flows between countries.
Distance, as expected, varies negatively and significantly with trade flows. As longer
distances increase transportation costs, countries tend to trade more with neighbouring countries. Thus, distance between trading partners is another significant variable in determining trade flows. Also, the coefficients of the distance variable are smaller than the estimated elasticities of substitution as proven by Hummels (1999). Under this regression, we did not constrain the coefficients of both price and distance to be the same. This is because the results were much more robust without the constraint. Nevertheless, the role of distance remains the same in reducing trade across countries when distance between trading partners rises.
The employment variable is positively significant in all regressions with the exception of OLS (with fixed effects) and 2SLS (with fixed effects). An exporting country with high export potential and higher variety tends to export more products. So, imports of the importing country increase with the export potential of its trading partners. We also note that the coefficient of employment falls with the addition of the quality proxy. This decline is due to the fact that without the quality proxy, the variety or employment variable captures part of the effect of
vertical differentiation. With quality effect, the effects are then differentiated. This is in line with empirical finding that support this negative relationship between quality and variety. Indeed, firms make a trade-off between quality and variety of their products. An exporter that improves his product quality can choose to reduce his product variety and vice versa. According to
Krugman (1979), the parameter relative to the variety proxy should equal unity. Unfortunately in our case, the coefficient of the variety variable does not approach unity and in some cases, even becomes negative. This shortfall is due to the weakness of our proxy. Instead of using total production to proxy for varieties, we used total employment. Even with total production as a proxy, some studies were still unable to support Krugman‟s theory. Thus, we should analyze the role of variety in import trade and in determining import price elasticities with care.
The important variables all have the predicted effects and are significant for the entire sample size. The only shortfall is that the estimated import price elasticities are still inferior to unity. To account for the heterogeneity across the sectors, we next consider a sectoral analysis.
4.2 Sectoral Results
In the earlier regression, we performed estimations on pooled data (including all the
countries and sectors) based on the assumption that all elasticities, be it import price elasticity or production elasticity or distance elasticity, are homogeneous across sectors. In this regression, we relax this assumption and estimate the same kind of equation for each sector respectively.
According to the theory, trade price elasiticities are dependent on the degree of product differentiation as well as the level of industry fragmentation (Krugman, 1979). However, since the effect embodied by fragmentation is proxied by the variety variable, the quality variable is able to pick up the effect of price sensitivity related to product differentiation.
As with the entire sample size, we considered all 3 estimation methods for the sectoral regressions. And, as with the general sample, the results were fairly robust. As such, we have
consolidated the results from these regressions in the following table to allow for easy perusal of the important results.
Table 4.2.1: Sectoral Results
Sector Name Initial σ Adjusted σ Quality Proxy Product differentiation
by Rauch
Product differentiation
by OMSP 1 Agriculture 0.707 0.715 -0.050 HOM HOM 4 Gas
Distribution
2.441** 2.532** 0.624** HOM HOM
5 Refined Oil -0.434* -0.588** 0.259 HOM HOM 6 Electricity 0.463 0.396 0.301 HOM HOM 8 Ferrous and Non-Ferrous Metals 0.761** 0.962* 1.382** HOM HOM 9 Non-metallic mineral products 0.892* 1.113* 0.837*** HOM HOM
10 Chemicals -0.576* 0.864*** 1.869*** DIF HOM 11 Metal Products 0.465* 0.963** 0.540*** DIF HOM 12 Agricultural and Industrial Machines -0.682** 0.021*** 0.965* DIF DIF 13 Office Machines 0.499** 0.500*** -0.019 DIF DIF 14 Electrical Goods -0.142* 0.592** 1.202*** DIF DIF 15 Transport Equipment -0.057* 1.719 0.992*** DIF DIF
and Tobacco 17 Textiles, Cloth and Footwear 1.817 2.125 0.273* DIF HOM 18 Paper and Printing Products -0.084** 0.466*** 0.628*** DIF HOM 19 Rubber and Plastic 1.217* 1.748** 0.401** DIF HOM 20 Other Manufactures -0.812*** -0.265*** 0.583** DIF DIF
Note: *, **, *** refers to significance testing under 10%, 5% and 1% significance level
According to the results above, some of the sectors show an import price elasticity higher than 1 whereas others still display an increase in their price elasticities with quality adjustments, except for the Electricity sector which reports a decrease in elasticity after quality adjustment. These values were obtained by running the regressions using 2SLS estimator although the results were robust for both the OLS as well as the Poisson estimations.
Lancaster (1979) was an early contributor to the study of product differentiation. He defined good as a product with various characteristics and sector as a group of products with similar characteristics. A differentiated product is, then, a product that has different combinations of characteristics with consumers having heterogeneous preferences over that product. Given two goods with varying proportions of characteristics, the good which has more of each
characteristic is deemed qualitatively better and more expensive. For the purpose of our study, we conform to Lancaster‟s definition of product differentiation.
The final column of Table 4.2.1 records the type of product classification, be it homogenous (HOM) or differentiated (DIF). This product classification is based on Rauch‟s calculations (1996) as well as the work of Oliveira-Martins, Scarpetta and Pilat (OMSP, 1996) on STAN sectors. However, the sectoral classification in our case differs slightly from that of STAN
sectors since there are more sectors under STAN. As such, we had to regroup certain sectors such that they conform to the calculations performed by Rauch and OMSP. Given this limitation, it is possible that some sectors though they seem to produce differentiated products have
relatively high import price elasticities that correspond to those of the homogenous sectors. For instance, the Transport Equipment sector, despite being categorized as a sector that produces highly differentiated products, portrays an import price elasticity that is relatively high and even superior to 1. Likewise, certain homogenous sectors also portray relatively low import price elasticities which correspond to those of differentiated sectors. For instance, the Food, Drink and Tobacco and Electricity sectors have low import price elasticities. This incoherence has to do with the limitation of sectoral and product classification. In addition, there are missing trade values for the Electricity sector which thus produces a biased result. As such, keeping in mind these shortfalls, we can proceed to analyze these results with care.
The industries with low product differentiation have relatively higher import price
elasticities when compared to the industries with high product differentiation. Under the OMSP classification, the industries with relatively higher price elasticities are mostly homogenous goods producing sectors or non-industrialized sectors like Agriculture, Gas Distribution, Ferrous and Non-Ferrous Metals, Non-Metallic Mineral Products, Chemicals, Textiles, Cloth and Footwear and Rubber and Plastic, where the estimated elasticities range between 0.8 and 2.5. The sectors with high product differentiation or largely industrialized sectors had relatively lower elasticities of substitution ranging between 0.3 and 0.8. Out of the 12 sectors with common classification under both Rauch and OMSP calculations (of which 7 are homogenous-goods sectors), 4 of the homogenous (non-industrialised) industries had relatively higher elasticities of substitution.
These results do not display the same results in terms of magnitude where earlier studies recorded the range for homogenous sectors to be between 3.5 and 6 while for the differentiated sectors to be between 3.5 and 4.0. Nevertheless, these results are in line with the sectoral results
derived by a similar study performed by Erkel-Rousse and Mirza (2002). In addition, the results seem to comply with previous work performed on sectoral data as displayed by Table 2.1.1 in Chapter 2. Notably, sectors that produce differentiated and industrialized products tend to display lower import price elasticities as shown above. This is in line with the theory based on monopolistic competition. The notable sectors that have an import price elasticity superior to 1, conforming to the theoretical estimation of elasticity of substitution, are Ferrous and Non-Ferrous Metals, Non-Metallic Mineral Products, Transport Equipment, Rubber and Plastic and Textiles, Cloth and Footwear. With the exception of Transport Equipment, the results seem to coincide with past empirical work that proved that industries producing homogenous and non-industrialized products tend to have higher price elasticities than industries producing
differentiated and industrialized products.
Now, we consider the role of quality innovation on import of these products. Most of the coefficients found produce a highly positive and significant effect of quality on imports with the exception for Agriculture, Office Machines and Other Manufactures sectors. Classification of the sectors may have led to slightly biased estimations for Office Machines sector and Other Manufactures sectors, leading to the loss of significance of the quality variable. For the case of the agricultural sector, we experience a negative and insignificant impact of quality
improvement on imports. Europe is renowned for its highly protective agricultural sector. Under the Common Agricultural Policy (CAP), the agricultural sector is promised high subsidies which result in inefficient production as well as over-production of agricultural products which is used to feed the domestic population. As such, it is reasonable to argue that under the climate of heavy protectionism, quality improvements are not encouraged and will not be pertinent in increasing imports in this sector.
Nevertheless, for most of the sectors, the impact of quality innovation is positive and highly significant. Thus, an improvement in the quality of exporting goods leads to an increase in its exports. A 1% increase in product quality leads to higher imports varying between 0.2% and 2%.
The sectors that display relatively high coefficients for quality are Ferrous and Non-Ferrous Metals, Chemicals, Agricultural and Industrial Machines, Electrical Goods and Transport Equipment. These industrialized sectors (with the exception of Ferrous and Non-Ferrous Metals) have large scope for product differentiation. Thus, quality improvements are more useful in these sectors than in others.
We, now, proceed on to look at the import price elasticities of the importing country given quality adjustments. The results are consolidated based on the various estimation methods, be it OLS, 2SLS or Poisson estimations. The results are robust across the estimation methods which add more credibility to our results. The import price elasticities reported are the average import price elasticities from the various estimation methods.
Out of the sample of 9 countries, only 4 countries namely Germany, Ireland, Netherlands and the UK have shown an import price elasticity superior to 1. These are the countries that portray relatively high sensitivity to prices (the substitution elasticity ranges between 1.1 and 1.6). Relatively high import price elasticity has been portrayed by France. For Ireland and Netherlands, the import price elasticities were reported to be superior to 1 even without quality adjustments. With quality effects, the elasticities still increased for these countries. Overall, all the countries in the sample do improve their import price elasticities when they have been adjusted for quality effects. Spain is the only country that displays an import price elasticity which is negative. Nonetheless, its import price elasticity does see an improvement with the addition of the quality variable. The results have been tabulated below in Table 4.2.2.
Interestingly, the countries with relatively high import price elasticity tend to be the less rich countries. We would expect larger and richer economies like Denmark and Finland to display higher import price elasticity. According to Imbs and Méjean (2010), rich countries tend to import goods that are not substitutable, while the reverse is true for large developing countries. Thus, this is one explanation as to why richer countries like Denmark and Finland display lower import elasticities as opposed to countries like Germany, France and the UK. In addition, the
importance of specialization of industries also determines the elasticities. Since the service industry is exempted from this study, it might bias the „true‟ import price elasticities for some
importing countries that focus more on service trade rather than goods trade like Finland and Denmark. Also, domestic consumers may prefer imports from other trading partners that are not included in this study so it might weaken the estimation of import price elasticity for some countries like Spain which trades intensively with Switzerland and Russia. We also do not consider the role of re-exports in these regressions. Thus, these results neglect the role of some countries like Ireland that serve as gateway to Europe markets for non-European products. Thus, these results need to be consulted with these shortfalls in mind that might bias the estimation of the „true‟ import price elasticities.
Table 4.2.2: Import Price Elasticity by Importing Country
Importing Country Initial σ Adjusted σ
DE (Germany) 0.796 1.124 DK (Denmark) 0.418 0.487 ES (Spain) -0.746 -0.563 FI (Finland) 0.169 0.230 FR (France) 0.787 0.887 IE (Ireland) 1.291 1.557 IT (Italy) -0.247 0.232 NL (Netherlands) 1.481 1.577 UK (United Kingdom) 0.218 1.243
We further proceed on to investigate the impact of quality innovation on exports for each exporting country in a given importer domestic market. Using the same regression equation, we
try to see how much an increase of 1% level of quality of the exports leads to an increase of exports in a particular market which is given by the coefficient of the quality variable. If an increase of 1% of quality leads to a large increase in exports, it must mean that the exporting country gains greater market share in the domestic market and this can be deemed as
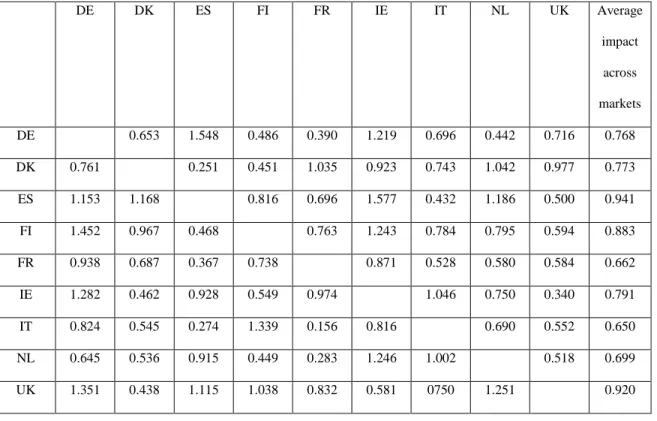
competitive. Thus, we run the following regression for each exporter on each importing market and the results are tabulated in Table 4.2.3. The values presented in Table 4.2.3 are the average values taken from all the possible estimation methods. As the values are quite robust across the methods, it is possible to take an average of these values. All these values are positive and significant at 10% significant level, thereby supporting the notion that a country can improve its competitiveness in a domestic market via improving the quality of its product.
According to the results of the regression (presented in Table 4.2.3), all exporting countries benefit from quality innovation by increasing their exports on average by more than 0.6% for a 1% increase in quality innovation. Notably, exporters that have the highest coefficients for their quality variable are Spain, Finland and the UK. These countries are able to increase their exports on average from 0.8 to 0.9% for a 1% increase in quality innovation. Different countries perform differently in various importing markets as seen from the wide ranges of coefficients in the various markets. As such, it is hard to generalize the effect of an increase in exports for an improvement in quality. Nevertheless, it is true that trade in quality is a dominant phenomenon in Europe and hence improving quality does significantly contribute to higher export shares for the various exporters.
Table 4.2.3: Impact of 1% Increase in Product Quality on Exports where Rows refer to Domestic Markets and Columns to Exporting Countries
DE DK ES FI FR IE IT NL UK Average impact across markets DE 0.653 1.548 0.486 0.390 1.219 0.696 0.442 0.716 0.768 DK 0.761 0.251 0.451 1.035 0.923 0.743 1.042 0.977 0.773 ES 1.153 1.168 0.816 0.696 1.577 0.432 1.186 0.500 0.941 FI 1.452 0.967 0.468 0.763 1.243 0.784 0.795 0.594 0.883 FR 0.938 0.687 0.367 0.738 0.871 0.528 0.580 0.584 0.662 IE 1.282 0.462 0.928 0.549 0.974 1.046 0.750 0.340 0.791 IT 0.824 0.545 0.274 1.339 0.156 0.816 0.690 0.552 0.650 NL 0.645 0.536 0.915 0.449 0.283 1.246 1.002 0.518 0.699 UK 1.351 0.438 1.115 1.038 0.832 0.581 0750 1.251 0.920
Each exporting country does better in some markets than in others. Germany is able to increase more of its export share in Spain and Ireland. This suggests that German products are highly demanded in these markets due to its higher quality. Likewise, Denmark is able to compete in quality in France, Netherlands and the UK. Spain, on the other hand, experiences quality competition in most markets like Germany, Denmark, Ireland and Netherlands. This can be explained by the fact that Spain has been increasing its expenditure on R&D progressively over the years. Thus, the impact of quality innovation is larger in Spain since a 1% increase in quality for its initial poorer quality exports has more effect in the importer markets as opposed to an improvement in quality of an initially high-quality product.
Finland experiences quality competition in Germany and Ireland while France experiences quality competition in Germany. Ireland is able to compete in quality in Germany while Italy competes in quality in Finland. For Netherlands, quality improvements can increase exports to
Spain, Ireland and Italy while for the UK, such an increase in quality leads to higher exports to Germany, Spain, Finland, France as well as Netherlands.
Countries like Finland, Germany, Denmark and France spend a high percentage of their GDP on R&D. As such, an increase in quality improvements is likely to have less impact for these countries since the quality of their products is already quite high. However, Finland, despite spending the most in R&D, is still able to increase its exports on average by 0.883%. This further supports the notion that quality improvements are very important for exports in the long run. Finland has maintained an average R&D expenditure of 3.21% of its GDP over the periods from 1996 to 2007. Thus, such efforts to increase R&D expenditure as advocated by the Lisbon Agenda can help countries to continue growing via export-led growth when the threshold of 3% R&D expenditure is attained.
Table 4.2.4 compiles the R&D expenditure in percentage of GDP for all the 9 countries over the periods 1996 to 2007. As observed, Finland spends the most among the other countries in R&D while Spain ranks the least. The intermediate spenders like the UK experience a
reasonable amount of growth in exports through quality innovation. Countries with poor quality products have much to gain since a slight improvement in its product quality can go a long way. Likewise, in the long run, by maintaining a relatively high level of quality innovation, countries can still experience export-led growth like in the case of Finland.
Table 4.2.4: R&D Expenditures from 1996 to 2007 (% GDP) DE DK ES FI FR IE IT NL UK 1996 2.19 1.84 0.81 2.52 2.27 1.30 0.99 1.98 1.87 1997 2.24 1.92 0.80 2.70 2.19 1.27 1.03 1.99 1.81 1998 2.27 2.04 0.87 2.86 2.14 1.23 1.05 1.90 1.80 1999 2.40 2.18 0.86 3.16 2.16 1.18 1.02 1.96 1.87 2000 2.45 - 0.91 3.34 2.15 1.12 1.05 1.82 1.86 2001 2.46 2.39 0.91 3.30 2.20 1.10 1.09 1.80 1.83 2002 2.49 2.51 0.99 3.36 2.23 1.10 1.13 1.72 1.83 2003 2.52 2.58 1.05 3.43 2.17 1.18 1.11 1.76 1.79 2004 2.49 2.50 1.06 3.45 2.15 1.25 1.10 1.79 1.72 2005 2.49 2.45 1.13 3.48 2.11 1.26 1.10 1.75 1.77 2006 2.55 2.47 1.21 3.43 2.12 1.32 1.14 1.75 1.80 2007 2.55 2.57 1.28 3.47 2.10 1.34 - 1.75 1.84 Average 2.42 2.31 0.99 3.21 2.17 1.22 1.07 1.83 1.82 Source: http://www.nationmaster.com
5. POLICY CONCLUSION
5.1 Policy Applications and Limitations
Based on the regression results from above, we can focus on some limitations pertaining to our study.
Dataset
The first limitation has to do with the dataset. The dataset for our study is based on the dataset by WIOD which serves to improve the EUKLEMS dataset. The major difference between the two datasets has to do with the classification of the sectors. Indeed, the EUKLEMS dataset included a more detailed segregation of the sectors into almost 72 industries whereas the WIOD database reduced them to almost 31 sectors with 18 of them being goods sectors. For the purpose of our study, we attempted to re-classify our entire dataset under the 18 sectors. This may have led to combining some sectors under one classification which could have biased our results. This could be one explanation as to why some sectors did not show an import price elasticity superior to 1. Nevertheless, this dataset is the first step towards improving sectoral data and as such this study proves to be pertinent in exposing some weaknesses of the dataset which can be worked on further for future use.
Gravity Equation
Most of the past work done on estimating trade price elasticities used relative trade values rather than absolute trade values. Indeed, the dependent variable is usually the import shares between i and j relative to import shares between i and the competitors of j. Similarly, the price indices and the quality variables used were also in relative terms. Thus, the coefficients were able to portray the relative strengths of the trading partners. However, we implemented an absolute approach for our study. This is largely due to the time constraint as well as the lack of
relevant software program to help determine relative values for our study. This is another reason as to why our results did not achieve the expected trade price elasticities superior to 1.
Nevertheless, we were able to prove that quality does improve the trade price elasticity by increasing its value. Thus, an extension of this dissertation would be to run the regressions based on relative terms.
Econometric Techniques
Most prior work done in this field used sophisticated economics and econometric techniques in estimating the „true‟ import price elasticities. Indeed, Erkel-Rousse and Mirza (2002) showed
that the problem of price mis-measurement and price endogeneity can be avoided through the use of more sophisticated instruments. In our study, we used simple instruments (lagged values as instruments) in addition to the simple gravity equation so as to attempt to calculate the import price elasticity. As such, the relatively weak results can also be attributed to the lack of
sophistication in the econometric technique used.
Nevertheless, this study has been greatly useful in establishing the downward bias in the estimated trade price elasticity, when quality effects are not considered. As such, quality as well as product differentiation offer a new direction by which to increase trade flows between trading partners. As European member countries largely trade among themselves, an attempt to increase the trade flows within this region through quality innovation is largely recommended based on our results.
Policy Application
Based on our results and empirical evidence, it is evident that Europe is positioned as a provider of high quality. However, the long run position in quality competition is rivaled at both ends of the quality spectrum. Indeed, other countries are catching up in terms of quality
needs to speed up its quality upgrading to contest its new and existing rivals. One possibility is to increase its investment in quality innovation.
In considering policy applications pertaining to quality improvements, a program that advocates greater quality innovation can help to improve economic growth as well as net exports of these countries under this climate of increasing trade in qualities in Europe. In fact, a research paper by the ERASME Research Team (2004) had done the simulations related to increasing the R&D effort to up to 3% by 2010 for the Europe. The simulation results will be highlighted below, in a bid to show that, given our own results for the role of quality innovation, an intensive effort to increase the R&D effort in Europe does indeed lead to greater long term economic growth.
The paper used the NEMESIS simulation to quantify the positive impact of intensifying R&D efforts to up to 3% under the Barcelona objective. The NEMESIS model (New
Econometric Model of Evaluation by Sectoral Interdependency and Supply) is a model designed by the ERASME team under the funding of the European Commission in July 2002 in a bid to analyze the consequences of Europe adhering to the 3% Barcelona objective. Under the NEMESIS simulation, results were obtained for selected countries like Greece, France and Belgium as well as the continent of Europe. Figure 5.1.1 shows the simulation for the entire Europe zone.
Figure 5.1.1: GDP and its Components in Europe in % deviation with respect to the Baseline
Source: ERASME Research Policy Paper (2004)
According to the results shown above, an intensification of R&D effort helps to raise GDP of Europe by 12% in 2030. Thus, quality innovation reaps largely positive results since it is capable of leading to higher economic growth via higher exports which rise by almost 14% in 2030. Since trade in qualities is increasingly dominant in Europe, improving product quality does lead to higher exports for Europe as well as higher domestic consumption which both lead to higher economic growth in the long run.
In considering the sectoral analysis for R&D intensification, the simulations produce the following results for a group of countries namely Sweden, Belgium, France and Greece as well as sectoral results for the whole of Europe. The results are presented in Figure 5.1.2.
Figure 5.1.2: Sectoral Comparison in Europe in 2030, Production and Employment in % deviation with respect to the Baseline
Source: ERASME Research Paper (2004), extracted from Brussels Federal Planning Bureau working paper 3-05 (2005)
According to the results above, R&D innovation leads to higher production in sectors that produce highly differentiated products namely Ferrous and Non-Ferrous Metals, Agricultural and Industrial Machinery, Electrical Goods and Textile, Clothes and Footwear. These results parallel our results where we showed that Chemicals, Agricultural and Industrial Machines, Electrical Goods and Transport Equipment are the sectors that display relatively high coefficients for quality as these sectors have large scope for product differentiation. Thus, quality improvements are more useful in these sectors than in others. The results also vary across countries. Some countries, especially the countries that initially had low R&D expenditures, reap much more than those countries with high initial R&D expenditures since these countries have more to catch up to so as to reach the 3% target. Even though, the results bode well for Europe, not all countries will gain in the same way as the others. As such, it is important to have buffer policies for countries to fall back on when their effects are slightly less positive compared to the others.
An appropriate extension to our own study would thus include running simulations based on our own quality coefficients so as to check if we do achieve similar results as produced by the ERASME Research Team. Nevertheless, we do believe that our simulation results would approach those produced by the afore-mentioned study since there are similarities between our results and theirs. As such, the policy implication of this paper would be to intensify efforts so as to improve product quality and increase the scope for product differentiation.
5.2 C
onclusion
This dissertation identified that trade price elasticity is more than often under-estimated due to the lack of adjustment for quality effects. This dissertation found that adjusting for the quality effects increased the estimated import price elasticities for the general sample although the elasticities of substitution still failed to be higher than 1. However, the results improved under
the sectoral analysis. All the sectors experienced an increase in the estimated elasticity of substitution with quality adjustments. In particular, the sectors which recorded an import price elasticity superior to 1 are those which produce highly homogeneous and non-industrialized products like non-metallic mineral products, textiles, cloth and footwear and rubber and plastics. The dissertation also showed that 4 countries namely Germany, Ireland, Netherlands and the United Kingdom showed an import price elasticity superior to 1 upon adjusting for quality.
The dissertation also explored the importance of quality innovation on trade. We identified 3 exporting countries namely Spain, Finland and the United Kingdom as the countries that gain the most through quality innovation. The role of quality innovation has a significant effect on increasing overall trade for the region. In fact, quality innovation of 1% on the part of the exporters increases their exports by a range of 0.2 to 1.2 percentage points. In addition, the sectors that benefit the most from quality innovation are those industries with wider scope for product differentiation like Chemicals sector, Electrical Goods sector, Agricultural and Industrial Machines sector and Transport Equipment sector. As such, quality innovation should be strongly encouraged to increase trade flows of the countries so as to increase the economy‟s overall
growth. Such a policy is supported by the NEMESIS simulations run on the case of Europe and Belgium that proved that an intensification of R&D efforts to up to 3% in Europe leads to higher long term growth for the region (12% GDP growth with 14% export growth).
Hence we conclude that quality adjustments are important in estimating the „true‟ import
price elasticity. Such an estimation, if done correctly, can help in making suitable policies such as R&D policy so as to contribute to export-led growth in the long run for the economies.