Any correspondence concerning this service should be sent
to the repository administrator: [email protected]
This is an author’s version published in:
http://oatao.univ-toulouse.fr/22387
Official URL
DOI : https://doi.org/10.24084/repqj16.231
Open Archive Toulouse Archive Ouverte
OATAO is an open access repository that collects the work of Toulouse
researchers and makes it freely available over the web where possible
To cite this version:
Caux, Stephane and Rostirolla, Gustavo and Stolf,
Patricia Smart Datacenter Electrical Load Model for Renewable Sources
Management. (2018) In: International Conference on Renewable Energies
and Power Quality (ICREPQ 2018), 21 March 2018 - 23 March 2018
(Salamanca, Spain).
Preparation of full paper for the International Conference on Renewable
Smart Datacenter Electrical Load Model for
Renewable Sources Management
Stephane Caux†, Gustavo Rostirolla∗†, Patricia Stolf∗
†LAPLACE UMR5213, University of Toulouse, INPT, UPS, CNRS, France
∗IRIT, University of Toulouse, F-31062 Toulouse, France
{gustavo.rostirolla,patricia.stolf}@irit.fr
Abstract. Nowadays, datacenters are one of the most con-suming devices due to the increase in cloud, web-services and high performance computing demands all over the world. To be clean and without connection to the grid, datacenters projects tempt to feed electricity with renewable energy sources and storage elements. This power production needs an energy management providing power envelopes as a constraint to the datacenter management system. This paper presents an opti-mization module that optimizes the IT load under renewable energy constraints and outputs the power consumed by the computing resources of a datacenter. We are able to obtain a reduction of up to 73% in the tasks violations while respecting a given power envelope.
Key words
Renewable Energy, Cloud Computing, Workload, Scheduling, Energy Consumption.
1. Introduction
Datacenters are now one of the biggest actors when talk-ing about energy consumption. In 2006, datacenters were responsible for consuming 61.4 billion kWh in the United States [1]. In 2010, datacenters consumed about 1.3% of world’s electricity [2]. We must also take into account that high energy consumption not only results in large electricity costs, but also incurs in high carbon emission. In the United States for instance, generating 1 kWh of electricity emits about 500g
of CO2in average. As a result, IT (Information Technology)
carbon footprint occupies 2 percent of global greenhouse gas emissions [2].
Supplying datacenters with clean-to-use renewable energy is therefore essential to help mitigate climate change. With renewable energies in datacenters, constituting a micro-grid (here solar panels, wind turbines and batteries) we believe that we can cope with this problem. Even though several efforts have been conducted at the computing level in datacenters partially powered by renewable energy sources, mainly con-cerning tasks placement and energy saving (peaks cancellation, average energy level setting...) [3], [4], there is still a lack on approaches that consider both power producing elements prediction and the IT load model part. Since energy efficiency in datacenters is directly related to the resource consumption of a computing node, performance optimization and an efficient
load scheduling is essential for energy saving. Today, we observe the use of cloud computing as the basis of datacenters, either in a public or private fashion. Such computer tasks management is first optimized by Virtual Machine (VM) management [5], where tasks should be placed, along with an energy consumption model to describe the task’s consumption depending on the resource description (processor and memory power characteristics) and task’s demand (resources usage) with respect to Quality of Service (i.e. their due dates).
To address the IT load scheduling while considering the renewable energy available we propose Renewable Energy Constrained Optimization (RECO) an optimization module which takes into account IT load model and computing re-sources power consumption to schedule batch tasks (which contains release time and due date) in a cloud datacenter while respecting power envelopes provided by a power manager (based on weather forecasting, states of charge of storage elements...). We also highlight that the model proposed is part
of the ANR Datazero project1 and in this context RECO aims
at maximizing the Quality of Service (QoS) with a constraint on power, based on several possible power envelopes using only renewable energy sources. We don’t consider the clas-sical power Grid. We propose RECO and evaluate with a comparison between classical greedy algorithms and meta-heuristics scheduling constrained by a given power envelope. RECO not only output QoS metrics but also the electrical load expected (in form of a time series) for each scheduling, which could be used by the power management system to optimize source/storage engagement.
The remainder of this article will present the classical approaches on IT-load scheduling with and without renewable energy sources in Section 2. In Section 3 we present RECO in details, followed by the evaluation methodology and Results in Section 4. Finally, Section 5 presents final remarks, high-lighting the contributions with quantitative data and presenting directions on future work.
2. Related Work
With the rapid growth in datacenters energy consumption, the reduction of energy usage and utilization of green energy sources becomes a major concern. We present some of these research initiatives, mainly related to the energy aware task
1http://www.datazero/.org
scheduling in datacenters. The techniques employed in each work vary but we can classify them in two groups: one that aggregates green energy to the datacenter trying to maximize the green energy usage, and second group that tries to minimize the overall energy consumption, disregarding where the energy comes from.
Concerning the first group, Goiri et al. [3] proposes GreenSlot, a batch job scheduler for a datacenter powered by photovoltaic panels and the electrical grid. The scheduler works based on a predicted amount of solar energy that will be available, and schedules the workload to maximize the green energy consumption while meeting the jobs deadlines. If grid energy must be used to avoid deadline violations, the scheduler finds the cheapest point before the deadline. Another work from Beldiceanu et al. [4] presents EpoCloud, a prototype aims at optimizing the energy consumption of cloud datacenters connected to the regular electrical grid and to renewable energy sources, aiming to find the best trade-off between energy cost and QoS degradation, using application reconfiguration or jobs suspension and dynamically turning on/off the computing resources.
Regarding the second group, Beloglazov et al. [6] proposes an energy-aware resource provisioning and allocation algo-rithm that aims to improve the energy efficiency of a datacenter without violating the negotiated Service Level Agreement (SLA). The approach is based on VMs migration using upper and lower thresholds. Wu et al. [7] designed a scheduling algorithm for the cloud datacenter with a Dynamic Voltage Frequency Scaling (DVFS) in order to reduce the total energy consumption in a cloud datacenters.
As we can observe techniques are employed in order to reduce the brown energy consumption, such as node consoli-dation and DVFS. Nevertheless, in the best of our knowledge there is a lack of a model that considers not only the datacenter load and infrastructure, but also considers the several moments where renewable sources and batteries could be engaged by the power side. To do so, we propose Renewable Energy
Constrained Optimization (RECO) an optimization module
to schedule tasks in a cloud datacenter while respecting the amount of power available during a time period provided by a power manager, minimizing the number of due date violations based on several power profiles provided. Even though the management is performed considering previous knowledge of all tasks, in this paper we focus not only on power and QoS optimization criteria but also computation time to obtain the best solution. We explore classical greedy algorithms and meta-heuristics constrained by the power available during a time period.
3. RECO - Renewable Energy Constrained Optimization
This section describes the Renewable Energy Constrained Optimization (RECO) an optimization module including IT electrical load-model that aims to integrate IT and power architectures in order to generate scheduling plans (list of tasks to be placed in a resource of the datacenter) that are feasible from the power part when considering renewable energy sources only (in our case: Solar Panels, Wind Turbines and Batteries), while maximizing the QoS (minimizing due
date violations) and providing the electrical load expected (in form of a time series) for the power manager.
A. The Principles of RECO
IT scheduling problems consist in allocating tasks in a smart way, on the computing resources that consume electricity under constraints depending on the IT platform current state and on energy availability. Several levels of decision are con-cerned as IT resource management (server switch on/off, pro-cess migration, voltage and frequency scaling, among others). On the other side we have the power systems where several power profiles could be provided depending on the moment when the renewable energy is produced and how batteries are managed. The main idea consists in combining both IT smart-load model and Power management system in order to maximize the IT-QoS within the limitations of a datacenter powered by renewable resources. Bellow we describe in details how we represented each part of the systems.
i. IT Model: In this section we present the characterization of the tasks, machines and their power consumption model.
In this work we focus mainly on batch tasks. Each task j received by the datacenter server, contains the following
information: tj which represents the execution time for the
task j on a reference machine; memj which is the requested
memory, rjrepresents the release time of the task (the moment
in which the task can start to be executed) and finally dj that
represents the deadline (or due date) of this task. The IT-QoS metric used in this case is the number of due date violations that occurred during a determined scheduling plan.
Each machine h is characterized by the following
parame-ters: shwhich represents the state of the host h (on/off); Pf ix h
represents the fixed idle power consumption of a machine;
Pf h is a coefficient which depends on the dynamic power
consumption for a given frequency f; memh represents the
memory available in the machine; c represents the number of processing elements available in the machine (cores or
processors for instance); and finally {f } which is a set of
possible frequencies for the processing element c. Based on
Mudge [8] we adopted the equation P = Pf ix h+ Pf hf3 as
the machines power consumption model.
ii. Power Envelope: The power management module is
responsible to deliver power for the datacenter, and in our case this power must be provided by renewable energy sources only. To do so several constraints to elaborate feasible power profiles must be taken into consideration. Regarding this, we can highlight the renewable energy profile (wind prediction by period, solar radiation by period), the state of charge for short and long term storage elements (batteries) and also the constraints of these storage elements regarding the power per source (minimum and/or maximum levels), or even the limitation of the variation of current over a given duration and power electronics control. The power envelope provided by
the power system is represented as a set of intervals [t0, t1]
with a constant power available p, where the time interval can be defined according to the desired granularity. Here we also
call each interval “steps” and all the steps between t0and tna
time window. Below we describe the power dispatching model providing input constraints to our load manager program:
- Fixed-Sizing: Photovoltaic panels and wind turbines charac-teristics; Battery Capacity (A.h); Max Power (W ).
- Meteorology forecasting (depending on geographical posi-tion, date, season, etc.): Solar radiation; Wind forecasting.
- All power references: Pi,k Power delivered by source i
during interval k.
B. Optimization Program Architecture
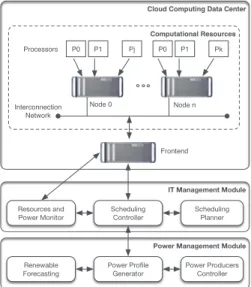
RECO focuses on integrating both power and computing systems to provide a power constrained optimization. In Fig-ure 1 we present an architectFig-ure in which RECO could be integrated. In this figure we can observe two main compo-nents, (1) IT Management Module and (2) Power Management Module. The IT Management Module is where RECO would be located, more specifically in the scheduling planner, to optimize the tasks placement in a cloud datacenter respect-ing power envelopes provided by the Power Management module while maximizing the QoS (minimizing the due date violations). At the bottom, the Power Management Module (not detailed here) is responsible for analyzing the available renewable power sources and storage elements to provide the feasible power envelopes. This interaction is fundamental to profit as much as possible from the renewable energy sources and IT internal performances (processors, memories, node connections constituting the ’Cloud Computing Data Center’ which is detailed in the upper level in this figure).
Power Management Module IT Management Module
Resources and Power Monitor
Cloud Computing Data Center Computational Resources Node 0 Node n Processors Interconnection Network P0 P1 Pj P0 P1 Pk Frontend Scheduling Controller Scheduling Planner Renewable Forecasting Power Profile Generator Power Producers Controller
Fig. 1. RECO - Renewable Energy Constrained Optimization architecture, highlighting two modules: (1) IT Management Module responsible for man-aging all the IT resources in the cloud; and (2) Power Management Module responsible for engaging the power sources and providing power envelopes.
The interaction between the two modules occurs in the following way: (a) a set of possible power envelopes (profiles) is generated by the Power Management Module based on the green energy available and the current state of the storage elements; (b) when tasks arrive, the IT Management Module will request the power envelopes available and schedule the tasks respecting these envelopes; (c) the IT side evaluate the scheduling plans and decides which power envelope provides the best QoS; (d) the IT side communicates to the power side which envelope will be used (in form of a power profile) and starts the scheduling and resource allocation process.
In this scenario there might be some adverse situations, in which the scheduling might have to be changed. Especially regarding the green energy production, we can have situations such as inaccurate weather prediction, which would change the whole power production predicted for a time window. In these situations, the power side can either decide to engage the storage elements to respect the power profile agreed, or send an alert to the IT module to change the scheduling from that point forward based on new possible profiles.
Considering the presented descriptions, RECO introduces the concept of “Power Envelope Agreement” for tasks schedul-ing in cloud datacenters which will be one of the aims of the Datazero project. The focus of this work is mainly in the IT management module, more specifically in the scheduling planner and the impact of different power profiles. Yet, we also present how the interaction and the details of how each module could be implemented in the following sections. C. Power Management Module
The Power Management Module is in charge of manag-ing all the distributed power production to the datacenter. This module will send power envelopes that are feasible to be achieved based on renewable power prediction and the available energy in storage elements. After that, it is also in charge of engaging these elements to deliver the power to the datacenter.
i. Renewable Forecasting: The renewable energy forecast-ing is a widely studied topic [9]. Considerforecast-ing photovoltaic panels and wind turbines authors rely on methods such as: (1) Time series; (2) Numerical weather prediction; (3) Satellite images based forecasting; and (4) Sky vision based forecasting. These methods can be used accordingly to the desired accuracy (annual, day average or instantaneous) to provide inputs to the power profile generator, in our case registered data are used.
ii. Power Profile Generator: The Power Profile Generator is the responsible for generating the possible power profiles (controlled-output power delivered by each generator) based on the forecasts provided and in the different points that the storage elements could be engaged including local control strategies and power electronics management (that includes battery aging, current and voltage control and so on, not detailed in this paper).
D. IT Management Module
The IT Management Module is the responsible for man-aging and monitoring the whole IT platform which includes monitoring the resources usage, receiving tasks, communicat-ing with the power module and planncommunicat-ing the resources and tasks allocation respecting a given power envelope.
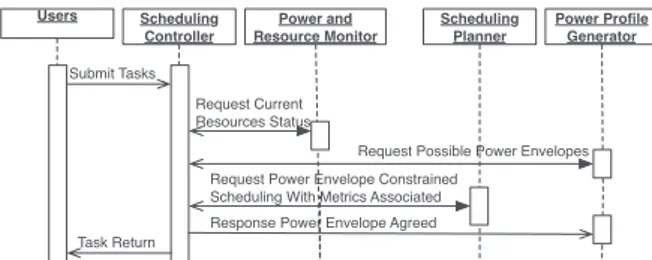
i. Overall interactions: This module contains three com-ponents: (1) resource and power monitor; (2) scheduling planner; and (3) scheduling controller. The interaction between these components is represented in Figure 2.
In this diagram we have the scheduling planner, which can be triggered by the scheduling controller when a new task arrives or in a special case if some unexpected change in the power curve occurs. This planner decides which task will be executed on which resource, when and at which frequency
Power and Resource Monitor Scheduling Controller Scheduling Planner Users Request Current Resources Status Power Profile Generator
Request Possible Power Envelopes Request Power Envelope Constrained
Scheduling With Metrics Associated Response Power Envelope Agreed Task Return
Submit Tasks
Fig. 2. Example of a possible interaction between the components of the IT Management Module, users and power part.
(DVFS choice), and also when each node will be turned on or off (cancelling idle power). This component ensures that the placement will respect the agreed power envelope, while minimizing the number of tasks that will be violated (finishing after the due date).
Finally we have the scheduling controller, responsible for distributing/managing all the information inside the IT Management Module, as well as receiving the new tasks to be scheduled and the power envelopes from the Power Management Module. Whenever a new task arrives or the power curve changes this component is the one responsible for requesting a new scheduling for the scheduling planner, based on the current state of the resources provided by the monitor and the available power envelopes. The details of the main components are presented bellow.
ii. Scheduling Planner: For the scheduling optimization problem several methods are described in the literature. These methods can be categorized in two main sets. The first one contains “exact methods” which can provide an optimal solu-tion. The second group are the “approached methods” which are able to approximate the best solution. Due to the large searching space, as the number of resources and tasks increase, exact methods are not feasible in our case.
In this way, we focus on the second group of approached methods. More specifically, we explore Greedy Heuristics (GH) and meta-heuristics such as Genetic Algorithms (GA) as a way to validate our proposal. GH can provide locally optimal decisions, and in general have a short execution time. On the other hand, the combinations of choices locally optimal do not always lead to an overall optimum. The GA approach, can provide a large number of adapted solutions and also makes possible to approach a local minimum starting from an existing solution. Nevertheless, the problem of GA methods can be the execution time on large scale problems. A pseudo-code of the GA is presented in Algorithm 1. In this work we propose a time window approach (all tasks are scheduled inside a time interval). More specifically, we consider the resource allocation problem as a set of tasks with different release times that are addressed in an offline way, but it could also be seen as an online algorithm with time windows and annual load prediction (in case of a bigger time window).
The difference from regular scheduling algorithms is that in this case we need to consider the power envelope agreement as constraint. To do so the algorithms implemented use a ”verify-power-envelope” function which is responsible for evaluating if a task can be scheduled in a given processing element on the desired time interval. The power envelope verification uses another function that returns how much power would
be consumed to schedule the task using a specific processor and frequency. This function also takes in consideration if some node was already in use to consider or not its idle power. We present here two different approaches that provide scheduling possibilities, but this model is not limited to it and new approaches could be used as long as they rely on the power envelope verification function.
For the GH we considered two versions of the Best Fit algorithm that tries to fit the tasks in the node that presents the smallest power consumption and that can finish the execution before the due date (while respecting the power envelope). One of the versions sorts the tasks by closest due date and the other one by the time in which the tasks are released. Even though the changes occur only in the task ordering, the impact on the results can be significant.
Regarding the GA, each chromosomes represent a tasks scheduling possibility for the given power profile. To improve the execution time (as seen in Algorithm 1 the verification occurs for each step in the power envelope), we also use two different power envelopes, the first one provides a rough scheduling based on an aggregation of the initially provided envelope, reducing in this case the number of “steps” to im-prove the execution time. After obtaining an initial placement we use a fine grained power envelope (smaller steps) to profit from power peaks and respect the given power envelope. We also consider in this case the use of DVFS in order to reduce the power usage without impacting the number of violations.
Algorithm 1: Pseudo-code of the GA scheduling algo-rithm.
input : task information, resources available, power envelope. output: scheduled tasks.
1 begin
2 get resources status();
3 get tasks status();
4 generate initial population();
5 for (i=0; i < generations; i++) do 6 crossover();
7 mutation();
8 select execution time(); 9 adjust DVFS(); 10 verify power envelope(); 11 calculate fitness();
12 end
13 end
The scheduling planner is not only responsible for deciding when and where each task will be executed, but also how to manage the IT resources (IT load control). In this sense, at the end of the task placement algorithm we also calculate when each node can be turned off in order to reduce the power consumption without impacting the system performance. This scheduling also results in a time series describing how much power will be consumed by the IT resources.
iii. Scheduling Controller: The scheduling controller is one of the main components in the IT Management Module. It is responsible for collecting the resource status from the monitor, receiving and responding the power envelope with the Power Management Module, forwarding the necessary information to the scheduling planner, and after that communicating with the datacenter to perform all the planned actions (schedule task, turn off node, etc).
All the operations performed by the scheduling controller occurs through the datacenter frontend. The communication is established through messages exchange. These messages are interpreted by the frontend and can either concern the tasks or the IT infrastructure. Tasks can be scheduled in a given host, migrated or deallocated and these actions can be
performed through the cloud middleware API ( OpenStack’s2
API for instance). For the hosts operation we can either rely on shutdown and Wake-on-Lan like commands or ePDUs that can be controlled remotely which allows both to control and monitor the power consumption.
E. Prototype
To validate RECO we implemented a prototype containing a simplified version of each module in order to control a simulated IT infrastructure provided by DCWoRMS [10]. DCWoRMS is a simulator developed in Poznan Supercom-puting and Networking Center (PSNC). It aims to evaluate allocation and scheduling policies for a given workload on a given infrastructure. This simulator is developed in Java with different plugins which aim to implement the models used to simulate the infrastructure. To simulate the scheduling planner we implemented the scheduling algorithms previously mentioned inside DCWoRMS as a scheduling plugin. When a task arrive in the simulator the scheduling plugin is triggered. For the Power Management Plugin we developed a power profile generator. This generator uses forecasting data collected
during 6 days from wind3in the city of Toulouse-France. This
data was then extrapolated to match the peak power production to the datacenter maximum power consumption and read by the simulator. More details about the size and power productions are presented in Section 4.
The interaction in the prototype starts when the simulator receives the new bag of tasks. Then, the IT Module gets the available power envelopes that were generated by the power management plugin. This power envelopes are used by the scheduling planner which output the scheduling plan, the number of due date violations associated, and the expected power consumption of each plan. The profile with the smallest number of due date violations can then be selected and the actions start being executed inside the simulator to schedule tasks, adjust frequency, and turn on/off the computing nodes.
4. Evaluation Methodology and Results
To validate RECO we simulated an IT workload and Power production infrastructure based on the prototype presented in the previous section. The DCWoRMS simulator and the other modules are executed on the same machine, with an Intel Core I5 4278U processor and 8GB of DDR3 RAM.
The IT infrastructure inside the simulator is based on Ville-bonnet et al. [11] using 15 homogeneous nodes and the power
consumption values of Paravance cluster from Grid50004. The
power consumption of the nodes is based on the power model
presented using Pf 9.45W and Pf ix of 69.9W. For Pon we
2https://www.openstack.org/ 3http://www.meteociel.fr/ 4https://www.grid5000.fr/
consider 112.91W over Tonof 189s and for Pof f 65.7W over
Tof f of 10s.
Regarding the GA, the parameters used are 100 generations with the simplified power envelope, 400 generations with the original power envelope, a population size of 50 individuals and crossover and mutation probabilities of 0.9 and 0.3 respec-tively.
To generate the batch tasks we used a Google based workload generator [12], considering a window of 2 days (i.e. all the tasks have to be executed inside this interval) to generate 3 different workloads with 234, 569 and 1029 tasks. Each workload is scheduled with 3 different power profiles (power available in Figure 4). These different power profiles will allow us to evaluate what is the impact of the power profile in the QoS of a cloud based datacenter when executing different workloads.
A. Results
In Figure 3 we present the execution time and the number of due date violations for all the workloads and algorithms proposed. In this charts (a), (b) and (c) we present the number of due date violations for each one of the workloads and finally
in (d) the execution time, in milliseconds, of the algorithms.234 Tasks 569 Tasks 1029 Tasks
Best Fit Duedate Best Fit Arrival Genetic Algorithm
0 30 60 90 120 150
234 Tasks 569 Tasks 1029 Tasks
Duedate V
iolations
(a) Due date of Profile i
0 30 60 90 120 150
234 Tasks 569 Tasks 1029 Tasks
Duedate V
iolations
(b) Due date of Profile ii
0 30 60 90 120 150
234 Tasks 569 Tasks 1029 Tasks
Duedate VIolations
(c) Due date of Profile iii
313 1215 1902 157 293 578 38688 107103 197271 1 10 100 1000 10000 100000
234 Tasks 569 Tasks 1029 Tasks
T
ime (ms)
(d) Exec. time (ms) of algorithms Fig. 3. Execution time and due date violations of the different algorithms with different tasks and power power envelopes (profiles).
With Profile i, 234 and 569 tasks GA have an energy consumption up to 13.7% smaller when compared with Best Fit, and 0 due date violations. With 1029 tasks in this same power profile the GA energy consumption can be 1.7% higher than Best Fit Arrival, but with a reduction of 51% in the number of due date violations. With Profile ii, 234 and 569 tasks GA have an energy consumption up to 13.8% smaller when compared with Best Fit, and 0 due date violations. With 1029 tasks the GA energy consumption can be 1.9% higher than Best Fit Arrival, but with a reduction of 67% in the number of due date violations. Finally with Profile iii, 234 and 569 tasks GA have an energy consumption up to 12.7% smaller when compared with Best Fit, and with 1029 tasks the GA energy consumption can be 1.8% higher than Best Fit Arrival, but with a reduction of 73% in the number of due date violations.
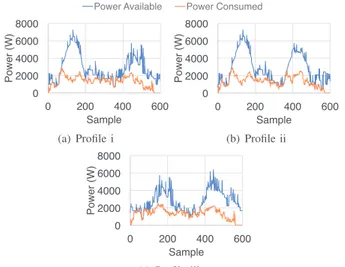
In Figure 4 we present the energy produced and expected consumption for each one of the three power profiles. These results were obtained when using the GA scheduling and 1029 tasks. We can observe that for scheduling batch tasks with fixed release and due date times, when the power is available is more important than how much power is produced. We can see this behavior in Profile i that has the same production in the first half, but less energy in the second half of the envelope, but still have less due date violations than Profile ii, which produced more power in the second half of the envelope. Also, Profile iii for instance have less energy consumed, and less due date violations than Profile ii. This occurs because at some points we have too many tasks to be scheduled, and they might lack flexibility (time between release and due date) to wait the next moment where enough power will be available. This highlights the importance of the generation of multiple power envelopes when considering renewable energy sources and storage elements engagement. We could not only save energy but also provide a better QoS. This excess of power available could either be sold (back to the grid) or stored in form of hydrogen (electrolyzer element).
Power Available Power Consumed
0 2000 4000 6000 8000 0 200 400 600 Power (W) Sample (a) Profile i 0 2000 4000 6000 8000 0 200 400 600 Power (W) Sample (b) Profile ii 0 2000 4000 6000 8000 0 200 400 600 Power (W) Sample (c) Profile iii
Fig. 4. Power available and consumed in the power profiles using genetic algorithm based scheduling plan.
5. Conclusion
This article focused on presenting and evaluating an op-timization module named RECO that aims to integrate both IT-load power model and Power production to schedule tasks in a cloud datacenter while respecting the possible power envelopes. We presented different algorithms that aim to minimize due date violations while respecting power and resource constraints. Our genetic algorithm approach was able to reduces up to 73% of due date violations while increasing only 1.8% the energy consumption respecting one of the power profiles provided by the power manager. We also presented an evaluation of the impact that the power envelopes can have in the task scheduling, and that more power do not necessarily means better QoS for the IT part, but it is better to optimally decide when this power is delivered. The outputs of the IT optimization could provide interesting load profiles to a power management module.
Finally, we intend to continue our research extending RECO to support real time task arrival, services (not only
batch tasks), and variations in the amount of resources that are consumed by the applications.
Acknowledgments
The work presented in this paper was supported by the French ANR DATAZERO project ANR-15-CE25-0012. For source characterization, the experimental database has been obtained thanks to the financial support of several LAPLACE projects, France (leaders Christophe TURPIN, Eric BRU) References
[1] K. Le, O. Bilgir, R. Bianchini, M. Martonosi, and T. D. Nguyen, “Managing the cost, energy consumption, and carbon footprint of internet services,” SIGMETRICS Perform. Eval. Rev., vol. 38, no. 1, pp. 357–358, Jun. 2010. [Online]. Available: http://doi.acm.org/10.1145/1811099.1811085
[2] J. Koomey, “Growth in data center electricity use 2005 to 2010,” A report by Analytical Press, completed at the request of The New York Times, p. 9, 2011.
[3] I. Goiri, R. Beauchea, K. Le, T. D. Nguyen, M. E. Haque, J. Guitart, J. Torres, and R. Bianchini, “Greenslot: Scheduling energy consumption in green datacenters,” in 2011 International Conference for High Performance Computing, Networking, Storage and Analysis (SC), Nov 2011, pp. 1–11.
[4] N. Beldiceanu, B. D. Feris, P. Gravey, S. Hasan, C. Jard, T. Ledoux, Y. Li, D. Lime, G. Madi-Wamba, J.-M. Menaud, P. Morel, M. Morvan, M.-L. Moulinard, A.-C. Orgerie, J.-L. Pazat, O. Roux, and A. Sharaiha, “Towards energy-proportional clouds partially powered by renewable energy,” Computing, vol. 99, no. 1, pp. 3–22, 2017. [Online]. Available: http://dx.doi.org/10.1007/s00607-016-0503-z
[5] D. Borgetto and P. Stolf, “An energy efficient approach to virtual machines management in cloud computing,” in 2014 IEEE 3rd Inter-national Conference on Cloud Networking (CloudNet), Oct 2014, pp. 229–235.
[6] A. Beloglazov, J. Abawajy, and R. Buyya, “Energy-aware resource allocation heuristics for efficient management of data centers for cloud computing,” Future Generation Computer Systems, vol. 28, no. 5, pp. 755 – 768, 2012, special Section: Energy efficiency in large-scale distributed systems. [Online]. Available: http://www.sciencedirect.com/science/article/pii/S0167739X11000689 [7] C.-M. Wu, R.-S. Chang, and H.-Y. Chan, “A green
energy-efficient scheduling algorithm using the dvfs technique for cloud datacenters,” Future Generation Computer Systems, vol. 37, pp. 141 – 147, 2014. [Online]. Available: http://www.sciencedirect.com/science/article/pii/S0167739X13001234 [8] T. Mudge, “Power: A first-class architectural design constraint,”
Com-puter, vol. 34, pp. 52–58, 2001.
[9] B. Espinar, J.-L. Aznarte, R. Girard, A. M. Moussa, and G. Kariniotakis, “Photovoltaic Forecasting: A state of the art,” in 5th European PV-Hybrid and Mini-Grid Conference. Tarragona, Spain: OTTI - Ostbayerisches Technologie-Transfer-Institut, Apr. 2010, pp. Pages 250–255 – ISBN 978–3–941 785–15–1. [Online]. Available: https://hal-mines-paristech.archives-ouvertes.fr/hal-00771465
[10] K. Kurowski, A. Oleksiak, W. Pitek, T. Piontek, A. Przybyszewski, and J. Wglarz, “Dcworms a tool for simulation of energy efficiency in distributed computing infrastructures,” Simulation Modelling Practice and Theory, vol. 39, pp. 135 – 151, 2013, s.I.Energy efficiency in grids and clouds. [Online]. Available: http://www.sciencedirect.com/science/article/pii/S1569190X1300124X [11] V. Villebonnet, G. D. Costa, L. Lefevre, J. M. Pierson, and P. Stolf,
“Energy aware dynamic provisioning for heterogeneous data centers,” in 2016 28th International Symposium on Computer Architecture and High Performance Computing (SBAC-PAD), Oct 2016, pp. 206–213. [12] G. D. Costa, L. Grange, and I. D. Courchelle, “Modeling and generating
large-scale google-like workload,” in 2016 Seventh International Green and Sustainable Computing Conference (IGSC), Nov 2016, pp. 1–7.