Int. J. Electrochem. Sci., 13 (2018) 1683 – 1699, doi: 10.20964/2018.02.35
International Journal of
ELECTROCHEMICAL
SCIENCE
www.electrochemsci.org
Bentonite Modified Carbon Paste Electrode as a Selective
Electrochemical Sensor for the Detection of Cadmium and Lead
in Aqueous Solution
Ali Ourari1,*, Farid Tennah1,2, Ramiro Ruíz-Rosas2, Djouhra Aggoun,1,*, Emilia Morallón2
1 Laboratoire d’Electrochimie, d’Ingénierie Moléculaire et de Catalyse Redox (LEIMCR), Faculté de
Technologie, Université Setif-1, Setif 19000, Algeria.
2
Instituto Universitario de Materiales, Universidad de Alicante, Ap. 99. E-03080 Alicante, Spain.
*
E-mail: [email protected] (A. Ourari); [email protected] (Dj. Aggoun)
Received: 25 October 2017 / Accepted: 12 December 2017 / Published: 28 December 2017
This work describes the use of a carbon paste electrode (CPE) modified with a Bentonite clay (Maghnite) as an electrochemical non-pollutant, selective and low cost sensor for Cadmium and Lead detection in aqueous solution. The physico-chemical properties of the clay mineral were analysed by X-Ray Fluorescence analysis (XRF), Powder X-ray diffraction (XRD), Thermogravimetric analysis (TG) and N2 adsorption isotherm. The square wave anodic stripping voltammetry (SWASV) has been
used in which the different electrochemical parameters have been studied. The optimal preconcentration pH and Maghnite-CPE content were found to be 3.4 and 14% w/w respectively. Under these optimized conditions and at a preconcentration time of 5 min, the response of the electrode was linear with analytes concentration in the ranges from 1 to 30 µmol/L for Cadmium and 0.1 to 30 µmol/L for Lead with limit of detection (LOD) values of 0.16 µmol/L and 0.30 µmol/L for Cadmium and Lead respectively.
Keywords: Bentonite (Maghnite), Carbon paste electrode (CPE), Anodic stripping voltammetry (ASV), Square wave voltammetry (SWV), Electrochemical sensor, Cadmium and Lead.
1. INTRODUCTION
Heavy metals are released into the environment mainly by industrial activities. They are known to be a general metabolic poison and enzyme inhibitor. Many of these metals (e.g., Hg(II), Cu(II), Cd(II), Pb(II), Cr(VI)) are carcinogens and are implicated in numerous diseases including Parkinson’s disease, Alzheimer’s disease, multiple sclerosis, developmental disorders and failure of numerous organs even when found at the trace level [1, 2].
Several known techniques mainly based on spectroscopic principle such as atomic absorption spectroscopy (AAS), atomic emission spectroscopy (AES) and inductively coupled plasma mass spectrometry (ICP-MS) have been successfully exploited for heavy metal determination. However, these methods are not suitable for in field application due to the complex sample pretreatment, time consuming procedures, requirement of specialized personnel and complex instruments [3].
The increasing need for heavy metals in applications such as plating, mining, solar cells, pharmaceutical and chemical industries aggravate their impact in environmental pollution factors and increases the necessity for novel analytical tools for their detection and quantification. The guidelines values for drinking water prescripted by the WHO (World Health Organization) for Lead, Cadmium and Mercury are 10, 3 and 6 µg/L respectively [4].
Electrochemical methods provide interesting alternatives as high sensitivity, selectivity toward electroactive species, wide linear range, portable and low-cost instrumentation [5]. Stripping analysis is particularly useful for the analysis of very dilute solutions. It is most frequently used for the determination of metal ions by cathodic deposition, followed by anodic stripping and, therefore, is called anodic stripping voltammetry (ASV). The sensitivity of ASV is attributed to its preconcentration-electrolysis step, in which traces metals are accumulated/reduced on the working electrode surface, followed by the measurement step where the metals are stripped/oxidized away from the electrode during an appropriate potential scan. In particular, Mercury (Hg) working electrodes have shown high sensitivity in measuring heavy metal ions concentration using ASV with polarographic technics [6]. However, Mercury is known to be highly toxic and strict national regulations and international treaties (such as the Minamata Convention on Mercury on 2013) have been signed for reducing their emission and concentration levels in the environment [7].
Carbon paste electrodes (CPEs) were introduced by Adams in 1958 [8] and the modification of the CPEs began in 1964, with the fundamental studies of Kuwana and co-workers. CPEs are promising electrodes that profit of low background current, easy fabrication and long-time stability and they are well known for their high compatibility with other adsorbents that brings the possibility to develop conductive composite mixtures for heavy metal ions sensing [9, 10].
Clay materials can play an important role as parent host structure for inorganic and organic compounds owing to their intrinsic properties such as chemical and thermal stability, ion exchange and the presence on their interlayer surfaces of hydroxyl group active sites [11, 12]. In this sense, clay is one of the adsorbents that can be mixed within carbon paste electrodes. Clay modified electrodes (CMEs) were first described by Gosh and Bard [13]. CMEs are particularly used in the preconcentration method applied to the detection of cationic species (i.e., metal cations) or organic molecules (i.e., water pollutants and drugs). Several applications as electrocatalytic sensors involving intercalated redox mediators in the electrochemical detection process, amperometric and potentiometric biosensors have been also reported [14].
Bentonite is a natural and predominantly montmorillonite clay with a high surface area, specific active sites and attractive adsorptive properties [15]. The aim of this work was to develop a CPE modified with an Algerian bentonite (Maghnite) [16] to achieve a low cost electrochemical sensor for Cadmium and Lead detection in aqueous solution using the square wave ASV method, where the analyte is first accumulated-preconcentrated at open circuit potential by ion exchange in the clay layers
then reduced at appropriate low potential and measured when oxidized stripped by square wave anodic potential scan after medium exchange.
2. EXPERIMENTAL 2.1. Materials and reagents
The raw clay used in this work is an Algerian bentonite called Maghnite from the west of Algeria. Its cation exchange capacity (CEC) is 0.90 meq/g [17]. Graphite (KS6) was provided from TIMREX.
All reagents used are of analytical grade. Nujol (mineral oil) was purchased from Sigma-Aldrich, while HClO4 and Cd(NO3)2.4H2O were provided by Prolabo, Pb(NO3)2 and NaClO4.H2O by
Merck and Dichloromethane from Applichem. Standards solutions of the analytes were prepared by successive dilution of 1 milli Molar stock solutions using ultra-pure water 18.2 MOhm.cm (25 ºC). All reagents were used as received.
2.2. Purification of clay mineral
The raw Maghnite was crushed, ground and sieved through a 100 micrometer sieve and converted to its sodic form [18] at micrometric dimensions using a protocol of 2 steps [19, 20]:
i. 5 g of the sieved raw Maghnite were continuously stirred in a beaker containing 200 mL of 1 mol/L NaCl for 8 hours. The clay suspension was centrifugated at 4000 rpm for 20 minutes, the supernatant discarded. This process was repeated to ensure the complete conversion of the Maghnite to its homoionic form. The sodic Maghnite obtained (Na-Maghnite) was then washed several times with distilled water, until a chloride test with AgNO3 was negative and then recovered by centrifugation.
ii. The homoionic Maghnite (Na-Maghnite) obtained was stirred in a beaker containing 200 mL of distilled water and the suspension was allowed settling in a sedimentation tube (50 cm length). After 5 hours, the liquid at mid-height of the tube containing the fine fraction of the Maghnite, was siphoned and recovered by centrifugation. This process was repeated three times until a clear liquid was obtained at the top of the tube.
2.3. Physicochemical characterization technics
The elemental compositions of raw and modified clays were determined using X-Ray Fluorescence analysis (XRF). XRF measurements were obtained using an automatic sequential wavelength dispersive X-ray fluorescence spectrometer PW 2400 (Philips). Around 100 mg of sample were employed in order to deliver representative results. Thermogravimetric analyses (TG) were recorded using a Mettler Toledo apparatus, model TGA/SDTA851e/SF/1100. 10 mg of samples were heated up from room temperature to 900 ºC at 10 ºC/min under synthetic air (N2:O2 (4:1)).
Powder X-ray diffraction patterns were recorded in a Ruker D8-Advance apparatus using CuKalpha radiation (λ = 1.5406 Å) and 2θ values from 3 to 80 degrees at a step size of 0.05. Bragg’s law
nλ = 2 d sinθ was used to compute the d001 spacing of Maghnite. The textural parameters were
determined by nitrogen gas adsorption–desorption isotherms at 77 K using Quadra Sorb Station 4 with outgas time of 4.0 hours and outgas temperature of 250 ºC. The specific surface area was evaluated by the multipoint-BET method (SBET). The micropore volume was evaluated by Dubinin-Radushkevich (DR) method. Mesopore volume (V-m) was evaluated as the difference between the micropore volume and the liquid volume of adsorbed nitrogen at P/Po = 0.95 (density ratios between gas and liquid phases of 0.00154 were employed for this calculus). The total pore volume was evaluated at P/Po = 0.99. The external surface area (i.e. surface area of mesopores and macropores) were evaluated by the alfa-s (A-s) method, using the isotherm of an Elftec-120 non porous carbon black (surface area: 2.71 m2/g) as the reference. The pore size distribution has been calculated from the N2 adsorption isotherms
using the 2D-NLDFT heterogeneous surface model described elsewhere as applied by the Solution of Adsorption Integral Equation Using Splines (SAIEUS, available online at http://www.nldft.com/) Software. The micropore width was determined as the pore width value corresponding to the maximum of the pore size distribution function in the pore width range below 2 nm (Figures S1 and S2).
2.4. Working electrode preparation and electrochemical equipment
Carbon paste electrodes (CPE) were obtained by mixing a graphite powder (KS6), the clay material (Maghnite) and a binder (Nujol) in a 2 steps procedure [21, 22]:
In the first step, 1 g of solid particles of graphite powder and Na-Maghnite in the desired ratio was suspended in 10 mL of Dichloromethane CH2Cl2, sonicated for 10 minutes to ensure
a good dispersion, stirred for one hour to ensure a homogenous mixture and heated under stirring until complete evaporation of the solvent.
In the second step, 0.3 g of an organic binder (Nujol) was added to 0.7 g of the mixture obtained and mixed in a mortar with a pestle for 15 minutes until the entire mixture appeared uniformly wetted.
The resulting past was then packed into the end of a homemade Teflon cylindrical tube of 3 mm -id- equipped with a stainless less steel screw pushing the paste and acting as electrical contact. The surface was smoothed off by rubbing the electrode several times slowly across a weighing paper. When needed, a new surface was obtained by pushing (typically 250-500 micrometer) paste out of the tube, carefully removing the excess and smoothing the surface again. Unmodified carbon paste was prepared in the same way without adding Maghnite. This electrode was used as working electrode in a three electrode cell configuration comprising a Platinum wire counter electrode and Ag/AgCl reference electrode. SWASV were recorded using a Biologic (SP300) potentiostat coupled with a computer equipped with the EC-Lab software. The SWASV method used has two steps, the preconcentration step and the detection step [23]:
In the preconcentration step, the working electrode (WE) is placed at open circuit potential (OCP) in a beaker containing 20 mL of a diluted solution of the cation for a given time under constant stirring to ensure an accumulation of the ion into the Maghnite, then removed, rinsed with water and transferred to the electrochemical cell for the detection step.
In the detection step, the WE is submitted to a low potential for a given time to ensure the reduction of accumulated ions then a potential scan in the square wave mode was performed from the electrolysis potential to a higher potential to ensure the oxidation of the reduced ions while the current (charge) is recorded. The stripping peak currents were used to quantify the metals after baseline correction. The following settings were used for the SWASV: pulse height: 50 mV, pulse width: 20 ms, step height: 1 mV and scan rate: 25 mV/s. The measurements were repeated three times and all voltammograms were recorded at room temperature.
3. RESULTS AND DISCUSSION 3.1. Physico-chemical characterization 3.1.1. X-Ray Fluorescence analysis (XRF)
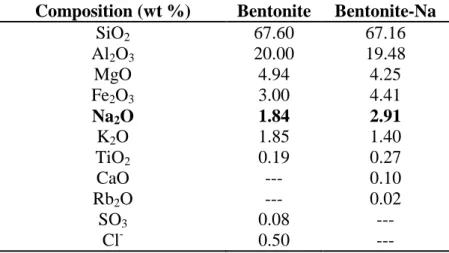
The elemental composition of bentonite has been determined using XRF (Table 1). These results showed that the main composing elements are O, Si and Al, hence confirming that the material used in this study is an aluminosilicate. Mg, Fe, K and Na are present in lower amounts and can be accounted as exchangeable cations within the bentonite structure.
Table 1. XRF elemental composition (wt %) of bentonite and bentonite-Na. Composition (wt %) Bentonite Bentonite-Na
SiO2 67.60 67.16 Al2O3 20.00 19.48 MgO 4.94 4.25 Fe2O3 3.00 4.41 Na2O 1.84 2.91 K2O 1.85 1.40 TiO2 0.19 0.27 CaO --- 0.10 Rb2O --- 0.02 SO3 0.08 --- Cl- 0.50 ---
A high cation exchange capacity is a well-known feature of these materials, and therefore, these last elements can be exchanged by others in order to tailor the bentonite composition for the intended application. In this sense, a Na-loading protocol has been implemented using sodium chloride as the cation source (see experimental section for further details). After such treatment, the amount of
sodium increased from 1.84 to 2.91%, whereas potassium and magnesium amounts along with some alumina content were consequently removed, pointing out that Na-bentonite has been successfully exchanged with cations of sodium. The amount of Na loaded in bentonite is somewhat less than the one reported by [24] for montmorillonite where a sodium content increasing from 1.35 to 3.26% was achieved. The sodium content value (2.91%) exhibited by bentonite-Na shown in Table 1 was similar to those previously reported in the literature [25-27] where a sodium content between 2.6 and 2.7% was found by these three researchers after sodium treatment of the Algerian bentonite clay.
3.1.2. Powder X-ray diffraction (XRD)
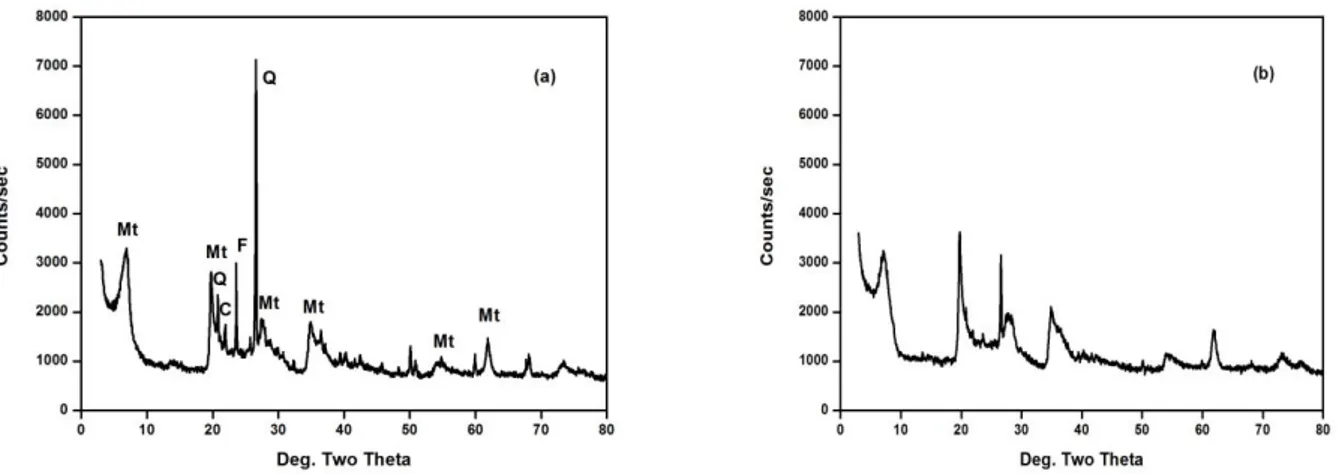
The XRD patterns of raw bentonite (a) and bentonite-Na (b) are shown in Fig. 1. The raw bentonite exhibits the characteristic diffraction peaks attributed to the montmorillonite (Mt), which seems to be the main component of the sample. Impurities like Feldspar (F), Cristobalite (C) and Quartz (Q) have been also observed in the spectra as previously reported for similar materials [28-30]. For raw bentonite, the position of the diffraction peak at 2theta equals to 6.87 degrees corresponding to a d001 spacing of 12.86 Å. This value is somehow lower than the theoretically expected for this kind of
materials. The slight decrease in the interlayer space indicates that some molecules were adsorbed on top of the layers, with this value being usually seen when a single water layer between the bentonite sheets is found [31].
Figure 1. XRD patterns of raw bentonite (a) and bentonite-Na (b).
Sodic bentonite exhibits similar characteristic peaks to those of raw form. Again, the montmorillonite diffraction pattern is the largest contributor to the XRD profile. It is also possible to notice that the XRD peaks attributed to the presence of certain impurities, such as Quartz and feldspar, has noticeably decreased pointing out that the amount of impurities is decreased after the sodium-exchange treatment. The bentonite-Na exhibits a slightly lower d001 spacing (12.41 Å) at 2theta = 7.12
Å. This d001 spacing is similar to those previously reported for bentonite materials similarly
intercalated with sodium [25-27] where the basal spacing (d001) found was 11.98, 12.50, and 12.66 Å
loss of interlayer water molecules upon the replacement of exchangeable cations as those of sodium (Na+). Of such decrease of the d001 spacing in the montmorillonite was already reported by other
researchers. As a possible explanation for this feature is that the decrease in the basal d001 spacing may
be imputable to the removing of interlayer water molecules as previously argued by researchers who have reported a similar decrease in the d001 spacing for the sodic montmorillonite before and after its
acid treatment [32].
3.1.3. Thermogravimetric analysis (TG/DTG)
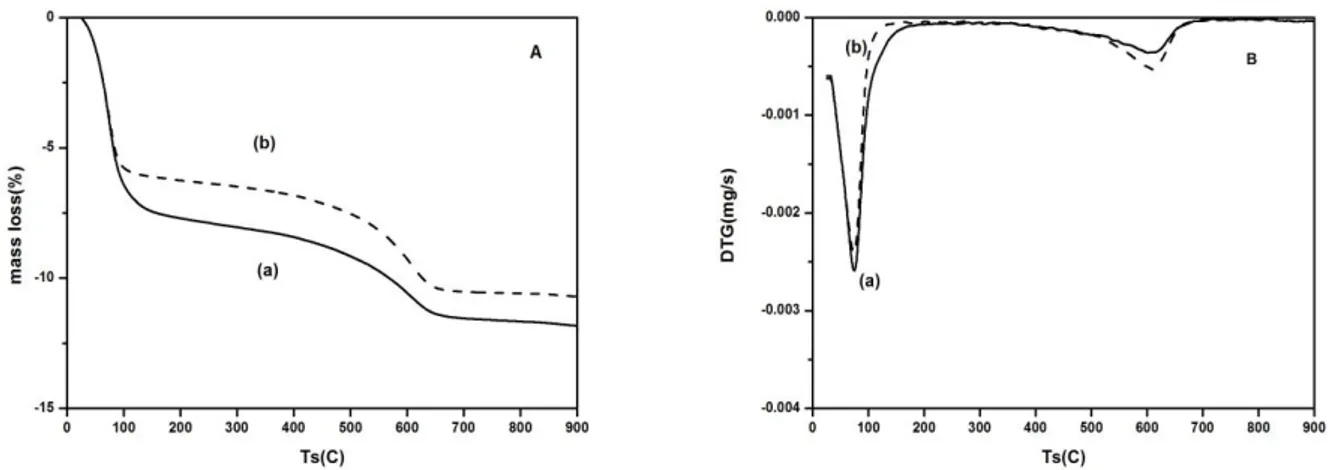
The TG and DTG curves are shown in Fig. 2. The TG curves of raw bentonite and Na-bentonite show the typical features for montmorillonite, that is, two main endothermal weight loss process. The first weight loss, below 200 ºC, (6%) for Na-bentonite and (7.5%) for raw bentonite respectively is a result of the release of adsorbed water. The second weight loss, below 700 ºC, (4.5%) for Na-bentonite and (4%) for raw bentonite respectively is associated with the dehydroxylation of the octahedral sheet in the silicate structure as previously reported from evolved gasses in thermogravimetric analysis coupled to mass spectrometry (TG-MS) by [33, 34]. Since the sodium-exchange treatment is able to remove part of the impurities previously found on raw bentonite, the higher contribution of dehydroxylation reactions on Na-bentonite probably points out that some sites of the silicate structure has been released and hydroxylated after the removal of such impurities, bringing available more hydroxyl groups that can be desorbed at 700 ºC. The total weight loss up to 900 ºC is only (10.5%) for Na-bentonite and (11.5%) for raw bentonite, confirming the high thermal stability of bentonite.
Figure 2. TG (A) and DTG (B) curves of raw bentonite (a) and bentonite-Na (b) in air at 10 ºC/min. 3.1.4. Textural properties of clays
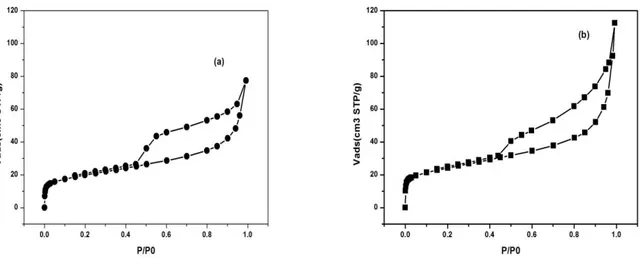
The N2-adsorption/desorption isotherms of raw bentonite (a) and Na-bentonite (b) are shown in
Fig. 3. The raw and Na-bentonite exhibit typical type IV isotherm in the IUPAC classification [35] with the presence of a noticeable desorption hysteresis loop. The hysteresis loops are of type H4, often
observed with microporous adsorbents with bottleneck pore configuration. Both findings confirm that these solids are mesoporous material, with a limited contribution of microporosity. As for the hysteresis loop, capillary condensation occurs during adsorption via cylindrical meniscus, while capillary evaporation during desorption occurs via hemispherical meniscus, separating the vapour and capillary-condensed phases. This results in the formation of hysteresis loops, and confirms the mesoporous structure of bentonite [36, 37].
Similarly, the presence of both micropores (pores with sizes under 2 nm) and mesopores (pores with sizes between 2 and 50 nm) in raw bentonite can be deduced by the large nitrogen uptake at low relative pressures (where micropore filling takes place) and the continuous nitrogen adsorption seen when relative pressure is increased (This is indicative of mesopore presence or of a large external surface area on non-porous adsorbents). The knee of the adsorption isotherm at low pressures is also rather rounded, pointing out the presence of wide micropores. Therefore, it is expected that the sample has a wide pore size distribution and different pore shapes. Interestingly, the N2 adsorption capacity of
bentonite increased after sodium treatment. The porosity is probably increased due to the washing of inorganic species.
Figure 3. N2-adsorption/desorption isotherms of raw bentonite (a) and Na-bentonite (b).
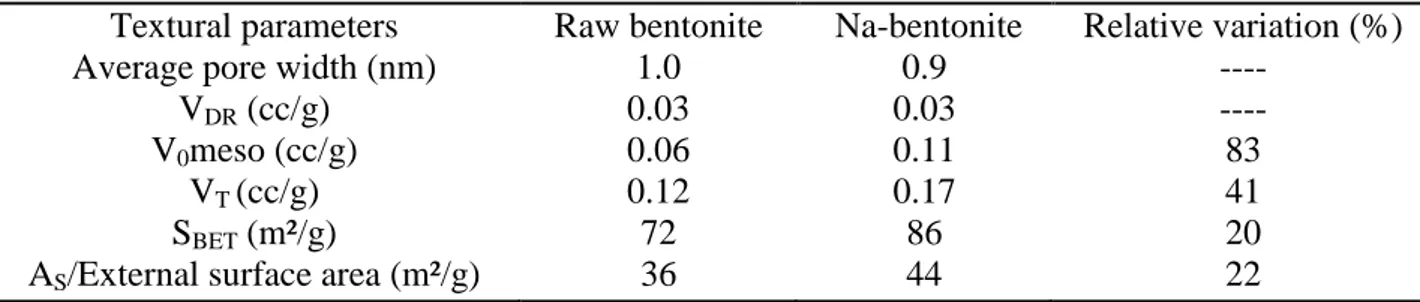
The released species could be feldspar and quartz (as previously seen in XRD analyses, Figure 1), but given that most of the enhanced nitrogen uptake is found at very low relative pressures (i.e. micropores are increased), this phenomenon should arise as a consequence of the release of small nanosized crystals or due to the substitution of large cations with the smaller Na cations. Table 2 complies the textural parameters derived from the N2 adsorption isotherms for the raw and
Na-bentonite. So, the Na-bentonite exhibits a more developed porosity than the raw bentonite: surface area, total pores volume and external surface area (AS) increased from 72 m2/g and 0.12 cm3/g and 36
m2/g to 86 m2/g and 0.17 cm3/g and 44 m2/g respectively. Micropore volume (VDR) and micropore
width are not affected and shows the same value of 0.03 cm3/g and 1.0 nm, respectively. The micropore width was estimated as the pore width corresponding to the maximum value of the pore size distribution function (in the pore width range below 2 nm).
Table 2. Textural parameters values for raw bentonite and Na-bentonite. Textural parameters
Average pore width (nm) VDR (cc/g)
V0meso (cc/g)
VT (cc/g)
SBET (m²/g)
AS/External surface area (m²/g)
Raw bentonite 1.0 0.03 0.06 0.12 72 36 Na-bentonite 0.9 0.03 0.11 0.17 86 44 Relative variation (%) ---- ---- 83 41 20 22 3.2. Electrochemical study
3.2.1. The voltammetric response of Cd2+ at bare and bentonite modified CPE
Fig. 4 displays the SWASV of 10-5 mol L–1 Cd2+ at a bare CPE (curve a) and at modified CPE with 10% Na-bentonite (curve b). As shown in Fig. 4, no stripping peak was obtained from 10-5 mol L–
1
Cd2+ at the bare CPE following 5 min preconcentration at open circuit conditions under stirring in 0.001 M HClO4 and detection with initial potential at –1.0 V for 60 s in 0.1 M HClO4. Whereas under
the same conditions an obvious anodic stripping peak at - 0.65 V was obtained at the bentonite 10%-modified CPE corresponding to oxidation of deposited Cd metal. The significant increase in peak current is undoubtedly attributed to the strong cation-exchange capacity and adsorptive ability of bentonite for Cadmium cations.
Figure 4. SWASV obtained from 10-5 mol L–1 Cd2+ at (a) a bare CPE and (b) an 10% bentonite modified CPE.
The results depicted in Fig. 4 were obtained at selected composition of the preconcentration and detection media. Indeed, Cd(II) ions accumulation on the Na-bentonite proceeds via cation exchange at selected pH value of 3.4 (HClO4 0.001 M). This value, being a good compromise to
ensure the presence of negative charges at the bentonite platelets, leads to the quantitative cation exchange capacity while the Cd(II) species were maintained in their positively-charged form. For the detection step, a lower pH value of 1.4 (HClO4 0.1M) was selected as being a good compromise to
ensure a maximum desorption of Cd(II) ions and to avoid chemical degradation of the aluminosilicate via the hydrolysis of aluminium centers in stronger acidic media, what could result in a decrease in the voltammetric response and significant loss of reproducibility [22, 23]. Since the detection required first the reduction of Cd(II) to Cd(0), it was important to impose a suitable reducing potential. The low initial potential of -1.0 V and the electrolysis time of 60 s were selected in order to ensure the complete reduction of the accumulated Cd(II) ions in the Na-bentonite. It is important to mention that during all the analytical procedure, ie the OCP preconcentration and the SWASV detection steps no de-oxygenation of any solution is needed. This simplifies the electrochemical procedure and decreases considerably the analysis time. After each detection step, the regeneration of the modified CPE electrode was achieved by exposing the electrode to 0.1 mol/L NaClO4 solution under constant stirring
for 5 min without any applied potential and at last rinsed with ultra-pure water. After this treatment, the electrode did not show residual currents due to the accumulated ion and was ready for a new preconcentration step.
3.2.2. pH preconcentration effect
The effect of pH on the response of Cadmium ions by the CPE was investigated. Fig. 5 shows the effect of preconcentration pH ranging from 1.4 to 7.6 upon the 10-5 mol L–1 Cd2+ charge of SWASV on 14% bentonite-CPE following the same experimental conditions than in Fig. 4. As shown in Fig. 5, the response (stripping peak charge) is remarkably influenced by the pH values in the studied range. The bentonite-CPE exhibits no adsorption property at low acidic solution (pH = 1.4) then the signal is increased with increasing pH preconcentration up to (3.4) and almost reaches a plateau value around 3.4 and became independent of pH at all other pH values (3.4-7.6) tested for Cadmium cations.
Figure 5. Effect of pH preconcentration step on the accumulation capacity.
Similar adsorption behaviour of heavy metal ions on different clays related to the pH effect was reported for Cadmium, Zinc and Nickel on natural and Na-exchanged bentonites [38], Cadmium on vermiculite [39], Chromium on bentonite [40], Lead on bentonite and zeolite [41] and for Lead on bentonite [42] indicating that such clays exhibit a point zero charge (pzc) in the initial pH range of 3 to
4. For pH value under pzc, the bentonite surface is positively charged while for pH value above pzc, the bentonite surface is negatively charged [43]. So, it is possible that hydroxyl functional groups (SOH) at the clay surface interact with water in an acidic medium forming some aqueous complexes as follows [41, 44]:
SO- + H3O+ SOH2+ + OH-
Or
SOH + H3O+ SOH2+ + H2O
This surface charge interacts repulsively with approaching metal ions and prevents them to reach this surface. So, it is possible also that lower adsorption of the metal ions at low pH is due to the presence of excess H+ ions competing with the Cd2+ species for the sorption sites [45]. When the initial pH is increased from 3.4 to 7.6, the bentonite surface becomes negatively charged favouring Cd(II) species adsorption [41, 44]:
SOH + OH- ↔ SO- + H2O
2 SO- + Cd2+ ↔ (SO-)2…Cd2+
Thus, in order to ensure negatively charged bentonite surface and avoiding metal precipitation that would appear if higher pH values are used, a solution of 0.001 M HClO4 (pH = 3.4) leading to an
optimum solubility and adsorption of Cadmium cations was selected as optimal pH for preconcentration step on bentonite-CPE in further studies.
3.2.3. Content clay effect
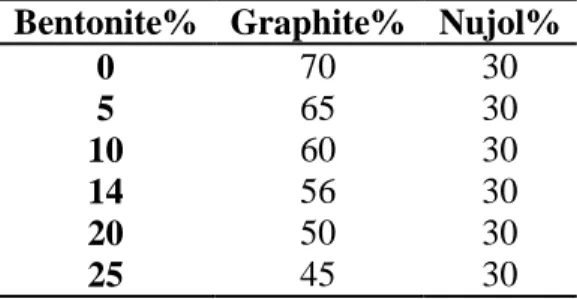
Table 3. % bentonite-CPE content investigated.
Bentonite% Graphite% Nujol%
0 70 30 5 65 30 10 60 30 14 56 30 20 50 30 25 45 30
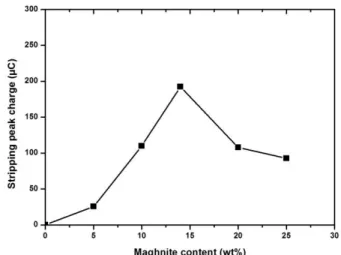
The optimum composition of bentonite in the CPE was thoroughly studied by a series of experiments where the amount of paraffin oil was kept constant at 30% level, and in the remaining 70% solid phase the relative amount of bentonite /graphite was changed (Table 3), and the SWASV signals of a 10-5 mol L–1 Cd2+ ion at the bentonite-CPE following the same experimental conditions than in Fig. 4 were recorded. Fig. 6 displays the effect of bentonite-CPE content ranging from 0% to 25% w/w upon the 10-5 mol L–1 Cd2+ charge of SWASV.
Figure 6. Effect of the clay content in CPE on the response of 10−5 mol L-1 Cd2+ at preconcentration pH = 3.4.
As shown in Fig. 6, the bentonite-CPE signal (stripping peak charge) is increased with increasing amount of bentonite in the paste up to 14%. However, a further increase in the bentonite content (14% to 25%) resulted in some considerable decrease in the signal. The signal enhancement between 0% and 14% is attributed to the increase of the number of surface reactive sites; the presence of more clay will result in more binding sites for Cadmium cations on bentonite surface, leading to the improvement of the efficiency of preconcentration of the Cadmium at the bentonite-CPE. The sensitivity loss at higher loadings is due to the diminished conductivity of the electrode, which is attributed to the lower carbon content. Thus, a graphite powder/bentonite/paraffin oil electrode composition of 56%/14%/30% was selected as optimal condition for preparation of bentonite-CPE in further studies. One can also see that the graphite used exhibits very low adsorption properties for Cadmium. The peak charge at the bare CPE (0% bentonite) is practically null. Hence, all the adsorption capacity of the electrode is undoubtedly due to the high exchange capacity of the clay employed for modifying the electrode.
3.2.4. Calibration of the electrochemical modified CPE sensor
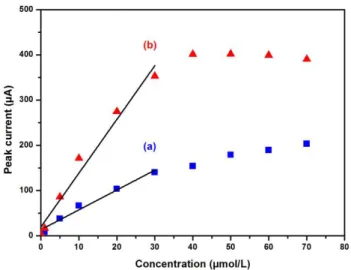
The calibration of the bentonite-CPE was investigated under optimized conditions (preconcentration pH at 3.4 and bentonite-CPE content of 14 % w/w) using SWASV following 5 min preconcentration at open circuit conditions under stirring in 0.001 M HClO4 and detection with initial
potential at –1.0 V for 60 s in 0.1 M HClO4 for the individual detection in aqueous solutions of
Cadmium in the range 1-70 µmol/L (See Fig. 7a) and for Lead in the range 0.1-70 µmol/L (Fig. 7b). The exhibited stripping peak current is proportional to the concentration of Cadmium in the entire range studied (1-70 µmol/L) (Fig. 7a) while the same peak current of the Lead is only proportional to its concentration in the range (0.1-30 µmol/L) and achieves almost a plateau for higher Lead concentrations due to the saturation of the adsorption sites of the CPE (Fig. 7b).
Figure 7. Calibration graphs of bentonite-CPE for Cadmium (a) and for Lead (b) under optimized experimental conditions.
The calibration plots of peak current vs concentration increased linearly in the ranges of 1-30 µmol/L and 0.1-30 µmol/L for Cadmium and Lead respectively. The linear regression equations are Ipa (µA) = 4.38 [Cd] (µmol/L) + 13.57 (µA) (R2 = 0.9745) and Ipa (µA) = 11.88 [Pb] (µmol/L) + 19.68 (µA) (R2 = 0.9684). The analytical parameters are summarised in Table 4 where the limits of detection (LOD) and quantification (LOQ) were computed as LOD = 3 Sd/m and LOQ = 10 Sd/m where m is the slope of the calibration curves and Sd the standard deviation of three measurements of peak currents for
1 µmol/L solution of Pb++ and Cd++ separately [46]. Table 4. Analytical parameters for the developed CPE.
Metal ion Intercept (µA) Slope (µA/µmol/L) R2 LOD (µmol/L) LOQ (µmol/L) Cd++ 13.57±5.96 4.38±0.35 0.9745 0.16 0.54 Pb++ 19.68±14.73 11.88±0.95 0.9684 0.30 1.01
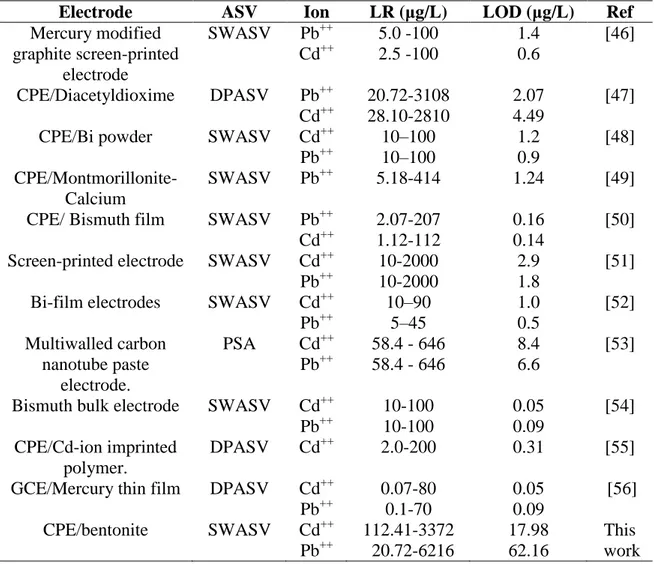
Also, we have compared the performance of this electrode with some other different modified electrodes for the determination of Cd(II) and Pb(II) in similar conditions. We have summarised the electrode composition, technique and sensitivity parameters and compiled them in Table 5. It can be seen that the analytical performance of our bentonite-CPE is comparable and even better when compared to the previous reports of the literature. For example, the linear range in this study is larger than those obtained with CPE modified with Diacetyldioxime [47], Bismuth powder [48], Montmorillonite [49] and Bismuth film [50]. It has also the highest upper limit linear range for both metallic ions like Cadmium and Lead (30 µmol/L). It is even higher than the one reported for screen printed electrodes [51] and for multiwalled carbon nanotubes paste electrode [53].
Table 5. Comparison of results obtained using the method described herein with those reported in the literature based on stripping voltammetry.
Electrode ASV Ion LR (μg/L) LOD (μg/L) Ref
Mercury modified graphite screen-printed electrode SWASV Pb++ Cd++ 5.0 -100 2.5 -100 1.4 0.6 [46] CPE/Diacetyldioxime DPASV Pb++ Cd++ 20.72-3108 28.10-2810 2.07 4.49 [47] CPE/Bi powder SWASV Cd++
Pb++ 10–100 10–100 1.2 0.9 [48] CPE/Montmorillonite-Calcium SWASV Pb++ 5.18-414 1.24 [49]
CPE/ Bismuth film SWASV Pb++ Cd++ 2.07-207 1.12-112 0.16 0.14 [50] Screen-printed electrode SWASV Cd++
Pb++ 10-2000 10-2000 2.9 1.8 [51] Bi-film electrodes SWASV Cd++
Pb++ 10–90 5–45 1.0 0.5 [52] Multiwalled carbon nanotube paste electrode. PSA Cd++ Pb++ 58.4 - 646 58.4 - 646 8.4 6.6 [53]
Bismuth bulk electrode SWASV Cd++ Pb++ 10-100 10-100 0.05 0.09 [54] CPE/Cd-ion imprinted polymer. DPASV Cd++ 2.0-200 0.31 [55]
GCE/Mercury thin film DPASV Cd++ Pb++ 0.07-80 0.1-70 0.05 0.09 [56] CPE/bentonite SWASV Cd++ Pb++ 112.41-3372 20.72-6216 17.98 62.16 This work SWASV: Square wave anodic stripping voltammetry.
DPASV: Differential pulse anodic stripping voltammetry. PSA: Potentiometric stripping analysis.
4. CONCLUSION
In this work, a carbon paste electrode (CPE) was modified by an Algerian Maghnite and the square wave anodic stripping voltammetry (SWASV) following preconcentration at open circuit potential (OCP) and medium exchange was applied for the detection of Cadmium and Lead in aqueous solutions. The preconcentration pH and the CPE Maghnite content were optimized and were found to be 3.4 and 14% respectively. The results proved that Na-Maghnite is a good cation exchanger and has strong adsorptive properties. This Maghnite-CPE electrode shows a very wide linear range for the both Cadmium and Lead ions. The proposed electrode is suitable for the detection of Cadmium and Lead in aqueous solutions at micromolar concentration.
ACKNOWLEDGEMENTS
We acknowledge the MESRS and DG–RSDT (Ministère de l’Enseignement Supérieur et de la Recherche Scientifique et la Direction Générale de la Recherche - Algérie) for financial support. Financial support from the Spanish Ministerio de Economía y Competitividad and FEDER funds (MAT2016-76595-R) is also gratefully acknowledged.
SUPPLEMENTARY DATA:
Fig. S1. DFT curve for raw Maghnite.
Fig. S2. DFT curve for Maghnite-Na.
References
1. J. H. Duffus, Pure Appl. Chem., 74 (5) (2002) 793.
2. M. Jaishankar, T. Tseten, N. Anbalagan, B. B. Mathew and K. N. Beeregowda, Interdiscip. Toxicol., 7 (2) (2014) 60.
3. G. Aragay, J. Pons and A. Merkoc, Chem. Rev., 111 (5) (2011) 3433. 4. WHO, Guidelines for drinking-water quality, 4th ed., WHO (2011).
5. J. Wang, Analytical Electrochemistry, 3rd ed., Wiley-VCH, New York (2006).
6. A.J. Bard and L.R. Faulkner, Electrochemical Methods, 2nd ed., Wiley, New York, (2001). 7. P. A. Ariya, M. Amyot, A. Dastoor, D. Deeds, A. Feinberg, G. Kos, A. Poulain, A. Ryjkov, K.
Semeniuk, M. Subir and K. Toyota, Chem. Rev., 115 (10) (2015) 3760. 8. R. N. Adams, Anal. Chem., 30 (1958) 1576.
9. N. Y. Stozhko, N. A. Malakhova, M. V. Fyodorov and K. Z. Brainina, J. Solid State Electrochem., 12 (2008) 1185.
10. I. Švancara, K. Vytřas, K. Kalcher, A. Walcarius and J. Wang, Electroanalysis, 21 (1) (2009) 7. 11. R. Srinivasan, Adv. Mater. Sci. Eng., (2011).
12. K.G. Bhattacharyya and S.S. Gupta, Adv. Colloid Interface Sci., 140 (2008) 114. 13. P.K. Ghosh and A.J. Bard, J. Am. Chem. Soc., 105 (1983) 5691.
14. C. Mousty, Appl. Clay Sci., 27 (2004) 159.
15. R.E. Grim and N. Guven, Bentonites, Elsevier Science, (1978).
16. M. Belbachir and A. Bensaoula, United States Patent, US 7,094,823 B2 (2006).
17. N. Aliouane, A. Hammouche, R.W. De Doncker, L. Telli, M. Boutahala and B. Brahimi, Solid State Ionics, 148 (2002) 103.
18. J.R. White and A.J. Bard, J. Electroanal. Chem., 197 (1986) 233.
19. E. Ngameni, I.K. Tonlé, J.T. Apohkeng, R.G.B. Bouwé, A.T. Jieumboué and A. Walcarius, Electroanalysis, 18 (2006) 2243.
20. H. Khalaf, O. Bouras and V. Perrichon, Microporous Mater., 8 (1997) 141. 21. A. Walcarius, T. Barbaise and J. Bessiere, Anal. Chim. Acta, 340 (1997) 61. 22. I. K. Tonle, E. Ngameni and A. Walcarius, Sens. Actuators B, 110 (2005) 195.
23. R.G.B. Bouwe, I.K. Tonle, S. Letaief, E. Ngameni and C. Detellier, Appl. Clay Sci., 52 (2011) 258. 24. J.D.G. Durán, M.M. Ramos-Tejada, F.J. Arroyo and F. González-Caballero, J. Colloid Interface
Sci., 229 (2000) 107.
25. F. Chouli, A. Benyoucef, A. Yahiaoui, C. Quijada and E. Morallon, J. Polym. Res., 19 (2012) 3. 26. I. Toumi, A. Benyoucef, A. Yahiaoui, C. Quijada and E. Morallon, J. Alloys Compd., 551 (2013)
212.
27. A. Zehhaf, E. Morallon and A. Benyoucef, J. Inorg. Organomet. Polym., 23 (2013) 1485. 28. H. Zaghouane-Boudiaf, M. Boutahala, S. Sahnoun, C. Tiar and F. Gomri, Appl. Clay Sci., 90
(2014) 81.
29. F. Arbaoui and M.N. Boucherit, Appl. Clay Sci., 91–92 (2014) 6.
30. A. El-Kebir, A. Harrane and M. Belbachir, Arab. J. Sci. Eng., 41 (2016) 2179. 31. A. Harrane, R. Meghabar and M. Belbachir, Int. J. Mol. Sci., 3 (2002) 790.
32. O.Y. Kwon, K.W. Park and S.Y. Jeong, Bull. Korean Chem. Soc., 22 (7) (2001) 678.
33. H.J. Salavagione, D. Cazorla-Amorós, S. Tidjane, M. Belbachir, A. Benyoucef and E. Morallón, Eur. Polym. J., 44 (2008) 1275.
34. Z. Ding and R.L. Frost, Thermochim. Acta, 416 (2004) 11.
35. K.S.W. Sing, D.H. Everett, R.A.W. Haul, L. Moscou, R.A. Pierotti, J. Rouquérol and T. Siemieniewska, Pure Appl. Chem., 57 (4) (1985) 603.
36. A. Sdiri, T. Higashi, T. Hatta, F. Jamoussi and N. Tase, Chem. Eng. J., 172 (2011) 37.
37. A. Zehhaf, A. Benyoucef, R. Berenguer, C. Quijada, S. Taleb and E. Morallon, J. Therm. Anal. Calorim., 110 (2012) 1069.
38. E. Alvarez-Ayuso and A. Garćia-Śanchez, Clays Miner., 51 (5) (2003) 475. 39. T. Mathialagan and T. Viraraghavan, Sep. Sci. Tech., 38 (1) (2003) 57.
40. W.M. Ye, Y. He, Y.G. Chen, B. Chen and Y.J. Cui, Eng. Geol. Soc. Territ., 6 (2015) 533. 41. M. Hamidpour, M. Kalbasi, M. Afyuni, H. Shariatmadari and G. Furrer, Environ. Earth Sci., 62
42. C.A. da Rosa, I.C. Ostroski, J.G. Meneguin, M.L. Gimenes and M.A.S.D. Barros, Appl. Clay Sci., 104 (2015) 48.
43. J.M. Sperry and J.J. Peirce, Water Environ. Res., 71 (3) (1999) 316.
44. A. Ourari, A. Flilissa, M. Boutahala and H. Ilikti, J. Surfactants Deterg., 17 (2014) 785. 45. E. I. Unuabonah, B.I. Olu-Owolabi, K.O. Adebowale and A.E. Ofomaja, Colloids Surfaces A
Physicochem. Eng. Asp., 292 (2007) 202.
46. L.F. Ribeiro and J.C. Masini, Electroanalysis, 26 (2014) 2754. 47. C. Hu, K. Wu, X. Dai and S. Hu, Talanta, 60 (2003) 17.
48. S.B. Hočevar, I. Švancara, K. Vytřas and B. Ogorevc, Electrochim. Acta, 51 (2005) 706. 49. D. Sun, C. Wan, G. Li and K. Wu, Microchim. Acta, 158 (2007) 255.
50. L. Baldrianova, I. Svancara and S. Sotiropoulos, Anal. Chim. Acta, 599 (2007) 249.
51. R. Güell, G. Aragay, C. Fontàs, E. Anticó and A. Merkoçi, Anal. Chim. Acta, 627 (2008) 219. 52. C. Kokkinos, A. Economou, I. Raptis and C.E. Efstathiou, Electrochim. Acta, 53 (2008) 5294. 53. C.R.T. Tarley, V.S. Santos, B.E.L. Baêta, A.C. Pereira and L.T. Kubota, J. Hazard. Mater., 169
(2009) 256.
54. K.C. Armstrong, C.E. Tatum, R.N. Dansby-sparks, J.Q. Chambers and Z. Xue, Talanta, 82 (2010) 675.
55. H. Ashkenani and M.A. Taher, Microchim. Acta, 178 (2012) 53. 56. A.A. Ensafi, Z. Nazari and I. Fritsch, Analyst, 137 (2012) 424.
© 2018 The Authors. Published by ESG (www.electrochemsci.org). This article is an open access article distributed under the terms and conditions of the Creative Commons Attribution license (http://creativecommons.org/licenses/by/4.0/).