Open Archive TOULOUSE Archive Ouverte (OATAO)
OATAO is an open access repository that collects the work of Toulouse researchers and
makes it freely available over the web where possible.
This is an author-deposited version published in :
http://oatao.univ-toulouse.fr/
Eprints ID : 13806
To link to this article
: DOI:10.1016/j.talanta.2015.03.036
URL :
http://dx.doi.org/10.1016/j.talanta.2015.03.036
To cite this version
: Laffont, Laure and Hezard, Teddy and Gros,
Pierre and Heimbürger, Lars-Eric and Sonke, Jeroen E. and Behra,
Philippe and Evrard, David
Mercury(II) trace detection by a gold
nanoparticle-modified glassy carbon electrode using square-wave
anodic stripping voltammetry including a chloride desorption step.
(2015) Talanta, vol. 141. pp. 26-32. ISSN 0039-9140
Any correspondance concerning this service should be sent to the repository
administrator:
[email protected]
Mercury(II) trace detection by a gold nanoparticle-modified glassy
carbon electrode using square-wave anodic stripping voltammetry
including a chloride desorption step
Laure Laffont
a,b,c,d,e,1, Teddy Hezard
a,b, Pierre Gros
a,b, Lars-Eric Heimbürger
f,g,2,
Jeroen E. Sonke
f,g, Philippe Behra
c,d, David Evrard
a,b,naUniversité de Toulouse, UPS, INPT, Laboratoire de Génie Chimique, 118 route de Narbonne, F-31062 Toulouse, France bCNRS, Laboratoire de Génie Chimique, F-31062 Toulouse, France
cUniversité de Toulouse, INPT, LCA (Laboratoire de Chimie Agro-industrielle), UMR 1010, ENSIACET, 4 allée Emile Monso, F-31030 Toulouse CEDEX 4, France dINRA, LCA (Laboratoire de Chimie Agro-industrielle), F-31030 Toulouse, France
eFCS RTRA “Sciences et Technologies pour l'Aéronautique et l'Espace”, 23 avenue Edouard Belin, F-31400 Toulouse, France fUniversité de Toulouse, UPS, Géosciences Environnement Toulouse, 14, avenue Edouard Belin, F-31400 Toulouse, France gCNRS, Géosciences Environnement Toulouse, F-31400 Toulouse, France
Keywords: Hg(II) sensor Gold nanoparticles Stripping voltammetry Chloride desorption step Natural water
a b s t r a c t
Gold nanoparticles (AuNPs) were deposited on a glassy carbon (GC) substrate by constant potential electrolysis and characterized by cyclic voltammetry in H2SO4and field emission gun scanning electron
microscopy (FEG-SEM). The modified AuNPs–GC electrode was used for low Hg(II) concentration detection using a Square Wave Anodic Stripping Voltammetry (SWASV) procedure which included a chloride desorption step. The comparison of the obtained results with our previous work in which no desorption step was used showed that this latter step significantly improved the analytical performances, providing a three time higher sensitivity and a limit of detection of 80 pM for 300 s preconcentration, as well as a lower average standard deviation. The influence of chloride concentration on the AuNPs–GC electrode response to Hg(II) trace amounts was also studied and its optimal value confirmed to be in the 10!2
M range. Finally, the AuNPs–GC electrode was used for the determination of Hg(II) in a natural groundwater sample from south of France. By using a preconcentration time of 3000 s, a Hg(II) con-centration of 1973 pM was found, which compared well with the result obtained by cold vapor atomic fluorescence spectroscopy (2272 pM).
1. Introduction
Like many other micropollutants, heavy metals have emerged as a major concern both in terms of human health[1,2]and environ-mental risks[3,4]. They are considered as a major source of ecolo-gical issues because of their widespread occurrence in natural media
[5]. This is particularly true for methylmercury (MeHg) which bioaccumulates along the trophic chain[6,7]and has adverse health effects on mammals including humans [8,9]. As it is commonly
suggested now that MeHg production relies on the (bio-)availability of inorganic Hg(II) [10], it appears of critical importance to thor-oughly understand Hg(II) dynamics that is, daily variations of inor-ganic Hg(II) concentration and speciation. Hg(II) may be dangerous even at very low concentration[7,11,12]so that the World Health Organization has delivered a guideline value of 1 mg L!1(ca. 5 nM)
for drinking water[13]. As a consequence, environmental monitor-ing of Hg(II) is of critical importance and requires in situ, real-time and highly-sensitive sensors[14].
Hg(II) trace analysis is mainly performed by spectroscopic techniques[15] such as cold-vapor atomic fluorescence spectro-metry (CV-AFS) [16–18] or inductively coupled plasma mass spectrometry (ICPMS) generally associated with gas chromato-graphy [19–22]. All these techniques offer good selectivity and sensitivity [23], reaching 0.2 pM for total Hg(II) [15,18,21]. However, they suffer important limitations, i.e. expensive material and complex and time-consuming procedures, thus limiting any in situ or on line and operando analysis. Moreover, rigorous
n
Corresponding author at: Université de Toulouse, UPS, INPT, Laboratoire de Génie Chimique, 118 route de Narbonne, F-31062 Toulouse, France. Tel.: þ 33 5 61 55 60 73; fax: þ33 5 61 55 61 39.
E-mail address:[email protected](D. Evrard).
1Current address: Université de Toulouse, UPS, Géosciences Environnement Toulouse, 14, avenue Edouard Belin, F-31400 Toulouse, France.
2Current address: University of Bremen, Department of Geosciences, Klagenfurther Strasse, 28215 Bremen, Germany.
sampling and storage conditions are necessary to avoid any external Hg(II) contamination or speciation changes[24,25].
In this context, tremendous attention has been paid to elec-trochemical sensors due to their manifold advantages over other detection methods: they are usually cheap, user-friendly, require little energy and simple procedures and are suitable for on-site analysis. Detection limits in the pM range are frequently reached by using sensitive methods like differential pulse (DPASV) or square wave (SWASV) anodic stripping voltammetry[26,27]either on platinum [28], carbon-based materials [29–33] or gold (Au) electrode. Because of its high affinity for Hg, Au is the most commonly used electrode material in various configurations: bulk
[34], film[35,36], microwire[37,38], microdisk[39]or microdisk array electrode [40]. Another strategy is the use of chemically functionalized electrodes[27,41]. In recent years, Hg(II) detection by means of gold nanoparticles (AuNPs)-modified electrodes has been the subject of many reports[42–45]. This is due to the spe-cific physicochemical properties of these nanomaterials [46]: enhanced diffusion of electroactive species, high effective surface area, improved selectivity, catalytic activity, and higher signal-to-noise ratio[47]. AuNPs may be prepared either by chemical[44]or electrochemical route [42,43,45]. Recently, we reported on an AuNPs-modified glassy carbon (AuNPs–GC) sensor dedicated to Hg (II) trace determination [48,49]. The amperometric response towards Hg(II) was found to be dependent on AuNPs size and density [49] and was hampered by a broad baseline due to chloride anions contribution. We proved that this was rather due to Cl!
adsorption onto the Au surface than to calomel formation
[50], contrary to what has been reported previously in the litera-ture[51]. Considering that the use of Cl!
is a necessary condition to improve Hg(II) trace detection[52], Salaün and van den Berg added a desorption step to the ASV procedure in order to minimize the broad baseline[38]. The detection of Hg(II) and Cu(II) on a Au microwire electrode was improved using this supplementary step. However, no comparative feature was provided with respect to analytical performances whatever the desorption step was used or not. Surprisingly, this up-and-coming strategy did not give rise to a large number of reports. We found only one work from Abollino's group which took advantage of applying a negative potential of !0.8 V between the deposition and the stripping step of the ASV procedure to minimize the adsorption of iodide ions present in Sea lettuce sample [53]. However, few details have been provided since no experimental data were given to support the improve-ment brought by this additional step into the analytical procedure. In this study, we report Hg(II) trace determination results obtained with a AuNPs–GC modified electrode using a SWASV pro-cedure which included a chloride desorption step. The improvement brought was evidenced by comparison of the analytical perfor-mances of the sensor with and without this latter step. Different calibration curves were recorded using varying Cl!
concentrations and the AuNPs–GC modified electrode was successfully tested for Hg (II) determination in natural water.
2. Experimental section 2.1. Reagents
All solutions were prepared in ultrapure water (Q, Milli-pore, 18.2 M
Ω
cm). NaNO3, 65% HNO3, 30% HCl, NaCl and NaOHwere purchased from Merck (suprapur grade). Pb(NO3)2 (ACS
grade) was also provided by Merck. 95% H2SO4(normapur grade)
was obtained from VWR Prolabo. HAuCl4#3H2O pro-analysis grade
was supplied by Acros Organics. Hg(II) solutions were prepared by dilution of 1001 72 mg L!1 Hg(NO
3)2 NIST standard solution
(certiPUR grade, Merck) in 0.01 M HNO3(pH 2) and then used as it.
2.2. Apparatus
All the electrochemical experiments were performed at the Laboratoire de Génie Chimique (LGC) (Toulouse, France) at room temperature in a Teflon PFA three-electrode cell (Metrohm) using a Metrohm Autolab PGSTAT 128N potentiostat interfaced to a computer and controlled with the NOVA 1.10 software package. A Metrohm Ag/AgCl/KCl 3 M electrode separated from the electro-chemical cell by a Teflon PTFE capillary containing 0.1 M NaNO3
solution and ended by a ceramic diaphragm (D type), and a Metrohm glassy carbon wire were used as reference and counter electrodes, respectively. All the potentials are referred to this reference electrode. The working electrode was a glassy carbon (GC) rotating disk electrode from Radiometer (3 mm diameter, A¼7.07 mm2
) modified by gold nanoparticles (AuNPs). The elec-trochemical cell was maintained in a Faraday cage in order to minimize electrical interferences. The solution was deaerated with a high purity N2stream during 10 min and maintained under N2
atmosphere during each experiment.
The AuNPs–GC surface was characterized by field emission gun scanning electron microscopy (FEG-SEM) using a Quanta 250 FEG FEI equipment with an accelerating voltage of 5 kV and a working distance 7 mm depending on the sample. Image analysis was carried out using a LGC homemade program for particle counting (density estimation) and average diameter measurement devel-oped using MatLab image processing toolbox software[48]. The density and average size of AuNPs were evaluated from a 7.2 mm2
GC surface analysis counting 1165 or 2806 particles (depending on the micrograph was recorded before or after a series of electro-chemical measurements). For each deposit, the error was calcu-lated from the analysis of three different SEM images using the adequate magnification.
Total Hg analyses were performed at the Géosciences Envir-onnement Toulouse laboratory (France) with cold-vapor atomic fluorescence spectrometry (CV-AFS) following a method from the Environmental Protection Agency (EPA-1631)[16,54]modified by Cossa et al. [55]. Briefly, total Hg concentration analysis was achieved by chemical reduction of dissolved Hg(II) to vapor phase Hg(0) using SnCl2 in acidic media after BrCl preoxidation. Hg
(0) vapor was then amalgamated on a gold trap and released by flash heating into a Brooks Rand Model III AFS. The accuracy was verified daily with the ORMS-5 certified reference material of riverine water from the National Research Council of Canada. 2.3. Water sampling and conditioning
Natural water dedicated to Hg(II) trace detection was sampled from Font Estramar (42° 51′ 31.73″N 2° 57′ 30.776″E), which is a submarine groundwater discharge located at Salses-le-Château (Pyrénées Mountains) at the edge of Corbières Mountains (France). An unfiltered sample was taken and stored into a 2 L FEP Teflon bottle. Chloride concentration in this water was 34 mM and dis-solved organic carbon concentration was 1.2 mg L!1. The sample
was acidified with 0.01 M HNO3overnight before SWASV analysis.
2.4. Working electrode preparation
GC surface was carefully polished successively by 9 mm (5 min), 3 mm (2 min), 1 mm (1 min) and 0.3 mm (1 min) mecaprex diamond compounds (Presi) on a cloth polishing pad. The GC surface was cleaned in an ultrasonic bath in ethanol for 5 min between each polishing in order to remove impurities. AuNPs were electro-chemically deposited at 20 °C in a standard three-electrode water-jacketed cell from a 0.1 M NaNO3 deaerated solution containing
0.25 mM HAuCl4 by potentiostatic electrolysis at 0 V for 15 s,
activated by recording 10 voltammograms between 0 and 1.4 V at a scan rate of 100 mV s!1in 0.5 M H
2SO4.
2.5. Hg(II) detection
Hg(II) detection on AuNPs–GC electrode was achieved in dea-erated 0.01 M HCl or 0.01 M HNO3solution containing NaCl (from
0.2 mM to 500 mM). Hg(II) was analyzed by SWASV under the following conditions: constant cleaning potential between 0.5 and 0.8 V, depending on NaCl concentration, for 15 s; preconcentration cathodic potential at 0 V for 300 s; desorption cathodic potential at !0.8 V for 60 s; pulse amplitude ¼25 mV, step amplitude ¼5 mV, frequency ¼ 200 Hz; anodic scan from 0 to 0.5–0.8 V depending on NaCl concentration. The working electrode rotation frequency was 2000 rpm during the preconcentration step. A second scan was recorded immediately after the first one using the same conditions except that the preconcentration and desorption cathodic times were reduced to 30 s and 6 s, respectively (10% of first measure-ment) and considered as a blank[48,49]. Hg(0) reoxidation peak heights (
Δ
ip) were calculated after subtraction of this blank. Thisprocedure, called “subtractive ASV method”, has been previously reported in the literature[56]. It allows the analytical results to be released from background vagaries. It has to be noticed that the subtractive anodic signals recorded with low Hg(II) concentrations were noisy; hence we needed to use a Savitzky-Golay smoothing function.
3. Results and discussion
3.1. AuNPs electrodeposition and characterization
AuNPs were electrochemically deposited onto the GC electrode by applying a constant electrode potential of 0 V for 15 s to a 0.1 M NaNO3solution containing 0.25 mM HAuCl4. This potential being
nearly 500 mV more cathodic than the peak potential corre-sponding to Au(III) reduction, AuNPs deposition onto the electrode surface occurred according to Reaction(1):
AuCl4!þ3e!-Au þ 4Cl! (1)
These conditions were chosen in accordance with our previous work in order to get a dense deposit of small NPs, which ensures the best analytical performances with respect to Hg(II) trace determination [49]. The obtained deposit was characterized by cyclic voltammetry in 0.5 M H2SO4and FEG-SEM.Fig. 1shows the
typical CV obtained in acidic media for electrodeposited AuNPs (solid line). The voltammogram exhibited on the forward scan the anodic signals between 1.1 and 1.35 V which correspond to the formation of several kinds of Au oxides, the major one being AuO according to Reaction(2):
AuþH2O-AuOþ2H þ
þ2e!
(2) On the backward scan, a single reduction peak at 0.88 V with a post-peak shoulder was observed, which corresponded to the reduction of the oxides formed during the forward scan.Fig. 2A shows a FEG-SEM micrograph recorded on a GC electrode freshly functionalized by electrodeposited AuNPs. The different features corresponding to the deposit extracted fromFigs. 1and2, namely the amount of charge corresponding to Au oxides reduction (Qoxides) and AuNPs average size and density are summarized in
Table 1. As expected, the FEG-SEM micrograph exhibited a dense array of AuNPs, homogeneously distributed over the GC surface. Both AuNPs average size and density compared favorably with our previous work (ca. 17 nm and 332 particles mm!2, respectively)
[49], thus demonstrating good reproducibility of the deposition method.
3.2. Influence of chloride desorption potential on analytical performances
The influence of the insertion of a chloride desorption potential in the analytical procedure was checked by studying the SWASV response of the AuNPs–GC electrode to a 0.01 M HCl solution containing 4 nM Hg(II). This latter condition was chosen in order to allow direct comparison to be made with our previous work
[49] in which no desorption potential was used (seeTable 2 for comparative features). Fig. 3 presents the SWASVs obtained depending on whether a desorption step was included or not in the analytical procedure. When using this latter step, the peak around 0.6 V which corresponded to Hg(0) reoxidation was shar-pened and the peak current was increased. Indeed, once the analytical blank subtraction operated (see Experimental Section for details), the resulting peak current (
Δ
ip) was nearly twicewhen using the chloride desorption step, suggesting an improved sensitivity of the AuNPs toward Hg(II). Applying a negative deso-rption potential also induced simultaneously a slight decrease in the broad amperometric signal observed in the potential range 0.2–0.4 V, which was proved to result from Cl!
adsorption[50]. Consequently, this additional desorption step clearly modified the overall shape of the voltammogram by reducing the broad base-line and by improving the amperometric response with respect to Hg(II) detection.
The analytical performances of the AuNPs–GC electrode were checked by adding successive amounts of Hg(II) to a 0.01 M HCl solution and recording the corresponding SWASVs using a chloride desorption potential. The amperometric response exhibited a clear linear trend up to 6 nM Hg(II) (Fig. 3, inset). For higher Hg(II) concentrations, the
Δ
ip values obtained were lower than thatexpected from the linear regression, suggesting a saturation effect of the electrode surface. As can be seen fromTable 2, the linear range was wider when no desorption step was applied, since
Δ
ipvalues obtained for Hg(II) concentrations higher than 6 nM fitted to the linear regression curve. These data confirmed that when no negative potential desorption step was applied between the deposition and the stripping steps of the ASV procedure, a bigger amount of chloride ions remained adsorbed at the electrode
Fig. 1. CVs recorded in a 0.5 M H2SO4solution on a AuNPs–GC electrode before (solid line) and after (dashed line) a series of Hg(II) measurements using SWASV. Scan rate: 100 mV s!1. AuNPs–GC electrode was prepared from a deaerated 0.1 M NaNO3solution containing 0.25 mM HAuCl4by constant potential electrolysis at 0 V for 15 s.
surface, which constituted an additional diffusion barrier with respect to Hg(II) reduction. On the contrary in the presence of a desorption step, the electrode surface is more reachable for Hg(II) thus making the sensor more sensitive. This is consistent with the significant increase in sensitivity which may be noticed bet ween the procedure with (0.60 mA nMHg!1min!1) and without
(0.23 mA nMHg
!1min!1) chloride desorption step. The limit of de
tection (LOD) was also significantly improved by the addition of this latter step since Hg(II) concentrations down to 80 pM may be detected and quantified vs. 400 pM in our previous work, using a same preconcentration time of 300 s. It has to be noticed that the 80 pM value was calculated for a signal-to-noise ratio of 3[57]and confirmed experimentally by adding successive 10 pM Hg(II) amounts to a Hg-free solution. This lowered LOD is in accordance with the results reported by Salaün and van den Berg who pro-posed a flatter baseline to be at the origin of this improvement
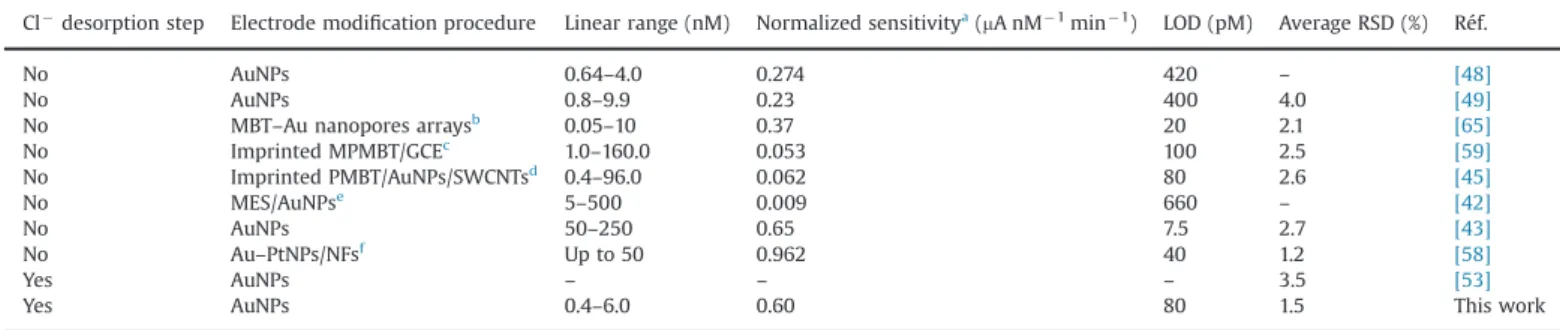
[38], however, without providing any demonstration. Our results also agreed well with this latter work since we found that the best desorption duration was 20% of the deposition time, ca. 1 min. Thus, the AuNPs–GC electrode seemed to behave in a similar way to a Au microwire since its analytical performances were sig-nificantly enhanced by the use of a chloride desorption step, considering the actual goal of the system to be Hg(II) trace determination. Finally, an improvement of the accuracy of the sensor was also noticed, since the average relative standard deviation (RSD) was more than twice lower when operating with the chloride desorption step. The analytical performances of the sensor also compared well with literature data. In particular, the normalized sensitivity was found to be one of the best, being closed to that reported by Abollino et al.[43]. Only Gong et al. reported a value 1.6 times higher[58]. However the functionalized interface was a little bit complicated in this latter case, since previously prepared bimetallic Au–Pt NPs were electrodeposited onto organic nanofibers on a GC electrode. The average RSD of the AuNPs–GC sensor was also found to be one of the lowest. The
widest linear ranges were observed on systems which used organic compounds or polymers combined to NPs[42,59], except that reported by Abollino et al. [43], but in this case the metal deposit looked like more a 3D porous nanostructured Au film than a AuNPs array. Finally, it has to be noticed that, as far as we know, this work is the only one using a chloride desorption step which reports clear analytical performances features.
3.3. Influence of chloride concentration on analytical performances The influence of chloride concentration on the analytical per-formances was studied by performing calibrations curves in the range 0.3–10 nM Hg(II) using an analytical procedure which inclu-ded a chloride desorption step. The Cl!
concentrations were chosen in order to mimic the most common conditions that may be encountered in natural waters, 0.2 mM and 505 mM corresponding to the Cl!
concentrations frequently encountered in fresh and sea water, respectively. The results obtained are summarized inTable 3. Clearly, the best responses were obtained for Cl!
concentrations around 10!2M, in accordance with literature data[34,38,60]. Linear
range, sensitivity and LOD reached their optimum values under these conditions, the best ones corresponding to 60 mM Cl!
. Thus, from this point of view, the AuNPs–GC electrode behave rather like thick film graphite electrodes modified with a Au(III) inorganic complex[60]than like a Au disk[34]or microwire[38]. For Cl!
concentration corresponding to sea water, the sensitivity remained quite good but the LOD was 400 nM, this latter value being the same as that obtained in 0.01 M Cl!
without chloride desorption step. The linear range was narrowed both from lower and higher concentra-tions, being only 0.9–4.0 nM. In this case Cl!
anions seemed to hamper Hg(II) trace detection, probably because of their very strong interactions with the Au surface. When operating at 0.2 mM Cl!
, the AuNPs–GC electrode exhibited sensitivity more than 4 times lower than under the best conditions. It has to be noticed that the LOD was better in this latter case than for 505 mM Cl!
, leading to the observation that a better sensitivity did not give rise to lower LOD. The reason for that is not clear but may lie in the Cl!
interactions with the Au surface.
3.4. Stability of the AuNPs deposit toward measurements
The stability of the AuNPs–GC electrode analytical response was checked vs. time and measurements. It was found that the amperometric signal corresponding to a given Hg(II) concentration decreased very fast over few days (not shown). An alteration of the signal was also noticed when increasing the number of successive measurements, although a cleaning step was included in the whole analytical procedure. To get information on this phenom-enon which is poorly documented in the literature, the AuNPs
Fig. 2. FEG-SEM micrographs of a AuNPs–GC electrode prepared from a deaerated 0.1 M NaNO3solution containing 0.25 mM HAuCl4by constant potential electrolysis at 0 V for 15 s before (A) and after (B) a series of Hg(II) measurements.
Table 1
Characteristics of the AuNPs deposit on GC electrode obtained by CV and FEG-SEM. Qoxides (mC)a NPs density (mm!2)b Average diameter (nm)b
Before Hg(II) analysis 3.2 391715 (2806) 1978
After Hg(II) analysis 4.8 162719 (1165) 2779
aQ
oxidesis the charge corresponding to the reduction of Au oxides in 0.5 M H2SO4obtained by integration of the peak at 0.88 V (Fig. 1, solid line).
bSeeSection 2for details on NPs density and average diameter estimation. The values in brackets correspond to the average number of particles considered for the calculation (Fig. 2).
deposit was characterized by CV and SEG-FEM after a series of Hg(II) measurements. The comparison of the two CVs recorded in 0.5 M H2SO4before and after Hg(II) measurements (Fig. 1) clearly
indicates a modification of the surface structure of the AuNPs, as illustrated by the very different morphologies observed for the part of the CVs corresponding to Au oxides formation. Moreover, on the backward scan, the cathodic peak of Au oxides reduction
was larger after Hg(II) measurements than before, suggesting the active surface area of the whole deposit to be increased by suc-cessive analytical procedures. This observation indicates that during the preconcentration step, Hg does not only form a monolayer on the AuNPs but amalgamates, thus modifying the structure of the electrode surface and probably increasing its roughness. However, complex phenomena may occur during Hg preconcentration since the active surface increase did actually lead to a decrease in the amperometric response corresponding to Hg(0) reoxidation. Fig. 2B shows the SEM-FEG micrograph obtained for the AuNPs–GC electrode after a series of Hg(II) measurements. A less dense deposit of larger AuNPs was observed, compared toFig. 2A (seeTable 1for quantitative features), which confirms that the deposit morphology strongly evolves during trace Hg(II) measurements. The almost 50% increase in average diameter of the AuNPs suggests that coalescence phenomena occur but it could be also possible that very small AuNPs redissolve into the solution during the reoxidation step due to their poor stability [61,62], only the biggest AuNPs remaining on the elec-trode surface. The fact that both NPs average diameter increases and their density decreases implies that the geometric surface of the whole deposit decreases. However, the integration of the Au oxides reduction peak at 0.88 V (Fig. 1) indicated that the active surface area increased, which is consistent with the hypothesis of a higher roughness.
3.5. Analysis of a natural water sample
To check the applicability of the AuNPs–GC sensor combined to the electroanalytical procedure including a chloride desorption step toward real sample analysis, Hg(II) measurements were conducted on natural water from Font Estramar. After addition of 0.01 M HNO3
and stirring overnight, the sample was analyzed using the estab-lished procedure. This latter did not allow any peak in the area corresponding to Hg(0) reoxidation to be detected so that an opti-mization became necessary. Tests were first performed using lower preconcentration potentials until a reoxidation peak was observed. !0.1, ! 0.2, ! 0.3 and ! 0.4 V were successively tested and only the latter potential allowed a Hg(0) reoxidation peak to be observed (not shown). However the corresponding peak current was too low to be used for quantification so that further optimization was per-formed by increasing the duration of the preconcentration step. A satisfactory peak current value (ca. 0.35 mA) was obtained for 3000 s preconcentration. Using the new parameters, four successive
Table 3
Influence of chloride concentration on the AuNPs–GC electrode analytical perfor-mances in 0.01 M HNO3. [Cl! ] (mM)a Linear range (nM Hg(II)) Normalized sensitivity (mA nM!1min!1) LOD (pM) 0.2 0.9–4.0 0.153 200 34 0.4–6.0 0.656 80 60 0.4–6.0 0.711 60 505 0.9–4.0 0.520 400
aAdded as NaCl salt. Table 2
Comparison of the analytical performances of a AuNPs–GC electrode in 0.01 M HCl with respect to Hg(II) trace determination. Cl!
desorption step Electrode modification procedure Linear range (nM) Normalized sensitivitya(mA nM!1min!1) LOD (pM) Average RSD (%) Réf.
No AuNPs 0.64–4.0 0.274 420 – [48]
No AuNPs 0.8–9.9 0.23 400 4.0 [49]
No MBT–Au nanopores arraysb 0.05–10 0.37 20 2.1 [65]
No Imprinted MPMBT/GCEc 1.0–160.0 0.053 100 2.5 [59] No Imprinted PMBT/AuNPs/SWCNTsd 0.4–96.0 0.062 80 2.6 [45] No MES/AuNPse 5–500 0.009 660 – [42] No AuNPs 50–250 0.65 7.5 2.7 [43] No Au–PtNPs/NFsf Up to 50 0.962 40 1.2 [58] Yes AuNPs – – – 3.5 [53]
Yes AuNPs 0.4–6.0 0.60 80 1.5 This work
aThe value of the normalized sensitivity was calculated by dividing the slope of the linear response by the electrochemical or chemical preconcentration time. All electrochemical measurements were performed by SWASV excepted Ref.[45]which used DPASV.
b2-Mercaptobenzothiazole adsorbed on gold micro-/nanopore arrays.
cHg(II) imprinting microporous poly(2-mercaptobenzothiazole) film electropolymerized on GC electrode.
dHg(II) imprinting poly(2-mercaptobenzothiazole) film electropolymerized on the surface of gold nanoparticles/single-walled carbon nanotube nanohybrids modified glassy carbon electrode.
eMercaptoethanesulfonate monolayer-modified AuNPs. fBimetallic Au–Pt nanoparticles/organic nanofibers.
Fig. 3. SWASVs recorded on a AuNPs–GC electrode in a deaerated 0.01 M HCl solution containing 4 nM Hg(II) using a procedure including (solid line) or not including (dashed line) a chloride desorption step. Inset: Calibration curve obtained by SWASV on a AuNPs–GC electrode in a deaerated 0.01 M HCl solution with increasing amounts of Hg(II). Each point was the average value obtained for 3 successive measurements. Error bars were not provided in the graph because they were too much tiny (between 0.04 and 0.17 mA) to be seen.
amounts of Hg(II) were spiked into the Font Estramar sample. The corresponding analytical responses are depicted inFig. 4. Only the first two spiked concentrations allowed a linear regression curve to be calculated, the two higher ones inducing a saturation phenom-enon in a similar trend to that reported above, mainly because of the significantly longer preconcentration time. On the basis of the regression equation (
Δ
ip¼0.688172.9963 [Hg(II)]; r2¼0.9940), theHg(II) concentration in the Font Estramar sample was estimated to be 1973 pM. This value was compared to reference technique analysis, namely CV-AFS, which yielded [Hg(II)]¼ 2272 pM. Thus, both the reference method and the AuNPs–GC electrode provided comparable values for the Hg(II) content at the 95% confidence level. This last result makes us confident concerning the selectivity of the sensor and rules out major interferences and especially Cu(II). The concentration of this latter metal cation in submarine groundwater discharge such as Font Estramar has been reported to be around 20 nM[63]. Also, Cu(II) average concentration in the Rhône River (closed to Font Estramar) was 32.7712.6 nM[64], which confirmed the value reported by Beck et al. Thus, the favorable comparison of the results obtained by AFS and the AuNPs–GC sensor suggests that Hg(II) detection using this latter is not affected by Cu(II) con-centration in a 1/1000 Hg to Cu ratio. In a similar way, it may be assumed that organic matter did not undergo interferences when present at concentrations up to 1.2 mg L!1, which corresponded to
the dissolved organic carbon concentration found in Font Estramar water. These results proved that our system was reliable and potentially suitable for in situ analysis of natural water samples. Work is currently in progress in our laboratory in this sense.
4. Conclusions
In this work, we showed that the addition of a chloride deso-rption step in the analytical procedure aiming at Hg(II) trace determination allows to significantly improve the analytical per-formances of a AuNPs–GC electrode. In particular, the sensitivity was three times better and the LOD was as low as 80 pM for 300 s preconcentration. The influence of chloride amount on the ana-lytical performances was also studied and it was proved that AuNPs behave in a similar trend to a Au microwire from this point of view. Finally, the AuNPs–GC electrode succeeded in the deter-mination of Hg(II) trace in a natural groundwater sample, allowing 19 pM Hg(II) to be detected for 3000 s preconcentration. Further
works are in progress to improve the AuNPs deposits stability over time and the number of measurements and to better understand their physico-chemical evolution. Efforts will also focus on the decrease of the preconcentration time in natural water and on a more complete study of potential interfering species.
Acknowledgment
The authors thank the STAE (Sciences et Technologies pour l'Aéronautique et l'Espace) Foundation for financial support. JES acknowledges ERC-2010-StG_20091028 grant from the European Research Council. The authors are grateful to Dr Guillaume Gotti for his kind help in Matlab processing of FEG-SEM micrographs.
References
[1]J. Musarrat, A. Zaidi, M.S. Khan, M.A. Siddiqui, A.A. Al-Khedhairy, Environ. Pollut. 20 (2011) 323–342.
[2]S. Prabhakar, A.K. Singh, D.S. Pooni, Indian J. Anim. Sci. 82 (2012) 244–255. [3]E. Callender, Treatise Geochem. 9 (2004) 67–105.
[4]S.P. Roy, Ecoscan 4 (2010) 235–240.
[5]G.N. Mhatre, Encycl. Environ. Control Technol. 8 (1995) 427–454.
[6]W.F. Fitzgerald, C.H. Lamborg, Geochemistry of Mercury in the Environment, Oxford, Pergamon, 2007.
[7]F.M.M. Morel, A.M.L. Kraepiel, M. Amyot, Annu. Rev. Ecol. Syst. 29 (1998) 543–566.
[8]D. Mergler, H.A. Anderson, L.H.M. Chan, K.R. Mahaffey, M. Murray, M. Sakamoto, A.H. Stern, Ambio 36 (2007) 3–11.
[9]M. Sakamoto, K. Murata, A. Kakita, M. Sasaki, in: Y. Cai, G. Liu, N. O'Driscoll (Eds.), Advances in Environmental Chemistry and Toxicology of Mercury, Wiley-VCH, Weinheim, 2012, pp. 501–516, Chapter 15.
[10]D. Cossa, C. Garnier, R. Buscail, F. Elbaz-Poulichet, N. Mikac, N. Patel-Sorrentino, E. Tessier, S. Rigaud, V. Lenoble, C. Gobeil, Biogeochemistry 119 (2014) 35–43. [11]R. Eisler, Environ. Geochem. Health 25 (2003) 325–345.
[12]Q. Wang, D. Kim, D.D. Dionysiou, G.A. Sorial, D. Timberlake, Environ. Pollut. 131 (2004) 323–336.
[13] Guidelines for Drinking-water Quality, Vol. 1 third ed., World Health Organi-zation, Geneva, 2008.〈http://www.who.int/water_sanitation_health/dwq/ gdwq3rev/en/〉(accessed 16.06.11).
[14]S.L. Suib, Front. Chem. 1 (2013) 1–2.
[15]K. Leopold, M. Foulkes, P. Worsfold, Anal. Chim. Acta 663 (2010) 127–138. [16]N. Bloom, Can. J. Fish. Aquat. Sci. 46 (1989) 1131–1140.
[17]N.S. Bloom, M. Horvat, C.J. Watras, Water Air Soil Pollut. 80 (1995) 1257–1268. [18]D. Cossa, L.-E. Heimbürger, D. Lannuzel, S.R. Rintoul, E.C.V. Butler, A.R. Bowie,
B. Averty, R.J. Watson, T. Remenyi, Geochim. Cosmochim. Acta 75 (2011) 4037–4052.
[19]K.L. Bowman, C.R. Hammerschmidt, Limnol. Oceanogr.—Methods (2011) 121–128.
[20]C.-M. Tseng, C.R. Hammerschmidt, W.F. Fitzgerald, Anal. Chem. 76 (2004) 7131–7136.
[21]M. Monperrus, E. Tessier, S. Veschambre, D. Amouroux, O. Donard, Anal. Bioanal. Chem. 381 (2005) 854–862.
[22]D. Point, W.C. Davis, J.I. Garcia Alonso, M. Monperrus, S.J. Christopher, O.F.X. Donard, P.R. Becker, S.A. Wise, Anal. Bioanal. Chem. 389 (2007) 787–798.
[23]S.K. Pandey, K.-H. Kim, R.J.C. Brown, Trends Anal. Chem. 30 (2011) 899–917. [24]C.H. Lamborg, C.R. Hammerschmidt, G.A. Gill, R.P. Mason, S. Gichuki, Limnol.
Oceanogr.—Methods 10 (2012) 90–100.
[25]C.R. Hammerschmidt, K.L. Bowman, M.D. Tabatchnick, C.H. Lamborg, Limnol. Oceanogr.—Methods 9 (2011) 426–431.
[26]J. Buffle, M.-L. Tercier-Waeber, Trends Anal. Chem. 24 (2005) 172–191. [27]C. Gao, X.-J. Huang, Trends Anal. Chem. 51 (2013) 1–12.
[28]J.M. Pinilla, L. Hernandez, A.J. Conesa, Anal. Chim. Acta 319 (1996) 25–30. [29]S. Meyer, F. Scholz, R. Trittler, Fresenius' J. Anal. Chem. 356 (1996) 247–252. [30]G.G. Muntyanu, J.Anal. Chem. 56 (2001) 546–551.
[31]H. Yi, Anal. Bioanal. Chem. 377 (2003) 770–774.
[32]M. Shamsipur, J. Tashkhourian, B. Hemmateenejad, H. Sharghi, Talanta 64 (2004) 590–596.
[33]J. Svarc-Gajic, Z. Stojanovic, Z. Suturovic, N. Marjanovic, S. Kravic, Desalination 249 (2009) 253–259.
[34]Y. Bonfil, M. Brand, E. Kirowa-Eisner, Anal. Chim. Acta 424 (2000) 65–76. [35]E.A. Viltchinskaia, L.L. Zeigman, D.M. Garcia, P.F. Santos, Electroanalysis 9
(1997) 633–640.
[36]L.A. Khustenko, L.N. Larina, B.F. Nazarov, J. Anal. Chem. 58 (2003) 262–267. [37]S. Daniele, C. Bragato, M.A. Baldo, J. Wang, J. Lu, Analyst 125 (2000) 731–735. [38]P. Salaün, C.M.G. van den Berg, Anal. Chem. 78 (2006) 5052–5060. [39]C. Garnier, L. Lesven, G. Billon, A. Magnier, O. Mikkelsen, I. Pizeta, Anal.
Bioanal. Chem. 386 (2006) 313–323. Fig. 4. Calibration curve obtained by SWASV on a AuNPs–GC electrode in an
acidified (0.01 M HNO3) sample of Font Estramar sample. The measurements were performed using 3000 s preconcentration at ! 0.4 V. White circles corresponds to data which were not included in the regression.
[40]O. Ordeig, C.E. Banks, Jd Campo, F.X. Munoz, R.G. Compton, Electroanalysis 18 (2006) 573–578.
[41]L. Pujol, D. Evrard, K. Groenen-Serrano, M. Freyssinier, A. Ruffien-Cizsak, P. Gros, Front. Chem. 2 (2014) 19.
[42]X.H. Gao, W.Z. Wei, L. Yang, T.J. Yin, Y. Wang, Anal. Lett. 38 (2005) 2327–2343. [43]O. Abollino, A. Giacomino, M. Malandrino, G. Piscionieri, E. Mentasti,
Elec-troanalysis 20 (2008) 75–83.
[44]A. Safavi, E. Farjami, Anal. Chim. Acta 688 (2011) 43–48.
[45]X.-C. Fu, J. Wu, L. Nie, C.-G. Xie, J.-H. Liu, X.-J. Huang, Anal. Chim. Acta 720 (2012) 29–37.
[46]Y. Liu, G. Su, B. Zhang, G. Jiang, B. Yan, Analyst 136 (2011) 872–877. [47]C.M. Welch, R.G. Compton, Anal. Bioanal. Chem. 384 (2006) 601–619. [48]T. Hezard, K. Fajerwerg, D. Evrard, V. Colliere, P. Behra, P. Gros, J. Electroanal.
Chem. 664 (2012) 46–52.
[49]T. Hezard, K. Fajerwerg, D. Evrard, V. Colliere, P. Behra, P. Gros, Electrochim. Acta 73 (2012) 15–22.
[50]T. Hezard, L. Laffont, P. Gros, P. Behra, D. Evrard, J. Electroanal. Chem. 697 (2013) 28–31.
[51]A. Giacomino, O. Abollino, M. Malandrino, E. Mentasti, Talanta 75 (2008) 266–273.
[52]E. Pinilla Gil, P. Ostapczuk, Anal. Chim. Acta 293 (1994) 55–65. [53]O. Abollino, A. Giacomino, M. Ginepro, M. Malandrino, I. Zelano,
Electro-analysis 24 (2012) 727–734.
[54] USEPA, Method 1631, Revision E: Mercury in Water by Oxidation, Purge and Trap, and Cold Vapor Atomic Fluorescence Spectrometry, 2002.
[55] D. Cossa, B. Averty, J. Bretaudeau, A.S. Senard, Speciation du Mercure Dissous Dans les Eaux Marines: Analytical Methods for the Marine Environments, Ifremer and French Ministry for Ecology and Sustainable Development Pub-lication MA0303, Paris, France, 2003.
[56] L. Sipos, H.W. Nürnberg, P. Valenta, M. Branica, Anal. Chim. Acta 115 (1980) 25–42.
[57]Analytical Methods Committee, Analyst 112 (1987) 199–204.
[58] J. Gong, T. Zhou, D. Song, L. Zhang, X. Hu, Anal. Chem. 82 (2010) 567–573. [59] X.-C. Fu, X. Chen, Z. Guo, C.-G. Xie, L.-T. Kong, J.-H. Liu, X.-J. Huang, Anal. Chim.
Acta 685 (2011) 21–28.
[60] C. Faller, N.Y. Stojko, G. Henze, K.Z. Brainina, Anal. Chim. Acta 396 (1999) 195–202.
[61]G. Sandmann, H. Dietz, W. Plieth, J. Electroanal. Chem. 491 (2000) 78–86. [62] M. Ueda, H. Dietz, A. Anders, H. Kneppe, A. Meixner, W. Plieth, Electrochim.
Acta 48 (2002) 377–386.
[63] A.J. Beck, Y. Tsukamoto, A. Tovar-Sanchez, M. Huerta-Diaz, H.J. Bokuniewicz, S.A. Sañudo-Wilhelmy, Appl. Geochem. 22 (2007) 477–490.
[64] P. Ollivier, O. Radakovitch, B. Hamelin, Chem. Geol. 285 (2011) 15–31. [65] X.-C. Fu, X. Chen, Z. Guo, L.-T. Kong, J. Wang, J.-H. Liu, X.-J. Huang, Electrochim.