Square Wave Voltammetric Determination Of Lead In Commercial Kohl Using A Glassy Carbon Electrode
10
0
0
Texte intégral
(2) M. A. Saha et al.. J Fundam Appl Sci. 2011, 3(2), 155-164. 156. Kohl is also associated with spiritual beliefs and medical (protection against eye infections)[2]. The “sauna”, the religious behavioral guidelines of the Islamic belief identifies kohl as a free lead substance, mainly composed of antimony. However, analysis performed on kohl used today has shown low concentration of antimony, less than 0.1% while the main composition of kohl is lead [3-4]. Because antimony is a substance more scarce and expensive, it was gradually replaced through time by lead. However contamination of kohl by lead may may be a pervasive source of lead poisoning, which usually occurs from repeated exposure to small amounts of lead. Lead is a toxic metal that can be harmful to a human health. Once absorbed by the body, lead can damage the brain, nervous system, reproductive system, kidneys and other parts of the body [5]. The high toxicity of lead is du to its stability and accumulation in human body. Recent reports showed that lead poisoning in childhood can cause a lifetime negative effect on intelligence and learning abilities, the effects of which persist long after the initial exposure to lead[6]. Kohl contaminated with lead could be the cause of countless unexplained third-world infant deaths, and a significant contributory factor to early mortality? Several methods have been reported for the analysis of lead, such as atomic absorption spectrometry [7,8], atomic emission spectrometry [9] high performance liquid chromatography [10], inductively coupled plasma-mass spectrometry [11] and neutron activation analysis [12]. However, these techniques have some disadvantages such as complicated operation, high cost of maintenance expensive apparatus and requiring well-controlled experimental conditions. However, the electrochemical methods for the determination of lead are of the most favorable methods because of their low cost and easy operation [13]. The aim of this study is to investigate the possibility of using square wave voltammetry techniques for quantifying lead in commercial kohl.. 2. SQUARE WAVE VOLTAMMETRY TECHNIQUES The square wave voltammetric waveform arises from the superimposition of two waveforms, an incremental staircase potential of amplitude. , which has a square. wave amplitude waveform superimposed on it of magnitude E[14,15]. The current is sampled at the lower potential of the magnitude and then at the higher potential, and the.
(3) M. A. Saha et al.. J Fundam Appl Sci. 2011, 3(2), 155-164. 157. difference between these two currents is the peak current which is proportional to the chemical species concentration over a given concentration range, and is given by:. (1). where. is the electrode radius, D the diffusion coefficient of the electroactive species in. solution, C its concentration,. step potential, F is the Faraday constant, R is the gas. constant, and T is the temperature.. 3. MATERIAL AND METHODS 3.1. Chemicals All reagents were of analytical grade. Lead biacetate (99.5%), sodium nitrate (99%), nitric acid (99%), acetic acid (99%), were all purchased from biochem chemopharma Co.. 3.2. Kohl simples Samples of kohl were purchased from Algeria retail stores, most of these samples originated from Pakistan, India, and Saudi Arabia.. 3.3. Instrumentation and software Square wave voltammetry measurements were performed using PGZ301 potentiostat (radiometer analytical SAS) and a voltammetric cell with a volumetric capacity of 50 mL containing a glassy carbon electrode (GCE) working electrode (radiometer analytical SAS), a Pt wire counter electrode, and an Hg/Hg2Cl2 reference electrode (3.0 M KCl). Solutions were deoxygenated with high purity nitrogen for 3 min prior to each experiment. Data acquisitions were accomplished with a Pentium IV (CPU 3.0 GHz and RAM 1 Gb) microcomputer using VoltaMaster software version 7.08 (radiometer analytical SAS). Graphs plot and calculus were carried out using OriginLab software version 2.0 (Integral Software, France)..
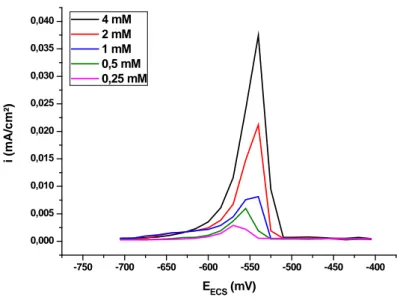
(4) M. A. Saha et al.. J Fundam Appl Sci. 2011, 3(2), 155-164. 158. 3.4. Preparation of standard solution of lead (II) The stock solutions of lead (II) were prepared by dissolving 1.3 g of lead diacetate in 1L aqueous solution of sodium nitrate (0.1 mol/L) to give 4.10-3 mol/L lead (II) standard solution.. 3.5. Digestion of kohl samples A sample of kohl (100 mg) was dissolved in 50 mL aqueous nitric acid solution (2M) and the resulting suspension was stirred for 2h at room temperature. It was then filtered, the filtrate was transferred to the voltammetric cell and the electrochemical measurements were carried out.. 4. RESULTS AND DISCUSSION 4.1. Square wave voltammetry measurements Square wave voltammetric measurements were run from -400 to -700 mV using an electrochemical cell with a volumetric capacity of 50 mL containing a glassy carbon electrode working electrode (radiometer analytical SAS), a Pt wire counter electrode, and an Hg/Hg2Cl2 reference electrode (saturated with KCl). The parameters for square wave voltammetric measurements were: the potential step was 15 mV, the square wave amplitude was 50 mV, and the scan rate was 3 mV/s. All measurements were carried out at room temperature (26 ± 2 °C). The recorded voltammograms of lead solutions in the range of concentrations 4, 2, 1, 0.5, 0.25 mmol/L are represented in (Fig.1)..
(5) M. A. Saha et al.. J Fundam Appl Sci. 2011, 3(2), 155-164. 4 mM 2 mM 1 mM 0,5 mM 0,25 mM. 0,040 0,035 0,030. i (mA/cm²). 159. 0,025 0,020 0,015 0,010 0,005 0,000 -750. -700. -650. -600. -550. -500. -450. -400. EECS (mV). Fig.1. Square wave voltammograms referring to different Pb(II) concentrations in aqueous NaNO3 (0.01 M ) at a glassy carbon electrode, with step potential of 50mV, square wave amplitude of 15mV and scan rate of 3 mV/s.. The calibration graph is obtained by plotting the peak current of the anodic curve of the voltammogram of each sample of the standard versus its concentration. Lead diacetate was used as a standard in the calculation of the concentration of studied kohl samples because its anodic peak current displays excellent linearity toward lead concentrations. As it can be seen from figure (1) there is an increase in oxidation peaks current with the increase in lead concentrations which leads to a linear relation between these two parameters. The oxidation peaks current are summarized in (Table 1).. Table 1. Peaks current obtained from SW voltammogrames of lead C (mmol/L. (mA.cm-2). 4. 0,03746. 2. 0,02122. 1. 0,00813. 0.5. 0,006. 0.25. 0,00292.
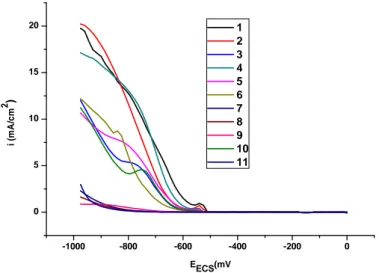
(6) M. A. Saha et al.. J Fundam Appl Sci. 2011, 3(2), 155-164. 160. The equation obtained from the linear calibration graph in the studied concentration range for lead (II) in aqueous NaNO3 is Y = 0.00068 + 0.0093x (where. represents the. value of oxidation current and , the value of lead (II) concentrations, expressed as mmol/L) with a correlation coefficient of R2 = 0.987. Results obtained are shown in (Fig.2). 0,040 0,035. i (mA/cm²). 0,030 0,025 0,020 0,015 0,010 0,005 0,000 0,0. 0,5. 1,0. 1,5. 2,0. 2,5. 3,0. 3,5. 4,0. 4,5. C (mM). Fig.2. Calibration curve obtained from SW voltammograms for different Pb(II) concentrations at 3 mV/s in aqueous NaNO3 (0.01 M ).. 4.2. Square wave Voltammetric lead determination 50 mL of the digested kohl solution was introduced into the electrochemical cell and the oxidation peak current of the voltammogram was recorded. The above procedure was repeated for all samples. The concentration of lead in kohl samples was obtained using the density of the oxidation peak current of the corresponding voltammogram. (Fig.3) shows different voltammogrames of the twelve studied kohl samples..
(7) M. A. Saha et al.. J Fundam Appl Sci. 2011, 3(2), 155-164. 20. 1 2 3 4 5 6 7 8 9 10 11. 2. ). 15. i (mA/cm. 161. 10. 5. 0. -1000. -800. -600. -400. -200. 0. EECS(mV. Fig.3. Square wave voltammograms referring to different kohl concentrations in aqueous HNO3 (2 M ) at a glassy carbon electrode, with step potential of 50mV, square wave amplitude of 15mV and scan rate of 3 mV/s.. In order to get a better reading of peak current density, the voltammograms are retraced in the range of potential: -480 to -585 mV as shown on (Fig.4). The potential shift is probably du to the increase of the resistance solution. 1,2. 1 2 3 4 5 6 7 8 9 10 11. 1,0. 2 i (mA/cm ). 0,8. 0,6. 0,4. 0,2. 0,0 -600. -580. -560. -540. -520. -500. -480. EECS(mV). Fig.4.Square wave voltammograms referring to different kohl samples retraced in the range of potential: -480 to -585 mV. Table 2 shows kohl samples, their origin and level of contamination of lead, all samples were tested in replicates..
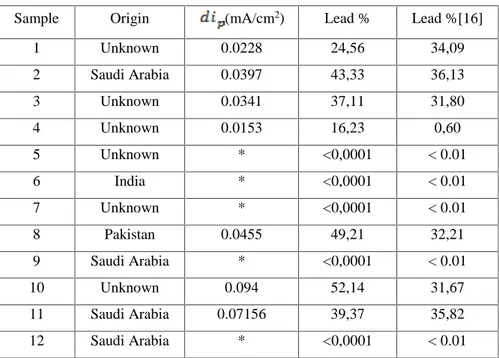
(8) M. A. Saha et al.. J Fundam Appl Sci. 2011, 3(2), 155-164. 162. Table 2. Lead content of kohl samples Sample. Origin. 1. Unknown. 2. (mA/cm2). Lead %. Lead %[16]. 0.0228. 24,56. 34,09. Saudi Arabia. 0.0397. 43,33. 36,13. 3. Unknown. 0.0341. 37,11. 31,80. 4. Unknown. 0.0153. 16,23. 0,60. 5. Unknown. *. <0,0001. < 0.01. 6. India. *. <0,0001. < 0.01. 7. Unknown. *. <0,0001. < 0.01. 8. Pakistan. 0.0455. 49,21. 32,21. 9. Saudi Arabia. *. <0,0001. < 0.01. 10. Unknown. 0.094. 52,14. 31,67. 11. Saudi Arabia. 0.07156. 39,37. 35,82. 12. Saudi Arabia. *. <0,0001. < 0.01. *Value below the detection limit.. 5. CONCLUSION Square wave voltammetric measurements described in this work was successfully applied for the determination of lead contamination of kohl using a glassy carbon electrode. Among the 12 samples of kohl analyzed in this work, seven was found to contain high detectable amounts of lead when digested with HNO3. The highest concentration of lead in studied samples was found to be 52.14 %; this level is considered to be over the safe limits according to the world health organization standards. The other five samples were found to be below the detection limit of lead by square wave voltammetry which is less than 0.001%.. 6. REFERENCES [1] Food and Drugs Administration (FDA), 2003. Kohl, Kajal, al Kahl, or Surma : By any name, a source of Lead poisoning. Tiré de FDA www.cfsan.fda.gov/~dms/coskohl.html. [2] Parry C., Eaton J. Khôl: A lead hazardous makeup from the Third World to the first World, Environmental Health Perspectives. 1991, 94, 121-3. [3] Topham J. Traditional Crafs of Saudi Arabia, Stacey International, London. 1981. [4] Ross H. The Art of Arabian Costume, Stacey International, London. 1981..
(9) M. A. Saha et al.. J Fundam Appl Sci. 2011, 3(2), 155-164. 163. [5] Agusa T., Kunito T., Ramu K., Chamnan C., Trang P. T. K., Minh T. B., Subramanian A., Iwata H., Viet P.H., Tana T.S. and Tanabe S. Lead contamination and its human health effects in India, Vietnam and Cambodia, Biomed Res. Traces Elements. 2006, 17, 413-416. [6] Needleman H., Schell A., Bellinger B., Leviton A., Allred E. The long term effects of exposure to low doses of lead in childhood, N. Engl. J. Med. 1990, 332(2), 83-88. [7] Zacharia A., Gucer S., Izgi B., Chebotarev A., Karaaslanm H. Talanta. 2007, 72, 825. [8] Mhaske H. P., Vaidya V. V., Shailajan S., Singh G., Dalvi K. M. Determination of some heavy metals from medicinal plants, Pueraria tuberose, by atomic adsorption spectrometry technique, Nat. Environ. Poll. Technol. 2006, 5, 389-391. [9] Zhou Y. J., Wang G., Zhou J., Tao G. Determination of trace amounts of lead, arsenic, nickel and cobalt in high-purity iron oxide pigment by inductively coupled plasma atomic emission spectrometry after iron matrix removal with extractantcontained resin, Anal. Chim. Acta. 2007, 584, 204-209. [10] Hu Q., Yang G., Li H., Tai X., Yin J. Study on Determination of Seven Transition Metal Ions in Water and Food by Microcolumn High-Performance Liquid Chromatography, J. Bull. Korean Chem. Soc. 2004, 25(5), 694-698. [11] Dias L., Pierre F., Maia T. D. S., Mesquita da Silva S. M., Frescura M. A., Welz V. L., Curtius B. J. Spectrochim. Acta Part B. 2003, 57. [12] Ayenimo J. G., Yusuf A. M., Adekunle A. S., Makinde O. W. Heavy Metal Exposure from Personal Care Products, Bull Environ Contam Toxicol. 2010, 84, 8–14. [13] Niazi A., Sharifi S., Amjadi E. Least-squares support vector machines for simultaneous voltammetric determination of lead and tin: A comparison between LSSVM and PLS in voltammetric data, J. Electroanal Chem. 2008, 623, 86-92. [14] Osteryoung J., O’Dea J. J., Bard A. J.1986, Electroanal Chem. Vol 14, M. Dekker, Ney York, 209p. [15] Osteryoung J., in M. I. Montenegro et al. 1991, Microelectrodes, Theory and Applications, Kluwer, Dordrecht, 139. [16] Lanez T., Rebiai A., Saha M. A. and Alia M.; International Journal of Toxicology and Applied Pharmacology. 2011, 2(1), 21-24..
(10) M. A. Saha et al.. J Fundam Appl Sci. 2011, 3(2), 155-164. 164. How to cite this article Saha M A, Alia M, Rebiai A and Lanez T. Square wave voltammetric determination of lead in commercial kohl using a glassy carbon electrode. J Fundam Appl Sci. 2011, 3(2), 155-164..
(11)
Figure
Documents relatifs
[r]
FIGURE 4 | (A) Correlation between pairwise geographic Euclidean distances and pairwise resistance differences, for 21 European Paramecium caudatum strains inoculated with the
Mercury(II) trace detection by a gold nanoparticle-modified glassy carbon electrode using square-wave anodic stripping voltammetry including a chloride desorption step... Open
Access and use of this website and the material on it are subject to the Terms and Conditions set forth at Evaluation and qualification of diffusion braze repair techniques for
Since particle mass can be neglected in the case of ultrafine aggregates, resuspension of micrometric agglomerates can be studied by analyzing the influence of
The coupling of an electrochemical process with a biological treatment for the degradation of methylene blue (MB) and basic yellow 28 (BY28) considered separately or in
Herein, we report on a simple approach for the synthesis of glass-like carbon thin films at room temperature, which relies on the combination of two laser processes: pulsed
In the region of very sluggish (irreversible) electron transfer, i.e., in case the value of the dimensionless kinetic parameter is log(K) < -2, all the features
