Rapport final 2006
Projet
Caractéristiques des pompes
fonctionnant en turbines
Auteur et coauteurs Jorge Arpe, Jean Prénat, Michel Dubas, Hans-Peter Biner Institution mandatée Ecole d'ingénieurs de Genève, Haute école valaisanne
Adresse Rue de la Prairie 4, 1202 Genève, Route du Rawyl 47, 1950 Sion Téléphone, e-mail, site Internet 022 338 04 87, jean.prenat@hesge.ch, jorge.arpe@hesge.ch,
http://eig.unige.ch
027 606 88 38, michel.dubas@hevs.ch, www.hevs.ch N° projet / n° contrat OFEN 100400 / 150 497
Durée prévue du projet (de - à) 08.10.2003 – 31.12.2006 (avenant: le 30.11.2004) ABSTRACT
Thanks to the partnership between OFEN, Sulzer, EIG and HEVS important improvements for the determination of per-formance of pumps as turbines and for the use of small variable speed generators in small power plants have been done. The method proposed is based on the determination of a model which computes the total head losses in pump operation with the help of the pump geometry. Then, this model is applied to determine the characteristics in turbine operation. The pump model has been divided in elements connected in series and in parallel from the inlet to the exit of the pump. The calculation of hydraulic losses in each element (friction losses, bend losses, gradual expansion and contraction, sudden expansion or contraction) has been performed and the sum of those gives the total head losses through the pump.
For this project, 5 pump geometries have been used in order to verify the model. One belongs to the EIG and measure-ments have been performed to determine the geometry and the pump and turbine characteristics. The other 4 geometries and their characteristics have been provided by Sulzer Pumps.
As results, the model of losses allows a prediction of the head at the best efficiency point (BEP) in pump operation with a shift between 4 and 5 %.
In turbine operation, by comparing the turbine characteristics predicted and the experimental data, a shift from 2 to 5% is observed at the BEP.
A software programmed in Excel has been developed and it will be available for free use.
At the HEVS, a laboratory test rig has been built and is composed of a permanent magnet synchronous generator as well as a frequency converter developed at this institution. The test rig allows testing the control algorithms. The results show a good efficiency at part load operation. A paper concerning this generator has been published.
SYMBOLS
A
area, cross section 1qA
impeller inlet throat area (trapezoidal: A1q = a1 b1) 2qA
area between vanes at impeller outlet (trapezoidal: A2q = a2 b2) 3qA
diffuser inlet throat area (trapezoidal: A3q = a3 b3)a
distance between vanesb
width of vane 2b
impeller outlet widthc
absolute velocity uc
circumferential component of the velocity qc
3 average velocity in diffuser throatc
3q=
Q
Le/(Z
LeA
3q)
,
D d
diameter qd
3 equivalent diameter of volute throat bd
arithmetic average of diameters at impeller or diffuser e.g.d
1b=
0.5
(d
1+
d
1i)
; defined such that:A1
=
π
d
1bb
1m
d
geometric average of diameters at impeller or diffuser, e.g.)
(
5
.
0
12 12 1md
ad
id
=
+
e
vane thicknessg
acceleration due to gravity (g = 9,81 m/s2)H
headp
H
static pressure rise in impellerk
rotation of fluid in between impeller and casingL
lengthn
rotational speed (revolutions per minute) qn
specific speed (min-1, m3/s, m)p
static pressure *p
wet perimeter ambp
ambient pressure dP
power dissipationQ
flow rate, volumetric flow LaQ
flow rate through impeller:QLa
=
Q
+
Q
sp+
Q
E+
Q
h=
Q/
η
vLe
Q
flow rate through diffuser:Q
Le=
Q
+
Q
s3+
Q
EE
Q
flow rate through axial thrust balancing device hQ
flow rate through auxiliaries (mostly zero) spQ
leakage flow rate through impeller neck ring 3s
Q
leakage flow rate through inter-stage seal *,
*Q q
flow rate referred to flow rate at best efficiency point:q
*
=
Q/Q
optRe
Reynolds number. Channel:Re
=
cD
h/
ν
. Blade:Re
=
wL
/
ν
o
R
bend radiusr
radiusq
r
3 equivalent radius of volute throat areas
gap widtht
pitcht
=
π
d/Z
La(or Z
Le)
u
circumferential velocityu
=
π
d
n/60
w
relative velocityq
w
1 average velocity in impeller throat areaw
1q=
Q
La/(Z
LaA
1q)
La
Z
number of impeller blades LeZ
number of diffuser vanes (volute: number of cutwaters)α
angle between direction of circumferential and absolute velocityα
opening angle of a diffuserβ
angle between relative velocity vector and the negative direction of circum-ferential velocityH
∆
hydraulic losses 0δ
bend angleζ
loss coefficient volη
volumetric efficiencyθ
angle used for the law section of the spiral casingλ
angle between vanes and side disks (impeller or diffuser)ν
kinematic viscosityτ
vane blockage factorBEP
Best efficiency pointPAT
Pump as turbineSubscripts
0 bend
1 impeller blade leading edge (low pressure) 2 impeller blade trailing edge (high pressure) 3 diffuser vane leading edge or volute cutwater a,m,i outer, mean, inner streamline
B blade angle (impeller, diffuser, volute cutwater) d discharge nozzle
fr friction
GC gradual contraction GE gradual expansion hyd hydraulic
i element i of the volute La impeller
Le diffuser
m meridian component max maximum
min minimum
opt operation at maximum efficiency (BEP)
r radial
SC sudden contraction SE sudden expansion sp gap, leakage flow
Sp volute
th theoretical flow conditions (flow without losses) tot total pressure = static pressure + stagnation pressure u circumferential component
CONTENTS
1. INTRODUCTION ...6
2. STATE OF THE ART ...6
3. HYDRAULIC LOSSES IN HYDRAULIC MACHINES ...7
4. PUMP OPERATION ...8
4.1 Determination of characteristics in pump operation...9
4.1.1 Euler Head...9
4.1.2 Leakage flow losses ...10
4.2 Modeling of the complete pump ...12
4.2.1 Hydraulic losses through the runner...13
4.2.2 Hydraulic losses through the volute ...14
4.2.3 Total hydraulic losses ...15
4.3 Memento of head losses ...16
4.3.1 Friction losses (
∆
H
fr) ...164.3.2 Sudden contraction and expansion losses (
∆
H
SC,
∆
H
SE) ...184.3.3 Gradual expansion and gradual contraction losses (
∆
H
GE,∆
H
GC)...204.3.4 Changes of flow direction losses (
∆
H
bend)...234.4 Results in pump operation ...24
4.4.1 Pumps used...24
4.4.2 Volumetric efficiency...26
4.4.3 Prediction in pump operation...26
5. TURBINE OPERATION...29
5.1 Theoretical head ...29
5.2 Leakage flow losses...31
5.3 Model of the hydraulic losses...31
5.4 Prediction of the flow rate at the BEP ...33
5.5.Determination of the PAT efficiency...34
5.6 Results in turbine operation ...34
5.6.1 Volumetric efficiency...34
5.6.2 Theoretical turbine characteristic ...35
5.6.3 Prediction...38
6. EXPLOITATION DU MOTEUR SYNCHRONE EN VITESSE VARIABLE...41
7. CONCLUSIONS...43
7.1 Travaux publiés dans le cadre du projet ...43
7.2 Collaboration nationale ...43
Appendix ...45 A.1 The VBA Excel Macro...45
1. INTRODUCTION
In the hydraulic power generation, turbines are built to fit the hydraulic specifications of a site, es-pecially high power turbines. In the case of small sites which generate little power, a very interest-ing solution, if the efficiency is not primordial, is the use of centrifugal pumps as turbines (PAT). Indeed, a pump slightly modified is a good turbine which reaches a good efficiency. It is also a fact that serial pumps show an interesting cost reduction for a power generation site.
An important application of these pumps as turbines is the energy recovery in water supply sys-tems. If a reverse running pump is installed alongside an energy dissipating valve, most of the dissipated energy can be recovered [15]. Some sewage-treatment outfalls may also have potential for energy recovery using pumps as turbines. For example, a demonstration project built in 1993 in Nyon uses a pump as turbine to produce up to 210 kW electrical power from a sewage outfall [5].
Pumps manufacturers sell their machines with the hydraulic characteristics in pump mode, which have been obtained by experimental tests. Nevertheless they do not know the machine’s perform-ances in turbine mode (expensive tests). The main objective of this project is to predict the charac-teristics of the pump working as a turbine (without any experimental test) thanks to the pump char-acteristics and the pump geometry.
2. STATE OF THE ART
Several methods have been suggested for predicting the turbine performance based on the data for pump performance at best efficiency, but they produce widely varying results. None of these methods give an accurate prediction for all pumps; at most they just give a first estimate of the turbine performance.
Several authors have published papers on turbine performance prediction using the best efficiency values. In 1962, Childs [6] stated that the turbine best efficiency point and pump best efficiency for the same machines are approximately equal. Stepanoff [14] proposed that the head ratio and the flow rate ratio in turbine and pump operation are in inverse proportion to the pump efficiency square and to the pump efficiency, respectively. Alatorre-Frenk et al.[1] presented formulations based on fitting equations to a limited number of PAT data. Other relations were proposed by Engel [7] and Sharma [13].
Several other authors have published equations that relate the head and flow ratios for pump and turbine operation to the pump or turbine specific speed, see for instance Buse [2], Lewinsky [11] and Grover [8].
Burton et al. [3] have studied the prediction of pumps as turbines using the ratio method, which is a tool for designing centrifugal pumps, whereby the best operating point is determined by the in-teraction of impeller and volute characteristics. The general equations for impeller and volute characteristics in turbine mode are derived, and they are used to obtain the best operating point.
Rodrigues et al. [12] studied the prediction of a pump as a turbine with CFD and found deviations within 5% to 10% for most of the analyzed parameters (total head, hydraulic torque, hydraulic effi-ciency).
3. HYDRAULIC LOSSES IN HYDRAULIC MACHINES
Figure 1 shows the types of hydraulic losses which intervene during the pump and turbine opera-tion of a classic centrifugal pump. The losses can be divided in three types:
1) A circulation loss in pump operation only, see Figure 1a, which is due to the finite number of blades and which causes a shift of the ideal Euler line.
2) Losses proportional to the flow rate
(
Q
2)
, see Figure 1b, which can be divided in friction losses when the flow passes through the impeller channels and the casing, and minor or local losses (abrupt changes of section, gradual changes of section, bend effect).3) Incidence or shock losses, see Figure 1c, which occur when there is a misalignment be-tween the direction of flow and the angle of the volute casing and the runner blade angles. This misalignment invokes a residual velocity vector which is the reason for decreasing ef-ficiencies of machines for flows other than the design flow. The BEP flow rate is located near the minimum of the shock losses.
Adding or subtracting all these losses, for turbine and pump respectively, to the ideal Euler line will lead to the actual performance curve.
The two first types of losses will be modeled. These will allow the prediction of the head of the BEP.
Figure 1: Types of hydraulic losses in a hydraulic turbo-machine [4]
4. PUMP OPERATION
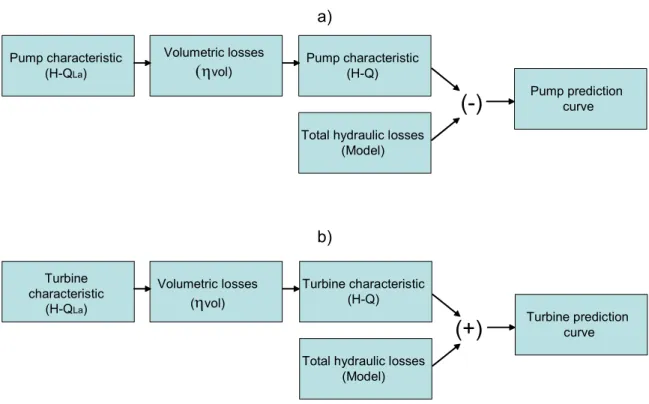
The diagram in Figure 2 shows the procedure followed in this project to determine the curve pre-dictions in pump and in turbine operation. These curves will be compared with experimental data to determine the deviation of head and flow rate for the BEP.
In summary, the starting point for the prediction is to determine the theoretical pump and turbine characteristics (H-QLa) with the help of the pump geometry. Then the loss model proposed is sub-tracted or added to the pump or turbine theoretical characteristics respectively to get the prediction curves.
Pump characteristic (H-QLa) Volumetric losses (ηvol) Pump characteristic (H-Q)
Total hydraulic losses (Model)
(-)
Pump prediction curveTurbine characteristic
(H-QLa)
Volumetric losses (ηvol)
Total hydraulic losses (Model)
(+)
Turbine prediction curvea)
b)
Turbine characteristic (H-Q)
Figure 2 a) Procedure for predicting the pump characteristics (H-Q), b) procedure for pre-dicting the turbine characteristics
4.1 DETERMINATION OF CHARACTERISTICS IN PUMP OPERATION
4.1.1 Euler Head
(H
−
Q
La)The fundamental equation for hydraulic machines, the Euler relation, is:
1 1 2 2 u u th
u
c
u
c
gH
=
−
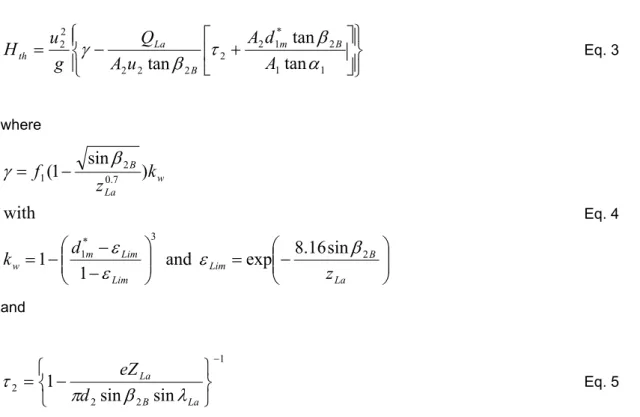
Eq. 1Under the assumption of a pump with an infinite number of vanes, the theoretical head is written as (for the details of formulas, see Gülich [9]):
+
−
=
∞ − 1 1 2 * 1 2 2 2 2 2 2tan
tan
1
tan
1
α
β
β
A
d
A
u
A
Q
g
u
H
m B B La th Eq. 2The influence of the finite number of vanes (circulation losses) and the vane blockage on the flow can be better represented by adding a factor called the slip factor
γ
and a blockage factorτ
2 at the pump exit (see Equations 4 and 5).
+
−
=
1 1 2 * 1 2 2 2 2 2 2 2tan
tan
tan
α
β
τ
β
γ
A
d
A
u
A
Q
g
u
H
m B B La th Eq. 3 where
−
=
−
−
−
=
−
=
La B Lim Lim Lim m w w La Bz
d
k
k
z
f
2 3 * 1 7 . 0 2 1sin
16
.
8
exp
and
1
1
with
)
sin
1
(
β
ε
ε
ε
β
γ
Eq. 4 and 1 2 2 2sin
sin
1
−
−
=
La B Lad
eZ
λ
β
π
τ
Eq. 5Note: if an axial flow at the inlet of the pump is assumed, i.e.
α
1=
π
/ 2
. The Equation 3 becomes:
−
=
B La thu
A
Q
g
u
H
2 2 2 2 2 2tan
β
τ
γ
Eq. 64.1.2 Leakage flow losses
The pressure difference
∆
H
spalong the gap for the inwards leakage is (see Figure 3):) 1 ( 2 22 2 2 2 2 d d g u k H Hsp = p − − sp ∆ Eq. 7 p
H
spH
∆
Figure 3: gap for the inwards leakage with
r
u
L
s
d
sd
y
y
k
n
H
H
u sp sp u sp sp q pν
2 2 2 2 2 3 . 0 087 . 0Re
,
Re
,
9
.
0
40
for
75
.
0
2=
=
=
<
=
Eq. 8k
(rotational factor) representing the rotation of fluid between impeller and casing.The relation giving the velocity through the gap taking account the number of labyrinths is:
i i i i k i si sp sp EA sp ax s L s s d d s L H g c + Σ + + ∆ = 2 2 2 2 2
λ
ζ
λ
ζ
Eq. 9In order to calculate the head loss coefficient
λ λ
=
(Re)
and then the axial velocityc
ax along the gap, a recursive method is applied as follows:2 2 2 ( ) ( ) ( ) 2 2 sp ax sp sp i EA k i si i i i g H c j L d s L j j s d s s ζ λ ζ λ ∆ = + + Σ + 2 Re scax ν =
(
)
2 0.31 log( 6.5 / Re) o A λ = + 0.375 2 Re ( 1) 1 0.19 Re u o j λ + =λ + ( 1) ax c j+(
1)
( )
ax axc
j
+ −
c
j
<
ε
initialλ
Not
Yes
finalλ
Figure 4: Loop to calculate the head loss coefficient and then the axial velocity through the gap
Where
λ
ois the loss coefficient for turbulent flow andλ
(
j
+
1)
is the loss coefficient taking into account the impeller rotation (fluid particle goes a longer distance).The flow rate
Q
sp through the gap is:ax sp
sp
d
sc
Q
=
π
Eq. 10Finally the pumping volumetric efficiency is:
sp La v
Q
Q
Q
Q
Q
+
=
=
η
Eq. 11The head
H
th shown in Eq. 6 is function ofQ
La, the flow rate flowing through the impeller. By taking into account the leakage losses calculated according to Eq. 10, the head can be written in function ofQ
, the flow rate through the machine, as:
−
=
B v thu
A
Q
g
u
H
2 2 2 2 2 2tan
/
β
η
τ
γ
Eq. 12All pump characteristics in this study will be represented in function of
Q
which is obtained thanks to the volumetric efficiencyη
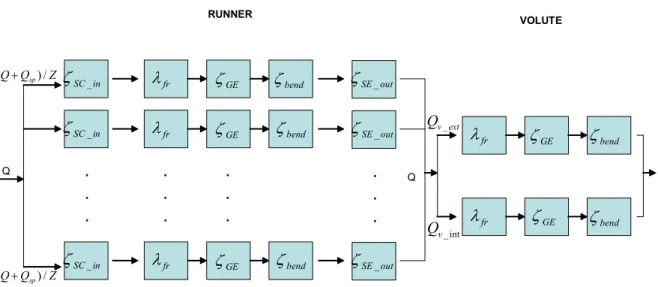
v.4.2 MODELING OF THE COMPLETE PUMP
The pump can be modeled as a set of elements or channels connected in series and parallel from its inlet to its exit.
Figure 5 shows a simplified scheme with the main hydraulic losses (friction and minor losses) in the impeller and in the volute in pump mode.
The assumptions for the pump model used are: constant static pressure around the inlet and outlet diameter of the runner (
d
1andd
2) and uniform pressure through sectionD
d (discharge nozzle). These assumptions are at least true near to the best operating point.These assumptions imply the same energy losses through each runner channel and through each volute channel (if pump with double volute).
Then, the runner is modeled as a set of channels in parallel representing the lines of head losses according to the number of vanes. The volute is also modeled in 2 parallel lines (if double volute).
Thus the total head losses are obtained by the sum of head losses through only one runner chan-nel and through only one volute chanchan-nel.
.
.
.
.
.
.
.
.
.
Q in SC _ζ
in SC _ζ
in SC _ζ
frλ
frλ
frλ
GEζ
GEζ
GEζ
bendζ
.
.
.
out SE _ζ
Q int _ v Q ext v Q_ frλ
frλ
GEζ
ζ
bend bendζ
VOLUTE RUNNER Z Q Q sp)/ ( + bendζ
bendζ
out SE _ζ
out SE _ζ
GEζ
Z Q Q sp)/ ( +Figure 5: scheme for the model of the hydraulic losses in a pump
Losses through the pump channels are obtained with the help of relations well known for friction and minor losses. The channels and sections of the pump have been decomposed in simple ele-ments in order to be able to use the Idel’cik [10] relations.
4.2.1 Hydraulic losses through the runner
According to the principle of superposition of losses, every channel in the runner is submitted to 3 types of losses: friction losses
∆
H
fr, bend losses∆
H
bend and gradual expansion losses in pump mode∆
H
GE or gradual contraction losses in turbine mode∆
H
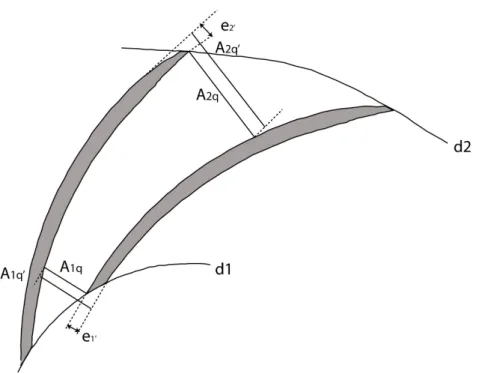
GC.Figure 6 shows a representation of one runner channel in which an average path of length
L
m has been determined with the help of balls following the channel form. The curve angle of the path is0
δ
and the radiusR
0. To see the determination of those parameters refer to Figures 31, 33, 35, 37 in Appendix.An important parameter to calculate the losses is the hydraulic diameter
D
H defined as:*
4
p
A
D
H=
Eq. 13Since the hydraulic diameter varies along the vanes, a weighted average is used for the calcula-tion
4
2
2 1 H H H HEQD
D
D
D
=
+
+
Eq. 14 where HD
is the hydraulic diameter at midpoint.Figure 6: Representation for the modeling of a runner channel
4.2.2 Hydraulic losses through the volute
The volute is divided into elements according to the volute angle
θ
i (0<θ
i<360°) which starts at the cutwater atθ
1= 0
°
(Figure 7). The diffuser part at the volute outlet can also be divided into several elements.As was done for the runner, friction losses, bend losses and gradual expansion or contraction losses for each element can be added and a total head loss in the volute determined.
In the case of a double volute there are two cutwaters. Thus the volute is divided into two chan-nels. Each channel can be divided into elements in which losses can be determined.
For each element of the volute, the hydraulic diameter can be determined with the help of cross sections of the volute and with the wet perimeters (see also Figures 32, 34, 36, 38 in Appendix). The path length and the radius curve for each element help to determine losses according to sec-tion 5.3.
To determine the distribution of the flow rate through each channel of the double volute, two lines where the total head loss in each “leg” is identical (Eq. 19) are considered (Figure 7).
_ _
r InnerLeg r OuterLeg
gH
=
gH
Eq. 15and the coefficients
K
characterizing the losses which are function ofQ
2 are:_ 2 r OuterLeg outer outer
H
K
Q
=
, _ 2 r InnerLeg inner InnerH
K
Q
=
Eq. 16The function relative to
Q
innerto minimize and obey the Eq. 15 is:(
)
2 2(
)
inner inner inner outer inner
f Q
=
K
Q
+
K
Q
−
Q
Eq. 17In order to attain same head losses in each leg, iterations are performed while the flow through the two legs is altered (respecting the law of continuity
Q
tot=
Q
inner+
Q
outer).Using Taylor’s method to calculate the flow rate across the inner leg
Q
inner, which minimizes Eq. 17, it becomes: _360
(
)
(
1)
( )
'(
)
inner inner init inner inner inner innerQ
Q
f Q
Q
i
Q
i
f Q
θ
=
+ =
−
Eq. 18The calculation stops after the convergence condition
f Q
(
inner)
<
ε
is reached.4.2.3 Total hydraulic losses
∑
∆
+
∆
+
∆
+
∆
+
∆
+
∆
=
∆
n i volute SC SE GC GE fr runner SC SE GC GE fr Loss TotalH
H
H
H
H
H
H
_(
/ /)
(
/ /)
Eq. 19 where n is the number of elements in which the volute has been divided.Figure 7: Division of the volute into elements according to the angular position
4.3 MEMENTO OF HEAD LOSSES
4.3.1 Friction losses (
∆
H
fr)
The head friction loss in a pipe is:
g
c
D
L
H
H fr2
2λ
=
∆
Eq. 20with the friction factor
λ
calculated as: 2 10)
Re
5
.
6
135
.
0
(
log
3086
.
0
∗
∆
+
=
λ
Colebrook’s formula Eq. 21and the relative roughness coefficient
∆
= (∆
/
D
H).In order to calculate the friction losses in the spiral parts of the volute which are not closed tubes, we considered them as flat plates and a dissipation coefficient on a flat plate is used:
2 10
0.13
6.5
log
0.135
Re
fc
L
ε
=
+
∆
Eq. 22Because this open part of spiral has been divided in several elements placed one after the other, it can be considered as a serial circuit in which the total loss coefficient can be defined as:
2 2
2 2
1 2 3
1 2 3
..
ref ref ref ref
sp i i
A
A
A
A
A
A
A
A
ζ
=
ζ
+
ζ
+
ζ
+ = Σ
ζ
Eq. 23where
A
ref is a reference section andA
i is the cross section of the element i. In the double volute the reference sections are the throat areas near to the two cutwaters.The total loss head is:
2
2
sp sp refQ
gH
A
ζ
=
Eq. 24The power dissipation for one element of the spiral is:
3
2
d f
dP
=
c
ρ
c dA
withdA
=
dU dL
.
Eq. 25where
c
is the mean velocity in the element i and proportional to the flow rateQ
i varying through the spiral. The total head loss can be written:d sp
P
gH
Q
ρ
=
Eq. 26where
P
d is the total power dissipation.Using Eq. 23 to Eq. 26, the total head loss coefficient can be pointed out:
3
2
d sp ref refP
c A
ζ
ρ
=
Eq. 27Finally
gH
sp, the total head loss in the spiral part of the volute which is not closed, is determined with Eq. 24.4.3.2 Sudden contraction and expansion losses (
∆
H
SC,
∆
H
SE)
Sudden contraction and expansion losses occur at the inlet and at the exit of the runner channels in both pump and turbine modes.
The areas used to calculate these losses are those called throat area or blocked area
q q
A
Figure 8: Areas used to calculate the sudden expansion and contraction losses in the run-ner
Figure 9: Dimensions to calculate sudden expansion or contraction between the volute and the runner
The relations used to calculate the sudden contraction losses and the sudden expansion losses in pump mode are:
g
c
H
SC SC2
2ζ
=
∆
,g
c
H
SE SE2
2ζ
=
∆
Eq. 28The sudden contraction losses coefficient
ζ
SC and the sudden expansion losses coefficientζ
SE in pump mode are (see Idel’cik [10]):)
1
(
5
.
0
' 1 1 q q SCA
A
−
=
ζ
Eq. 29 2 ' 2 2 11
−
=
q q SEA
A
ζ
Eq. 30 2 ' 3 '' 2 21
−
=
q q SEA
A
ζ
Eq. 31 with: 1 1 1a
b
A
q=
1 ' 1 1 ' 1(
a
e
)
b
A
q=
+
2 2 2a
b
A
q=
2 ' 2 2 ' 2(
a
e
)
b
A
q=
+
Eq. 32 2 2 2 '' 2)
2
(
e
b
Z
r
A
La q=
−
π
3 2 2 ' 3)
2
(
e
b
Z
r
A
La q=
−
π
Note: The same relations are used also to calculate the sudden expansion and contraction losses in turbine mode, taking account of the flow direction.
4.3.3 Gradual expansion and gradual contraction losses (
∆
H
GE,∆
H
GC)
The volute has parts which behave as diffusers, for instance the discharge part at the volute outlet. In order to calculate the loss coefficient in a diffuser, experimental pressure recovery coefficient curves are used as shown in Figure 10.
2 2 1 2 1 2 2 2 1 1 1
1
2
2
r pp
p
c
gH
c
c
c
c
ρ
→
−
=
=
− +
Eq. 33and the head loss is: 2 2 1 1 1 2 2
1
1
2
r pc
A
H
c
g
A
→
=
−
−
Eq. 34The loss coefficient in a diffuser is:
2
1
1
D p Rc
A
ζ
= −
−
Eq. 35 where 2 1 RA
A
A
=
Eq. 36Figure 10: Experimental curves of the pressure recovery diffuser [16]
Gradual expansion losses occur through the runner channels and through the volute channels in pump mode.
Gradual contraction losses occur in the runner channels and in the volute channels in turbine mode.
The relations used to determine these losses are:
g
c
H
GE GE2
2ζ
=
∆
andg
c
H
GC GC2
2ζ
=
∆
Eq. 37The gradual expansion coefficient is determined as (see Idel’cik [10]):
2 25 . 1
)
1
(
)
2
(tan
2
.
3
out in GEA
A
−
=
α
ζ
for0
<
α
<
40
°
Eq. 38There are no empirical equations for the gradual contraction coefficient
ζ
GC but tables for different opening angles and section ratios can be found in the literature. In our study, these losses are not considered because of the small angles of contraction.A
inA
out 2 / αA
inA
out 2 / αGradual contraction
Gradual expansion
Figure 11: gradual expansion and contraction losses
4.3.4 Changes of flow direction losses (
∆
H
bend)
The losses due to the bend geometry occur in the runner and along the volute, for pump and tur-bine operation and are written as:
g
c
H
bend bend2
2ζ
=
∆
Eq. 39Figure 12: bend losses
The coefficient of bend losses is (see Idel’cik [10]):
1 1 1
B
C
A
bend=
ζ
Eq. 40where 7 3 5 2 2 1
1.6348.10
8.1581.10
1.714185.10
A
=
−δ
−
−δ
+
−δ
Eq. 41
>
≤
≤
=
1
for
21
.
0
1
0.5
for
21
.
0
5 . 2 1 H o H o H o H oD
R
D
R
D
R
D
R
B
Eq. 42 1C
depends on the ratio ofa
o/
b
o. For square and circular sections:C
1=
1
.4.4 RESULTS IN PUMP OPERATION
4.4.1 Pumps used
Five pump geometries have been used to test the model proposed. The main characteristics of these pumps are shown in Table 1.
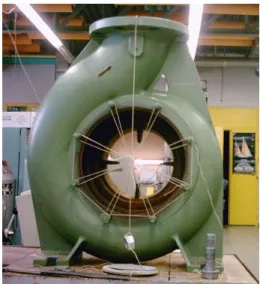
Pump No 1, a pump from Biral, belongs to the EIG. A test rig has been built in the hydraulic labo-ratory in order to measure the pump and turbine characteristics (head, efficiency and power out-put). Because the geometry of the Biral pump was not known, it has been dismounted and meas-urements of the runner and of the volute have been performed, see Figures 12a to 12c.
The plans of the four other geometries were provided by Sulzer with their respective measured characteristics as pumps and as turbines.
Pump No Specific speed (
n
q)1 (Pump from Biral, EIG) 40
2 Sulzer
19
3 Sulzer
28.7
4 Sulzer 26.7
5 Sulzer
31.6
Figure 12a): Test rig of PAT at the EIG (Biral pump) Figure 12b): Volute geometry measure-ments
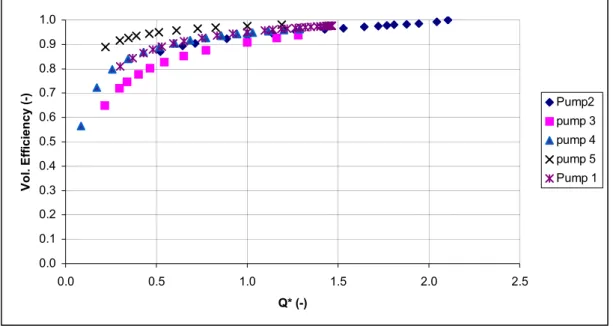
4.4.2 Volumetric efficiency
Figure 13 shows the results of the volumetric efficiency modeling for the four pumps according to the flow rate.
0.0 0.1 0.2 0.3 0.4 0.5 0.6 0.7 0.8 0.9 1.0 0.0 0.5 1.0 1.5 2.0 2.5 Q* (-) V o l. E ff ic ie n c y ( -) Pump2 pump 3 pump 4 pump 5 Pump 1
Figure 13: volumetric efficiency modeling
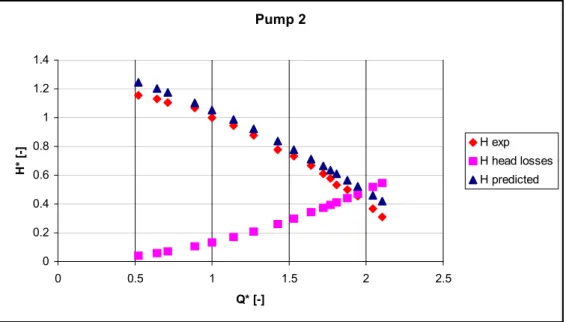
4.4.3 Prediction in pump operation
Figures 14 to 18 show the characteristics (H-Q) predicted in pump mode, the total head losses modeled (related to
Q
2) and the experimental pump curve provided by Sulzer.Table 2 shows the relative differences between the head predicted and the head measured at the BEP.
Pump H* predicted (-) Relative error (%)
No 1 1.035 3.5
No 2 1.048 4.8
No 3 1.048 4.8
No 4 1.063 6.3
No 5 0.983 -1.65
TABLE 2: Relative error between the prediction and the measurement
It is observed that the predicted pump characteristics curves fit the experimental data very well in the zone near to the BEP. Deviations from 1% to 5% between the predicted head and the head measured at BEP are obtained for the tested pumps.
No correction has been applied to the model of head losses to fit the experimental results. As con-clusion we can say that the model proposed can be used for the prediction in turbine operation following the same approach.
Pump 1 0 0.5 1 1.5 2 2.5 0 0.2 0.4 0.6 0.8 1 1.2 1.4 1.6 Q* [-] H * [-] H exp H head losses H predicted
Figure 14: Comparison between the measurements and the prediction in pump operation (pump 1) Pump 2 0 0.2 0.4 0.6 0.8 1 1.2 1.4 0 0.5 1 1.5 2 2.5 Q* [-] H * [-] H exp H head losses H predicted
Figure 15: Comparison between the measurements and the prediction in pump operation (pump 2)
Pump 3 0 0.2 0.4 0.6 0.8 1 1.2 1.4 1.6 0 0.2 0.4 0.6 0.8 1 1.2 1.4 Q* [-] H * [-] H exp H head losses H predicted
Figure 16: Comparison between the measurements and the prediction in pump operation (pump 3) Pump 4 0 0.2 0.4 0.6 0.8 1 1.2 1.4 1.6 0 0.2 0.4 0.6 0.8 1 1.2 1.4 Q* [-] H * [-] H exp H head losses H predicted
Figure 17: Comparison between the measurements and the prediction in pump operation (pump 4)
Pump 5 0 0.2 0.4 0.6 0.8 1 1.2 1.4 1.6 0 0.2 0.4 0.6 0.8 1 1.2 1.4 Q* [-] H * [-] H exp H head losses H predicted
Figure 18: Comparison between the measurements and the prediction in pump operation (pump 5)
5. TURBINE OPERATION
5.1 THEORETICAL HEAD
From the general equation of turbo machines, Eq.43 can be determined for a hydraulic turbine (more details in Gulich [9]).
2 1 1 1 1 2 2 2 1 1 2 2
tan
tan
u
c
u
c
u
c
u
c
u
gH
th=
u−
u=
m+
m−
β
α
Eq. 43 where: 2 2 2tan
m uc
c
α
=
Eq. 44The inflow angle
α
2 at turbine inlet can be determined from the casing geometry with the help of the blocked cross sectionA
q3, as follows (see also Figure 19).3 3 3
arcsin
t
a
B=
α
Eq. 45 3 3 3 qcos
B uc
c
=
α
and 3 3 q qA
Q
c
=
Eq. 46For a double volute,
A
q3 is obtained by the sum of the two blocked sections. Finally : 3 2 3 2 u uc
d
d
c
=
Eq. 47The flow angle
β
1 can be determined from the runner geometry at outlet:1 1 1 1
cos
tan
A
A
z
A q Laβ
β
=
Eq. 48 where 1 1 1 1arcsin
t
b
A
q A=
β
Eq. 49For the calculation of the geometrical parameters of the volute, a representation of the unfolded volute can be drawn (see Figure 19).
Figure 19: simple volute and double volute with their unfolded representations to determine
3B
α
5.2 LEAKAGE FLOW LOSSES
In turbine mode, Equations 7 to 10 can be used to calculate the flow leakages
Q
sp, taking into account that at this time the flow rate through the runnerQ
La is:sp La
Q
Q
Q
=
−
Eq. 50The volumetric efficiency in turbine operation is:
Q
Q
Q
Q
Q
La sp v−
=
=
η
Eq. 515.3 MODEL OF THE HYDRAULIC LOSSES
As done for pumps, the head losses in turbine operation are obtained with the help of the relations for friction and minor losses presented in Chapter 5. The channels and sections of the runner and of the casing have been decomposed into simple elements in order to be able to use the Idel’cik [10] relations.
Figure 20 shows the decomposition of the runner and of the casing. Following the flow direction in turbine operation, the casing is considered as two channels in parallel (double volute) and the runner is considered as channels in parallel according to the number of vanes.
.
.
.
.
.
.
.
.
.
Q out SE _ ζ out SE _ζ
out SE _ζ
fr λ fr λ fr λ GC ζ ζbend bend ζ bend ζ.
.
.
in SC _ ζ in SC _ζ
in SC _ζ
Q int _ vQ
ext vQ
_ fr λ fr λ GC ζ ζbend bendζ
SPIRAL CASING RUNNER.
.
.
GC ζ GC ζ GC ζ Z Q Q sp)/ ( − Z Q Q sp)/ ( −Figure 20: scheme for the model of the hydraulic losses in a turbine
The distribution of the flow rate between the channels of the volute in turbine operation depends on the resistance met by the flow, the flow distribution in turbine operation does not follow any law.
To determine the distribution of the flow in the casing (for a double volute) an energy balance be-tween the inlet of the casing and the outlet of the runner is performed. Considering that energy losses through each channel of the runner are the same and that the energy losses at the inter-face runner-casing are uniform (at least at the BEP), we reach the conclusion that the losses are the same in each channel of the volute.
Then, the assumption is (like in Eq. 15):
1 2 outer 1 2 r Inner r
gH
→=
gH
→ Eq. 52At the inner leg:
2 1 2 2 2 2 1 1 2 1 2 1
2
2
→ →+
+
=
+
+
=
Inner r Inner Inner Inner Inner r Inner InnergH
c
p
c
p
gH
gH
gH
ρ
ρ
Eq. 532 1 outer 2 2 2 2 1 1 2 1 2 1
2
2
→ →+
+
=
+
+
=
r Outer Outer Outer Outer r Outer OutergH
c
p
c
p
gH
gH
gH
ρ
ρ
Eq. 54The distribution condition of the flow rate through each channel is:
2 Inner Inner Outer Outer
Q
K
Q
K
=
Eq. 55where K is the total coefficient characterizing the total head losses function of
Q
2.5.4 PREDICTION OF THE FLOW RATE AT THE BEP
The prediction of the flow rate depends on the determination of the shock losses which appear off the BEP. The behaviour of these losses is bad known and very few researches have been done about that. That is why it has been decided to use a statistical method to determine the flow rate at the BEP. The Chapallaz method (the curve at Fig. 21) have shown a very good accurate at low specific speed.
5.5. DETERMINATION OF THE PAT EFFICIENCY
Once the flow rate at the BEP has been calculated, the determination of H with the help of the curve predicted (H-Q) is easy, then the global efficency can be calculated with equations 56 and 57.
BEP
globalBEP hyd vol mec
η
=
η
η η
Eq. 56 with BEP th hyd BEP BEPH
H
η
=
Eq. 57The volumetric efficiency
η
volwhich is almost constant for all flow rates is calculated by the macro Excel with the Equation 51. The mechanical efficiencyη
meccan be approximated by 0.98.5.6 RESULTS IN TURBINE OPERATION
5.6.1 Volumetric efficiency
Figure 22 shows the results of the volumetric efficiency modeling according to section 5.1.2. It is observed that the volumetric efficiencies vary between 0.9 and 1 and that the values are quite constant in function of the flow rate. The pump No5 has stepped gaps, which is the reason of lower flow leakages and thus higher volumetric efficiency.
Volumetric efficiency modeling results
0.0 0.1 0.2 0.3 0.4 0.5 0.6 0.7 0.8 0.9 1.0 0.00 0.20 0.40 0.60 0.80 1.00 1.20 1.40 1.60 Q* (-) V o l. e ff ic ie n c y ( -) pump 2 pump 3 pump 4 pump 5 Pump 1
5.6.2 Theoretical turbine characteristic
The theoretical head curves (
H
th) obtained with the relations of section 6.1 can be seen in Fig-ures 23 to 27. The results are consistent and the zone between the curves represents the losses depending onQ
2 plus the incidence losses which have not been modelised in this project.Turbine 1 0 0.5 1 1.5 2 2.5 0 0.2 0.4 0.6 0.8 1 1.2 1.4 1.6 Q* [-] H * [-] H th H exp
Turbine 2
0.0 0.5 1.0 1.5 2.0 2.5 0.0 0.2 0.4 0.6 0.8 1.0 1.2 1.4 1.6 Q* [-] H * [-] H exp H thFigure 24: Theoretical characteristic turbine Hth of pump 2 operating as turbine
Turbine 3
0.0 0.2 0.4 0.6 0.8 1.0 1.2 0.0 0.2 0.4 0.6 0.8 1.0 1.2 Q* [-] H * [-] H exp H thTurbine 4
0.0 0.2 0.4 0.6 0.8 1.0 1.2 1.4 1.6 1.8 0.0 0.2 0.4 0.6 0.8 1.0 1.2 1.4 1.6 Q* [-] H * [-] H exp H thFigure 26: Theoretical characteristic turbine Hth of pump 4 operating as turbine
Turbine 5
0.0 0.1 0.2 0.3 0.4 0.5 0.6 0.7 0.8 0.0 0.1 0.2 0.3 0.4 0.5 0.6 0.7 0.8 0.9 Q* [-] H * [-] H exp H th5.6.3 Prediction
Figures 28 to 32 show the experimental turbine characteristics, the predicted curves and the mod-eled hydraulic head losses of the pumps studied. Table 3 shows the relative errors between the prediction and the experimental data.
By applying the same model of head losses used for pumps, it was observed that head losses are overestimated in turbine mode (about 10%). In order to match the experimental and the prediction results, at least at the BEP, a factor, which would be applied for any pumps, can be used to de-crease the head losses values. With a value of 0.9 for this factor, the head predicted in turbine mode fit the experimental head curve at the BEP with deviations going from 0.4% to 4.6%.
Experimental results for pump No 5 are quite particular; indeed it was observed in the experimen-tal results for others pumps that flow rate at BEP in turbine mode is higher than the flow rate at BEP in pump mode (about 1.3 higher). The experimental results in turbine mode for that pump provided by Sulzer show a flow rate in turbine mode which is smaller than in pump mode. Figure 30 shows the trend of the experimental head curve and the trend of the predicted head. It is ob-served that the curves join very well at a point which corresponds to the BEP flow rate calculated by the Chapallaz method [4].
Turbine H* predicted (-) Relative error on H (%) Relative error on the efficiency (%) No 1 0.981 1.9 -1.5 No 2 1.004 0.37 2 No 3 1.045 4.5 1.3 No 4 1.0022 0.22 3 No 5 1.01 1 2.2
Turbine 1 0 0.5 1 1.5 2 2.5 0 0.5 1 1.5 2 Q*[-] H * [-] Head losses H predicted H exp
Figure 28: Modeled turbine characteristics and head losses for Pump 1
Turbine 2 0 0.5 1 1.5 2 2.5 0 0.2 0.4 0.6 0.8 1 1.2 1.4 1.6 Q* [-] H * [-] H exp H predicted Head losses
Turbine 3 0 0.2 0.4 0.6 0.8 1 1.2 0 0.2 0.4 0.6 0.8 1 1.2 Q* [-] H * [-] H exp H predicted Head losses
Figure 30: Modeled turbine characteristics and head losses for Pump 3
?
Turbine 4 0 0.2 0.4 0.6 0.8 1 1.2 1.4 1.6 1.8 0 0.2 0.4 0.6 0.8 1 1.2 1.4 1.6 Q* [-] H * [-] H exp H predicted Head lossesTurbine 5 0 0.2 0.4 0.6 0.8 1 1.2 0 0.2 0.4 0.6 0.8 1 1.2 Q* [-] H * [-] H exp H predicted Head losses
Figure 32: Modeled turbine characteristics and head losses for Pump 5
6. EXPLOITATION DU MOTEUR SYNCHRONE EN VITESSE
VA-RIABLE
A la Haute Ecole Valaisanne (HEVs), une installation de laboratoire a été réalisée; elle comprend une machine synchrone à aimants permanents et un convertisseur de fréquence développé à la HEVs. L’objectif des essais avec 2kW de puissance était de tester différents algorithmes de réglage du système à vitesse variable pour la partie onduleur/redresseur du côté réseau et du côté machine (voir Figure 33).
Figure 33 : Schéma bloc du système d’entraînement comprenant un convertisseur de fré-quence 4 quadrants et une machine synchrone à aimants permanents
Les algorithmes de régulation se basent sur la théorie du réglage vectoriel. Ils étaient implémentés dans un système à processeur de signal DSP. La régulation de vitesse s’effectue sans capteur de vitesse. La fréquence de commutation des transistors IGBT était choisie à 20kHz pour diminuer les dimensions du filtre du côté réseau. Le système montre un bon rendement en charge partielle (rendement maximal : onduleur 94%, machine 90%, voir Figure 34), avec courants sinusoïdaux et facteur de puissance 1.
Figure 34 : Diagramme du rendement en fonction du couple M [Nm] et de la vitesse angu-laire ω ω ω ω [rad/s]
7. CONCLUSIONS
Le modèle de pertes hydrauliques proposé pour la prédiction de la caractéristique de fonctionne-ment en turbine d’une pompe, a fourni des résultats très concluants.
Le modèle de pertes a tout d’abord permis de prédire la hauteur de refoulement en pompe au point de meilleur rendement avec une erreur de 4 à 5% par rapport aux mesures.
Le même modèle de pertes appliqué au fonctionnement en turbine nous permet de prédire la chute au point de meilleur rendement avec un écart de 2 à 5 %. Une légère surestimation des pertes hydrauliques en turbine (de l’ordre de 10%) a été trouvée. Ceci mène à introduire un fac-teur de correction qui est commun pour toutes les machines testées.
Un logiciel programmé sur une feuille EXCEL a été finalisé et elle accompagne ce rapport pour la mis à disposition pour libre utilisation des constructeurs de pompes et des utilisateurs.
Sulzer Pumps, partenaire du projet, est très satisfait des résultats obtenus. De même pour les Services Industriels de Genève qui vont appliquer le logiciel proposé pour qualifier les PATs qu’ils vont acquérir pour la récupération d’énergie dans le retour d’un circuit alimentant des utilisateurs de pompes à chaleur.
Par rapport à l’étude de la génératrice synchrone effectuée à l’HEVS, les résultats obtenus en 2004 ont été valorisés par la publication d’un article, voir référence ci-dessous. Rappelons que, à la suite d'un projet précédent, une pompe Sulzer fonctionnant en turbine à vitesse variable et utili-sant une électronique de puissance développée à Sion a été installée sur l'eau potable de la Ville de Sion en 1995. Grâce à la présente étude, l'électronique ainsi que les algorithmes de réglage ont pu être améliorés et adaptés aux derniers développements de l'électronique.
7.1 Travaux publiés dans le cadre du projet
Biner H.-P., Dubas M., Germanier A.: "Small variable speed power plant on a drinking water net-work", in Proc. European Conference on Power Electronics, Intelligent Motion and Power Quality PCIM, pp. 420-424, Nuremberg 2005.
Danssmann E. : Pompe fonctionnant en turbine. Détermination d’un modèle de pertes pour une pompe et validation pour le fonctionnement en turbine. Travail de diplôme 2004. Ecole d’ingénieurs de Genève.
7.2 Collaboration nationale
Les partenaires du projet sont:
- Sulzer Pumps à Winterthur : Philippe Dupont
- Ecole d'ingénieurs de Genève : Jean Prénat, Jorge Arpe - Haute Ecole Valaisanne : Michel Dubas, Hans-Peter Biner
8. REFERENCES
[1] Alatorre-Frenk, C. and Thomas, T. H. The pumps as turbines approach to small hydropower. World congress on renewable energy, September 1990.
[2[ Buse, F. Using centrifugal pumps as hydraulic turbines. Chemical Engineering, January 1981, pp 113-117.
[3] Burton J. D, Williams A.A. Performance prediction of pumps as turbines (PATs) using the area ratio method.
[4] Chapallaz Jean-Marc, Eichenberger Peter, Fischer Gerhard. Manual on pumps used as tur-bines. MHPG Series Harnessing Water Power On a Small Scale. Volume 11.
[5] Chenal, R., Vuillerat, C.A., Roduit, J. L’eau usée generatrice d’electricité. Projet DIANE 10, Federal Office of Energy, Berne, Switzerland, 1995.
[6] Childs, S. M. Convert pumps to turbines and recover HP. Hydrocarbon Processing and Petro-leum Refiner, October 1962, 41(10), 173-174.
[7] Engel, L. Die Rücklaufdrehzahlen der Kreiselpumpen. PhD. Thesis, Tech. Hochschule Braunschweig.
[8] Grover, K. M. Conversion of pumps to turbines. GSA Inter. Corp., Katonah, New York, 1980. [9] J.F. Gülich. Kreiselpumpen, Handbuch für Entwicklung, Anlagenplanung und Betrieb. 2nd
ed., Springer, Berlin 2004.
[10] Idel’cik I.E. Memento des pertes de charge. Eyrolles Paris, 1986. Collection du centre de recherches et d’essais de Chatou
[11] Lewinski-Kesslitz, H. P. Pumpen als Turbinen fur Kleinkraftwerke. Wasserwirtsschaft, 1987, 77(10), 531-537.
[12] Rodrigues A., Singh P., Williams A.A., Nestmann, F., Lai E. Hydraulic analysis of a pump as a turbine with CFD and experimental data. Internal report of the Nottingham Trent University. [13] Sharma, K. R. Small hydroelectric projects- use of centrifugal pumps as turbines. Kirloskar
Electric Co., Bangalore, India, 1985.
[14] Stepanoff, A. J. Centrifugal and axial flow pumps, Figs 13.1-3, pp. 270-271. John Wiley, New York, 1957.
[15] A. A. Williams, N. P. A. Smith, C. Bird and M. Howard. Pumps as turbines and induction mo-tors as generamo-tors for energy recovery in water supply systems. Journal of the Chartered In-stitution of Water and Environmental Management. 1998, 12 (3): 175-178.
[16] A. T. McDonald, R. W. Fox. An experimental investigation of incompressible flow in conical diffusers. Int. J. Mech. Sci. Pergamon Press Ltd 1966. Vol. 8, pp. 125-139.

![Figure 10: Experimental curves of the pressure recovery diffuser [16]](https://thumb-eu.123doks.com/thumbv2/123doknet/7776645.257772/23.892.253.628.142.560/figure-experimental-curves-pressure-recovery-diffuser.webp)
![Figure 16: Comparison between the measurements and the prediction in pump operation (pump 3) Pump 4 00.20.40.60.811.21.41.6 0 0.2 0.4 0.6 0.8 1 1.2 1.4 Q* [-]H* [-] H exp H head lossesH predicted](https://thumb-eu.123doks.com/thumbv2/123doknet/7776645.257772/29.892.162.732.145.468/figure-comparison-measurements-prediction-operation-pump-lossesh-predicted.webp)
