HAL Id: hal-00593742
https://hal.archives-ouvertes.fr/hal-00593742
Preprint submitted on 17 May 2011
HAL is a multi-disciplinary open access archive for the deposit and dissemination of sci-entific research documents, whether they are pub-lished or not. The documents may come from teaching and research institutions in France or abroad, or from public or private research centers.
L’archive ouverte pluridisciplinaire HAL, est destinée au dépôt et à la diffusion de documents scientifiques de niveau recherche, publiés ou non, émanant des établissements d’enseignement et de recherche français ou étrangers, des laboratoires publics ou privés.
Outsourcing ship management: Implications for the
logistics chain
Pierre Cariou, François-Charles Wolff
To cite this version:
Pierre Cariou, François-Charles Wolff. Outsourcing ship management: Implications for the logistics chain. 2011. �hal-00593742�
EA 4272
Outsourcing ship management:
Implications for the logistics chain
Pierre Cariou*
Francois-Charles Wolff **
2011/08
*Euromed Management and World Maritime University ** LEMNA - Université de Nantes et CNAV et INED - Paris
Laboratoire d’Economie et de Management Nantes-Atlantique
D
o
cu
m
en
t
d
e
T
ra
va
il
W
o
rk
in
g
P
ap
er
Outsourcing ship management: Implications for the logistics chain
Pierre Cariou
Euromed Management, Domaine de Luminy BP 921 - 13288 Marseille Cedex 9, France and World Maritime University, Citadellsvägen 29, S-201 24 Malmö, Sweden.
E-mail: [email protected] ; [email protected]
Francois-Charles WOLFF
LEMNA, University of Nantes, BP 52231 Chemin de la Censive du Tertre, 44322 Nantes Cedex 3, France; CNAV and INED, Paris, France.
E-mail: [email protected] www.sc-eco.univ-nantes.fr/~fcwolff
Abstract: The purpose of this paper is to contribute to a better understanding of the
probability that shipping companies outsource the management of vessels to ship management companies, a decision with many implications for the logistics chain. Data on 39,925 vessels are used to investigate to the extent to which 4,049 different ship-owners (each operating a fleet of at least two vessels) outsource to ship-management service providers. We rely on multinomial Logit random and fixed effects regressions to explain how the characteristics of the owners and vessels influence this decision. We find that the size of the firm in terms of the number of vessels and the number of different types of vessels influence the likelihood of outsourcing. Also, ship-owners frequently implement a mixed strategy and outsource only some of their vessels.
Outsourcing ship management: Implications for the logistics chain
Introduction
With 80% of the volume of international trade transported by sea and with an annual growth rate of 4% over the last twenty years (UNCTAD, 2009), the maritime transport industry plays a crucial role in international supply chains. As in many other industries (Hoffman 2006, 2007; Quinn, 2006; Marasco, 2008), the increase in business complexity when companies move into foreign markets and globalize their supply chains and material sources (Anderson et al., 2010; Patterson et al., 2010) has led many ship-owners to specialize in value-adding activities and to outsource some portion of their activities. This is particularly prevalent for activities related to ship management.
This decision strongly affects shippers and freight forwarders. When selecting a carrier, both actors have an interest in knowing whether shipping companies carrying their cargo are managing the vessels themselves or whether they outsource their management to professional ship managers. Indeed, such a decision is likely to impact the carrier’s flexibility, its ability to fulfill shippers’ expectations and the safety and security of the international logistics chain. Despite these consequences, few empirical studies have been conducted to improve our understanding of the degree of vessel management outsourcing to third parties and to study factors influencing decisions made by ship-owners.
In this paper, we perform an empirical analysis of this decision-making process using a unique dataset covering the world fleet. We study whether there are differences in outsourcing rates between various shipping sectors and the factors that explain the likelihood of outsourcing. We emphasize the role of covariates such as the size of a ship-owner’s fleet, country of domicile and vessel characteristics in our econometric analysis. We find that the outsourcing of vessels is common to all shipping sectors, but that certain owners turn to third-party managers more often than others. Owners also tend to outsource only part of their fleet, using outsourcing as a means of benchmarking.
The decision to use external companies for functions traditionally performed within a company can be explained by many reasons (Lieb, 1992; Silver, 2005; Tompkins, 2006; Hannon, 2007; Selviaridis et al., 2008; Lieb and Benz, 2004; Peters et al., 1998; Fugate et al., 2009) and has an effect on final customers (Araujo et al., 1999; Stank et al., 2003).
Outsourcing of a transport asset (Cruijssen et al., 2007) and in particular the management of a vessel is a common feature in international transport. Similarly, this decision is not neutral for shippers as this induces a loss of control for carriers, uncertainties about service levels and questions about the true costs of third party ship management companies (Gourdin, 2006), a decision shippers might not be aware of. The issue raised becomes clearer when marine incidents occur in dramatic circumstances. This was the case when the tanker Erika sunk in 1999. Months were required for investigators to identify the companies in charge of operations, months during which the shipper’s image (Total) deteriorated.
Even without the occurrence of such extreme cases, outsourcing of ship management by transport operators or by Non Vessel Operating Common Carriers (NVOCC) also has an effect on the safety and security of the logistics chain. For instance, the service provider no longer chooses the flag of registry or the classification society of the vessel, two components often seen as indicators of substandard shipping (Knapp, 2007; Cariou and Wolff, 2011). Based on such examples, we then consider that it matters for a shipper to know whether the carrier transporting its cargo is likely to outsource the management of the vessel. This leads to a generic distinction between the registered ship-owners and ship managers, the latter being responsible of the day-to-day running of the ships (Lloyd’s Register Fairplay, 2009).
Outsourcing ship management does not only affect the logistics chain negatively however. This decision is a common means for a shipping company to obtain a competitive advantage, an opportunity to focus on core skills and to access best-management practices and technologies developed by a third-party service provider (Gourdin, 2006; Parashkevova, 2007). Redundant costs are hence reduced, quality and reliability improved, and speed and flexibility increased (Selnes and Sallis, 2003; Panayides and So, 2005; Selviaridis et al., 2008).
All these benefits are well-acknowledged in the shipping sector. Outsourcing ship management is further expected to produce technical and operational economies of scale,
marketing advantages and bargaining power (Sletmo, 1989; Schulte, 1989; Richards, 1989; Ebsworth, 1989; King, 1997; Gunton, 1997; Willingale, 1998; Panayides, 2001; Panayides and Cullinane, 2002; King and Mitroussi, 2003). Interviews with the CEOs of the top-five professional ship management companies (Lloyd’s Ship Manager, 2008a, 2008b, 2009) highlight the shortage of seamen, which may give specialized ship managers a competitive edge over shipping companies by providing flexibility and access to skilled crews. However, such access comes at a substantial cost, estimated at between USD 100,000 and USD 175,000 per year, per vessel, in 2004 (Drewry Shipping Consultants, 2004), or 5% of a vessel’s annual operating costs (Justad, 2008).
According to previous studies, several firm-specific factors affect the likelihood of outsourcing. Mitroussi’s (2003, 2004a, 2004b) survey of Greek and UK-based ship-owners indicates that the ownership structure and age of a company play significant roles. Firms controlled by at least third-generation managers are more likely to outsource when internationalizing their activities. In addition, the firm’s country of domicile appears to be paramount. For instance, UK ship-owners, with an outsourcing rate of about 70%, outsource more frequently than owners from other countries. Conversely, outsourcing is seldom chosen by Indonesian (9.2%), Russian (19.2%) or Greek (24.5%) ship-owners (Cariou and Wolff, 2010). Panayides and Cullinane (2002) found a higher likelihood of outsourcing for container vessels operated by large firms in need of flexibility. In contrast, Drewry Shipping Consultants (2004), and Cariou and Wolff (2010) found that professional ship managers are more often involved in the tanker and offshore markets. Finally, small and large companies outsource approximately 16% of their vessels (Mitroussi, 2004b), with similar proportions explained by needs for expertise or flexibility, respectively (Cariou and Wolff, 2010).
In summary, many factors play a role in operational partnerships between ship-owners and managers, these partnerships having an impact on logistics chain organization. However, no comprehensive econometric analysis has been carried out to study which factors influence a shipowner’s decision to outsource the management of all or some vessels or how a company’s fleet structure influences that decision.
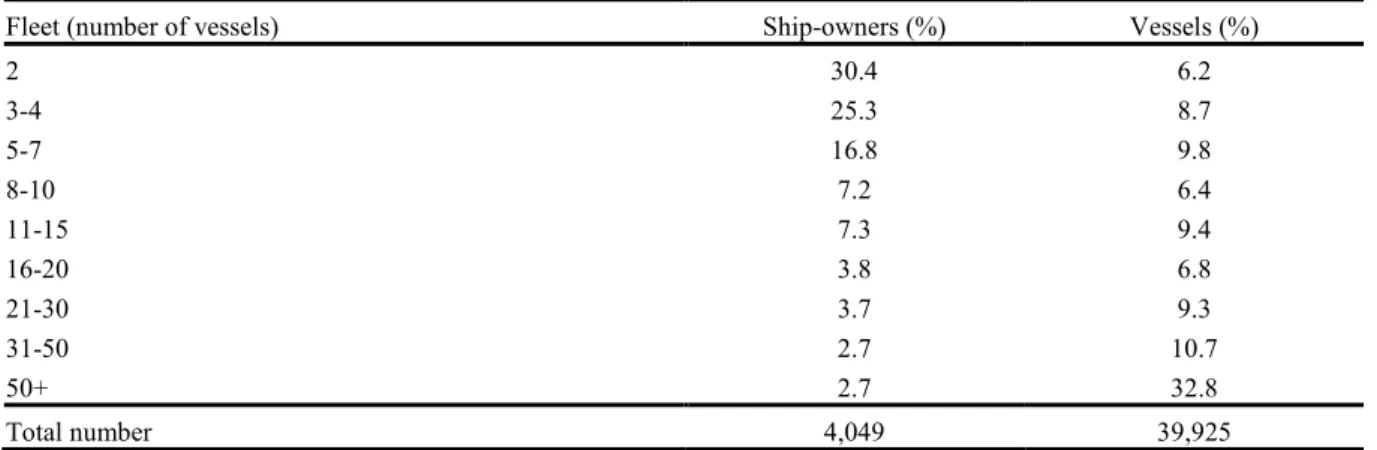
In this paper, we analyze the likelihood of a ship-owner outsourcing the management of a vessel using an initial database of 110,384 vessels. The data is gathered from Lloyd’s Register Fairplay (June 2009). We then limit the sample to vessels of more than 1,000 gross tons for which both the names of the owner and the manager are known, which reduces the sample to 39,925 merchant vessels. In order to include an analysis of differing outsourcing levels (ranging from outsourcing of all vessels to the outsourcing no vessels), we then limit the sample to ship-owners operating at least two vessels. This leaves us with a sample of 4,049 owners of 39,925 vessels. The dataset includes information on each vessel’s size in terms of gross tonnage, as well as data on each vessel’s type, age and flag of registry (Table 1).
Insert Table 1 here
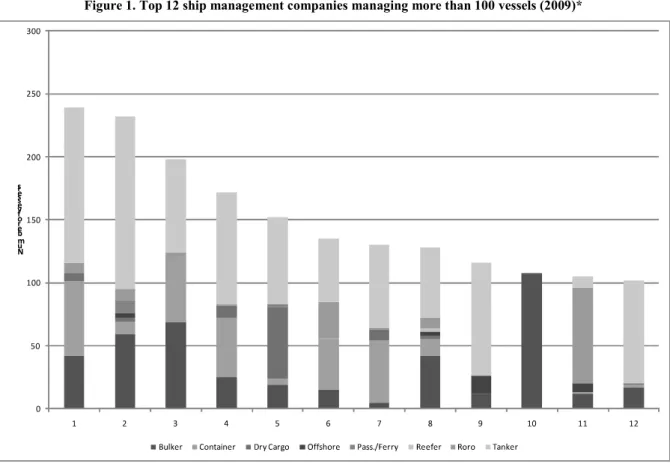
The largest ship management companies in 2009 are shown in Figure 1. Data on the firms’ holdings was aggregated using Drewry Shipping Consultants’ data (2004, p. 9) as well as the members’ list provided by Intermanager, the International Association of Ship Management Companies (http://www.intermanager.org/). Thirty percent of all vessels managed by professional ship managers are tankers. V Ships’ (#2 in Figure 1) main customer is CSL Group Inc., which accounts for 10.8% of vessels managed by V.Ships, while Schulte’s (#1) biggest customer is Schulte Group with 27.2%.
A careful examination of data shows that NYK Management (#6) and Cosco HK Shipping Co Ltd (#10) mainly work for one company, NYK Group (87% of vessels under management by NYK Management) and COSCO Group (100% of vessels under management by Cosco HK Shipping). This could place some limitations on our research, as a relationship might exist between the owner and the manager in these cases. Therefore, given the legal and operational complexities of company structures in shipping, our choice of identifying cases of outsourcing in which the owner’s name is different from the manager’s name increases the apparent outsourcing rate. These figures may, therefore, include situations in which ship-owners have outsourced to subsidiaries, making a direct comparison with former studies difficult.
Given these limitations, we define three configurations: i) the owner manages all vessels in-house (owner’s name = manager’s name for all vessels); ii) the owner outsources the
management of all vessels (owner a mixed strategy, in which only some
vessels are outsourced. Table 2 reports preliminary statistics on these mutually exclusive configurations.
Insert Table 2 here
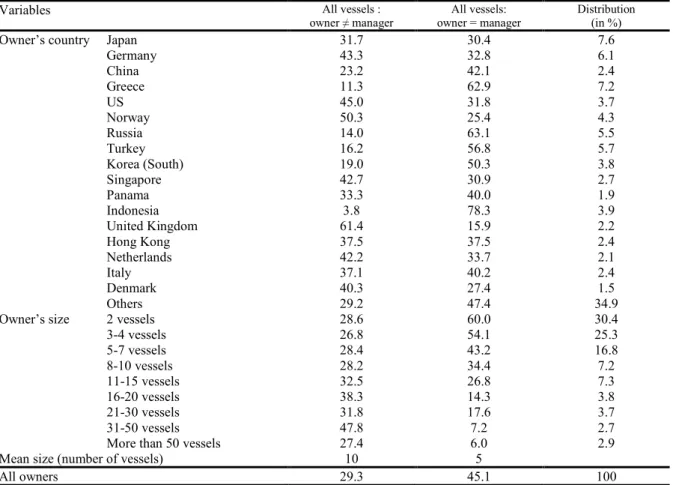
Of the 4,049 owners, 45.1% manage all vessels in-house, 29.3% outsource the management of all vessels and 25.5% have a mixed-management strategy. Owners registered in the UK or in Norway outsource more often, while Indonesian, Russian or Greek owners outsource less often. There are indications of a size effect, as 60% of owners with two vessels manage all vessels in house, while the corresponding figure is only 6% for firms with more than 50 vessels. Finally, a mixed strategy is common among ship-owners with a mean fleet size of 18 vessels, while in-house management is common among ship-owners with a mean fleet size of 5.
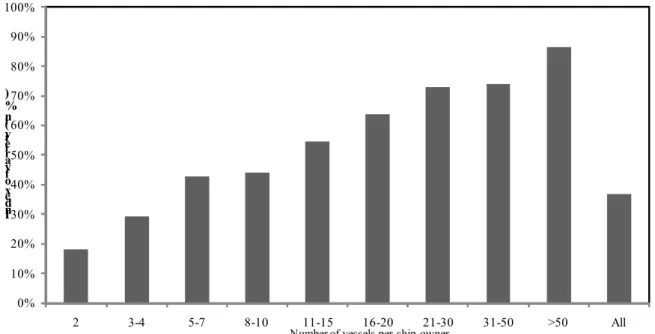
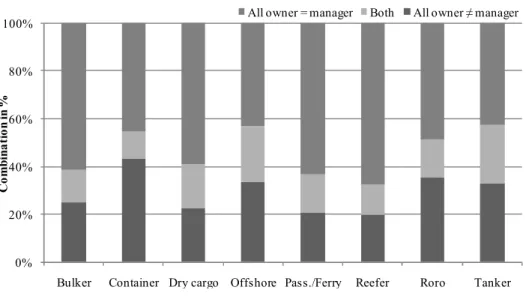
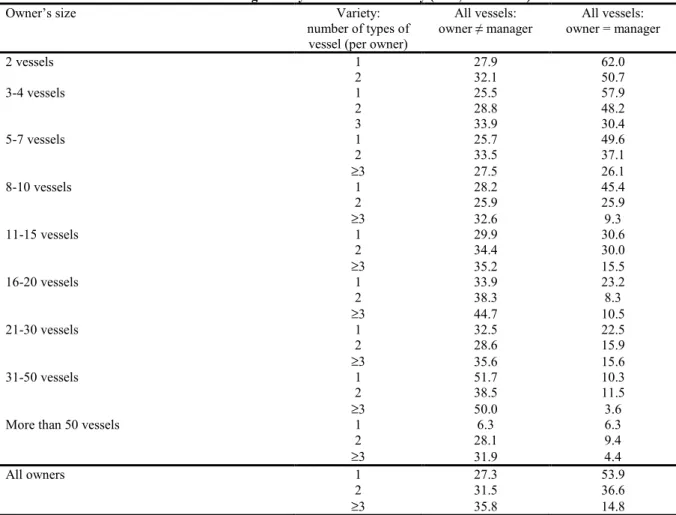
We also consider the variety of the vessel fleet in terms of three configurations: i) only one type of vessel in an owner’s fleet (variety =1), ii) two types of vessels in an owner’s fleet (variety =2) or iii) more than two types of vessels in an owner’s fleet (variety 3). Figure 2 shows that variety increases with the size of ship-owner. Approximately 90% of owners with more than 50 vessels have at least two different types of vessel in their fleets, compared to 18% for owners with only two vessels. Fifty three percent of owners with vessels of one type keep vessel management in-house (Table 3), while the corresponding figure is 14.8% for owners with three or more types of vessels.
Insert Figure 2 here Insert Table 3 here
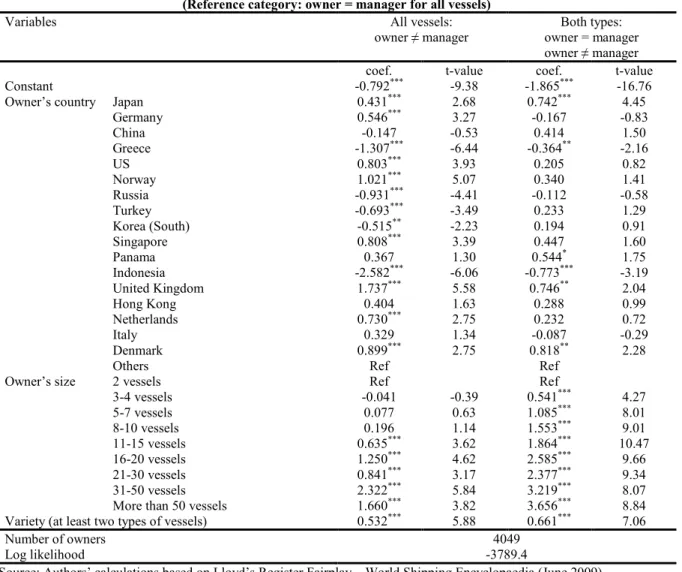
Figure 3 provides further insights into the various configurations. When a fleet has only one type of ship (Figure 3A), in-house management is the preferred option. This is most prevalent when the vessels are bulkers, dry cargo ships, passenger ships/ferries or reefers. When the
fleet is composed of two (3B), or three or more (3C) distinct types, mixed strategies are more likely.
Insert Figure 3 here
Econometric analysis of the outsourcing decision
To identify the factors that influence the ship-owner’s decision to outsource, we rely on a Logit multinomial model. Let j 1 when all vessels are managed in-house, j 2 when the management of all vessels is outsourced and j 3 when the mixed strategy is chosen. For each of these random alternatives, the owner’s utility is Uj X j j, with X representing a set of control factors, j representing the associate vector of coefficients for j ( j 1,2,3), and j representing a random perturbation. The probability of an owner choosing an alternative j is Pr j Pr(Uj Uk,Uj Ul), with k,l j.
Assuming that stochastic utilities, independently and identically distributed with extreme value distribution apply, the corresponding model is a multinomial Logit model (MNL) with
the probability of choosing j equal to 3
1 / ; Pr i X X j i e e X
j . The choice is only
dependent on utility differences because Pr j Pr(Uj Uk 0,Uj Ul 0) . Thus, identification is achieved by normalizing the utility of an alternative to zero, with all vessels managed in-house serving as the reference category.
Insert Table 4 here
MNL estimates (Table 4) show that the owner’s country of domicile is a significant covariate. Ship-owners registered in Denmark, the UK and Japan choose to outsource more often, while Indonesian and Greek ship-owners are less likely to do so. Furthermore, UK, Norwegian and US ship-owners are more likely to implement a mixed strategy. Size influences outsourcing decisions when the fleet consists of more than 10 vessels. The pattern is different for companies adopting a mixed strategy – in those situations, outsourcing continuously increases with size. Finally, the choice of a mixed strategy is 93% higher for companies with variety.
To measure the influence of vessel characteristics, we use the sample at the vessel level (39,925 vessels). As the focus is on inequalities, we first estimate the probability of a vessel having the same owner and manager, denoted by Pr(SAMEji), where SAME is a dummy ji
variable equal to 1 when vessel i is owned and managed by the same company j, and 0 otherwise. This probability can be expressed as:
) 0 Pr( ) 1 Pr(SAMEji Xj Zji uj ji (1)
where Xj andZ represent sets of characteristics for the owner and the vessel, respectively. ji
and are vectors of coefficients to be estimated, u is an owner-specific unobserved j
heterogeneity term and ji is a residual term. These perturbations are assumed to be normally distributed such that uj ~N(0; u2) and it ~N(0;1) . The corresponding model, with estimates in column 1 of Table 5, is thus a random effect Probit model estimated by quadrature techniques (Butler and Moffitt, 1982).
Insert Table 5 here
Outsourcing is influenced by vessel and owner characteristics. The probability of having a vessel managed in-house decreases with vessel age, although it begins to increase again when a vessel is more than 35 years old (+11.6 points of probability). One possible explanation of this phenomenon is that older vessels bring in lower earnings, which might not be sufficient to cover the outsourcing costs. The probability is higher when the vessels are reefers (+13.4 points), but lower when they are tankers (-12.7 points) and offshore vessels (-16.0 points). In-house management is more likely for large vessels and when the owner is domiciled in Indonesia, Greece, South Korea or Turkey (in contrast to the UK, Norway, the US or Denmark). Fleet size has a positive effect when the fleet comprises more than ten vessels. This effect peaks when the fleet numbers 31-50 vessels. Finally, variety matters since the probability of in-house management is reduced by 34.3 points for fleets with at least two types of vessels.
One shortcoming pertaining to the random-effects specification is that the unobserved owner-specific component u is, by definition, uncorrelated with covariates j Xj and Z . This ji
assumption is relaxed with a fixed-effects framework that uses the conditional likelihood approach described in Chamberlain (1980). Two specific features must be considered. First, this specification explains the choice of managing only certain vessels in-house, meaning that owners with all vessels managed in-house or all vessels outsourced are not considered. Second, invariant owner characteristics are captured by the owner fixed effect and are not included in the regressions. The results are reported in column 2 of Table 5 for 19,485 vessels belonging to 1,034 different owners in 2009.
Coefficients from the fixed effect Logit and random effect Probit regressions are fairly similar. Mixed strategies often mean that management is kept in-house for vessels less than five years old and for vessels that are more than 35 years old. Larger vessels (those with a size of more than 50,000gt), reefers and roros are generally managed in-house, in contrast to dry cargo ships, offshore vessels and tanker vessels. The fixed effects specification, therefore, confirms that a vessel’s characteristics influence the probability of having a vessel outsourced, which in turn explains why variety produces an impact.
Discussion and concluding comments
The aim of this research was to investigate vessel management outsourcing patterns and to study the factors explaining differences in outsourcing rates. We rely on an econometric analysis of a large dataset covering the world fleet in 2009, with a focus on the roles played by the owner and vessel characteristics. Our findings confirm that although vessel management outsourcing is a feature of the shipping industry, only certain types of owners outsource and owners only outsource the management of some vessels with specific characteristics.
The owner’s size is a key factor in decisions to outsource, especially when the owner’s fleet encompasses more than 10 vessels. When owners have less than ten vessels, variety governs the decision. With respect to previous studies (Mitroussi, 2004a, 2004b), our estimates suggest that size combined with variety creates the highest likelihood of outsourcing. An owner with many similar vessels will outsource only some of these vessels in order to
benchmark its own management performance and to attain greater flexibility. Conversely, an owner with a small number of vessels, even if they are of different types, may not have all of the necessary knowledge available in-house.
Finally, our paper provides insights into a specific configuration called the “mixed strategy”. This type of configuration is relevant as, regardless of country, 17% to 40% of owners have implemented such a configuration. Our findings stress that this strategy often leads to the in-house management of young and old vessels, and of reefer and roro vessels. It also leads to the outsourcing of middle-aged, dry cargo ships, offshore vessels and tanker vessels.
These empirical findings on diversity in outsourcing rates across maritime sectors highlight many open questions. Many of them have been discussed in previous research on partnership drivers and facilitators (Lambert et al., 2004), on types of operational partnerships within the transportation industry and their evolution over time (Cruijssen et al., 2007; Fugate et al., 2009), and on the need for customized partnerships (Lambert et al., 1999). Further investigations into these issues would require an in-depth analysis of the ownership structure of shipping companies with a classification system that makes a clear distinction between vessels outsourced to third-party professional managers and vessels outsourced to ship management companies with “shareholding ties” to the owning companies (Mitroussi, 2003).
Lastly, it raises questions on the transparency of supply chains relying heavily on shipping and for which supply chains safety and security are two hot issues. For shippers, the increasing trend of ship management outsourcing multiplies the number of stakeholders and raises questions on which carrier shippers should select. This article clearly contributes to this debate by shedding light on the complexity of the outsourcing decision-making process.
References
Anderson, E., Coltman, T., Devinney, T. and Keating, B. (2010) “What drives the choice of third party logistics provider?” Social Science Research Network. Retrieved (September 2010) at http://papers.ssrn.com/sol3/papers.cfm?abstract_id=1277184
Araujo, L., Dubois, A. and Gadde, L-E. (1999), “Managing interfaces with suppliers”,
Industrial Marketing Management, Vol. 28, pp. 497-506.
Butler, L.S. and Moffitt, R. (1982), “A computationally efficient quadrature procedure for the one factor multinomial Probit model”, Econometrica, Vol. 50, pp. 761-764.
Cariou, P. and Wolff F-C. (2010), “Understanding the choice by ship-owners of third-party managers”, mimeo, World Maritime University.
Cariou, P. and Wolff F-C. (2011), “Do Port State Control inspections influence flag- and class-hopping phenomena in shipping?”, Journal of Transport Economics and Policy 45, Part 2, May, pp. 155-177.
Chamberlain, G. (1980), “Analysis of covariance with qualitative data”, Review of Economic
Studies, Vol. 47, pp. 225-238.
Cruijssen, F., Dullaert, W. and Fleuren, H. (2007), “Horizontal cooperation in transport and logistics: A literature review”, Transportation Journal, Summer, pp. 22-39.
Drewry Shipping Consultants, (2004), Ship management, Drewry Shipping Consultants Publication.
Ebsworth, R. (1989), “In-house ship managers. Do they have a future as Independents? International Ship Management: Profit or Loss from Shipping’s Revival”, Lloyd’s Ship
Manager and Shipping News International Conference. London: Lloyd’s of London Press.
Fugate, B., David-Sramek B. and Goldsby, T.J. (2009), “Operational collaboration between shippers and carriers in the transportation industry”, The International Journal of Logistics
Management, Vol. 20 No. 3, pp. 425-447.
Gourdin, K.N. (2006), Global logistics management. A competitive advantage for the 21st
century, Second Edition, Blackwell Publishing.
Gunton, P. (1997), “Ship management”, Lloyd’s Nautical Yearbook 1996. London: LLP, pp. 25-35.
Hannon, D. (2007), “Choose wisely: Not all third-party logistics are the same”, Purchasing, Vol. 14, pp. 35-36.
Hoffman, W. (2006), “3PLs maturing fast”, Traffic World 27 (November), pp. 9-12. Hoffman, W. (2007), “3PLs reach record revenue”, Traffic World 23 (April), pp. 18-19. Justad, A.M. (2008), “Taking delivery: how to achieve lasting value from outsourcing”, Eitzen Maritime Services ASA, Lloyd’s List 18th Annual International Ship Management Conference, Cyprus, October.
King, J. (1997), “Globalisation of logistics management: present status and prospects”,
Maritime Policy and Management, Vol. 24, No. 4, pp. 381–387.
King, J. and Mitroussi, K. (2003), “Third Party Ship Management: A Greek Perspective”,
Knapp, S. (2007). The econometrics of maritime safety - Recommendation to enhance safety
at sea. Doctoral Thesis, Erasmus University, Rotterdam.
Lambert, D.M., Emmelhainz, M.A. and Gardner, J.T. (1999), “Building successful logistics partnerships”, Journal of Business Logistics, Vol. 20, No. 1, pp. 165-181.
Lambert, D.M., Knemeyer, A.M. and Gardner, J.T. (2004), “Supply chain partnerships: model validation and implementation, Journal of Business Logistics, Vol. 25, No. 2, pp. 21-42.
Lieb, R.C. (1992), “The use of third-party logistics services by large American manufacturers”, Journal of Business Logistics, Vol. 13, pp. 29-42.
Lieb, R.C. and Benz, B.A. (2004), “The use of third-party logistics services by large American manufacturers”, Transportation Journal, Vol. 43, pp. 1-7.
Lloyd’ Register Fairplay, (2009) World shipping encyclopedia.
Lloyd’s Ship Manager, (2008a), “Owners contribute to crew training”, Lloyd’s Shipping
Manager, June, pp. 27-30.
Lloyd’s Ship Manager, (2008b), “The manager’s challenges”, Lloyd’s Shipping Manager, April, pp. 29-33.
Lloyd’s Ship Manager, (2009), “Crew challenges remain despite the downturn”, Lloyd’s
Shipping Manager, March, pp. 4-6.
Marasco, A. (2008), “Third-party logistics: A literature review”, International Journal of
Productions Economics, Vol. 113, pp.127-147.
Mitroussi, K. (2003), “Third party ship management: the case of separation of ownership and management in shipping context”, Maritime Policy and Management, Vol. 30, No. 1, pp. 77-90.
Mitroussi, K. (2004a), “The ship owners' stance on third party ship management: an empirical study”, Maritime Policy and Management, Vol. 31 No. 1, pp. 31-45.
Mitroussi, K. (2004b), “The role of organisational characteristics of ship owning firms in the use of third party ship management”, Marine Policy, Vol. 28, No. 4, pp. 325-333.
Panayides, P.M. (2001), Professional Ship Management: Marketing and Strategy. Ashgate Publishing Ltd.
Panayides, P.M. and Cullinane, K.P.B. (2002), “The vertical disintegration of ship management: choice criteria for third party selection and evaluation”, Maritime Policy and
management, Vol. 29, No. 1, pp. 45-64.
Panayides, P.M. and So, M. (2005), “Logistics service providers-client relationships, relationships”, Transportation Research Part E, Vol. 41, pp. 179-200.
Parashkevova, L. (2007), “Logistics outsourcing – A means of assuring the competitive advantage for an organization”, Vadyba/Management, Vol. 2(15), pp. 29-38.
Patterson, Z., Ewing, G.O. and Haider, M. (2010), “How different is carrier for third party logistics companies?” Transportation Research Part E, doi:10.1016/j.tre.2010.01.005
Peters, M.J., Lieb, R.C. and Randall, H.L., (1998), “The use of third-party logistics services by European industry”, Transport Logistics, Vol. 1, pp. 167-179.
Richards, J. (1989), “Reducing ship investments risks. The ship manager’s role, International Ship Management: Profit or Loss from Shipping’s Revival”, Lloyd’s Ship Manager and
Shipping News International Conference. London: Lloyd’s of London Press.
Schulte, H. (1989), “Third party management moving forward and adapting to change,
Supplement to Lloyd’s Ship Manager and Shipping News International, March, 1.
Silver, O. (2005), “How 3PLs can help manage the increasing complexities of transportation”,
Canadian Transportation and Logistics, October, pp. 36-37.
Selnes, F. and Sallis, J. (2003), “Promoting relationship learning”, Journal of Marketing, Vol. 67, pp. 80-95.
Selviaridis, K., Spring, M., Projillidis, V., Botzoris, G. (2008), “Benefits, risks, selection criteria and success factors for third-party logistics services”, Maritime Economics and
Logistics, Vol. 10, pp. 380-392.
Sletmo, G. K. (1989), “Shipping’s Fourth Wave: Ship Management and Vernon’s trade cycles”, Maritime Policy and Management, Vol. 16, No. 4, pp. 293-303.
Stank, T., Goldsby, T., Vivkeree, S. and Savitskie, K. (2003), “Logistics service performance. Estimating its influence on market share”, Journal of Business Logistics, Vol. 24, pp. 27-55. Stopford, M. (2009), Maritime economics, 3rd Edition, Routledge.
Tompkins, J.A. (2006), “The business imperative of outsourcing”, Industrial Management, January/February, pp. 8-12.
UNCTAD, (2009), Review of Maritime Transport, United Nation, New York and Geneva. Willingale, M. (1998), Ship Management, Third Edition, Lloyd List Press.
Figure 1. Top 12 ship management companies managing more than 100 vessels (2009)*
* Reconstituted from the Lloyd’s Register Fairplay database.
1. Schulte (Schulte BSM Singapore; Schulte Shipmanagement-BER; Schulte Shipmanagement-CHR; Schulte
Shipmanagement-CYP; Schulte Shipmanagement-GRC; Schulte Shipmanagement-HKG; Schulte Shipmanagement-IND; Schulte Shipmanagement-IOM; Schulte Shipmangement-UK; Schulte-Hamburg 20095)
2. V Ships (V Ships Argentina; V Ships Asia Pte Ltd; V Ships Boston; V Ships Brasil SA; V Ships Canada Inc; V Ships
France SAS; V Ships Germany; V Ships Leisure SAM; V Ships Leisure UK Ltd; V Ships Ltd; V Ships Monaco SAM; V Ships Norway AS; V Ships Santos; V Ships Switzerland SA; V Ships UK Ltd; V Ships USA Inc; V Ships USA LLC).
3. Anglo-Eastern (Anglo-Eastern Antwerp NV; Anglo-Eastern Germany GmbH; Anglo-Eastern India; Anglo-Eastern
Montreal; Anglo-Eastern Ship Management; Anglo-Eastern Shipmgmt S Pte; Anglo-Eastern UK Ltd)
4. Tanker International (Euronav Ship Mgmt Hellas Ltd; Euronav Ship Mgmt SAS; Korea Line Corp; Norddeutsche
Reederei Schuldt; OSG Ship Management GR Ltd; OSG Ship Management Inc; OSG Ship Management UK Ltd; Oldendorff Carriers GmbH & Co; Oldendorff E; Oldendorff KE Ltd)
5. Jebsen Group (AJ Ship Management GmbH; Aboitiz Jebsen Bulk Transport; EMS Ship Management Denmark AS;
EMS Ship Management India; EMS Ship Management Singapore; Ems; Ems-Fracht; Jebsen Skipsrederi KG)
6. NYK Management (NYK Cruises Co Ltd; NYK LNG Shipmanagement Ltd; NYK LNG UK; NYK Shipmanagement Pte
Ltd)
7. Colombia (Columbia Shipmanagement Ltd; Columbia Shipmgmt Deutschland; Columbia Shipmgmt Singapore)
8. Fleet Management (Fleet Management Europe Ltd; Fleet Management India Pvt Ltd; Fleet Management Ltd-HKG; Fleet
Management Pvt Ltd; Fleet Ship Management Pte Ltd)
9. Thome (Thome Offshore Management; Thome Ship Management Pte Ltd) 10. Cosco HK Shipping Co. Ltd
11. Wilhelmsen (Wilhelmsen Marine Services AS; Wilhelmsen Ship Management AS; Wilhelmsen Ship Mgmt Korea Ltd;
Wilhelmsen Ship Mgmt Ltd-USA; Wilhelmsen Ship Mgmt Sdn Bhd; Wilhelmsen Ship Mgmt Singapore)
12. China shipping development
Figure 2. Variety and fleet size (2009) 0% 10% 20% 30% 40% 50% 60% 70% 80% 90% 100% 2 3-4 5-7 8-10 11-15 16-20 21-30 31-50 >50 All In d e x o f v a r ie ty ( in % )
Number of vessels per ship-owner
Source: Author’s calculation from Lloyd’s Register Fairplay – World Shipping Encyclopaedia (June 2009) Note: Our index of variety is defined as the probability of an owner having at least two different types of vessel.
Figure 3. Outsourcing level by type and variety of vessel A. One type of vessel in owner’s fleet
0% 20% 40% 60% 80% 100%
Bulker Container Dry cargo Offshore Pass./Ferry Reefer Roro Tanker
C o m b in a ti o n i n %
All owner = manager Both All owner manager
B. Two types of vessels in owner’s fleet
0% 20% 40% 60% 80% 100%
Bulker Container Dry cargo Offshore Pass./Ferry Reefer Roro Tanker
C o m b in a ti o n i n %
All owner = manager Both All owner manager
C. More than three types of vessels in owner’s fleet
0% 20% 40% 60% 80% 100% C o m b in a ti o n i n %
Table 1. Description of the sample
Fleet (number of vessels) Ship-owners (%) Vessels (%)
2 30.4 6.2 3-4 25.3 8.7 5-7 16.8 9.8 8-10 7.2 6.4 11-15 7.3 9.4 16-20 3.8 6.8 21-30 3.7 9.3 31-50 2.7 10.7 50+ 2.7 32.8 Total number 4,049 39,925
Table 2. Outsourcing level by owner (N=4,049)*
Variables All vessels :
owner manager
All vessels: owner = manager
Distribution (in %)
Owner’s country Japan 31.7 30.4 7.6
Germany 43.3 32.8 6.1 China 23.2 42.1 2.4 Greece 11.3 62.9 7.2 US 45.0 31.8 3.7 Norway 50.3 25.4 4.3 Russia 14.0 63.1 5.5 Turkey 16.2 56.8 5.7 Korea (South) 19.0 50.3 3.8 Singapore 42.7 30.9 2.7 Panama 33.3 40.0 1.9 Indonesia 3.8 78.3 3.9 United Kingdom 61.4 15.9 2.2 Hong Kong 37.5 37.5 2.4 Netherlands 42.2 33.7 2.1 Italy 37.1 40.2 2.4 Denmark 40.3 27.4 1.5 Others 29.2 47.4 34.9
Owner’s size 2 vessels 28.6 60.0 30.4
3-4 vessels 26.8 54.1 25.3 5-7 vessels 28.4 43.2 16.8 8-10 vessels 28.2 34.4 7.2 11-15 vessels 32.5 26.8 7.3 16-20 vessels 38.3 14.3 3.8 21-30 vessels 31.8 17.6 3.7 31-50 vessels 47.8 7.2 2.7
More than 50 vessels 27.4 6.0 2.9
Mean size (number of vessels) 10 5
All owners 29.3 45.1 100
* The row proportion for all vessels comprises the remainder, i.e., cases when only the management of some vessels is outsourced.
Table 3. Outsourcing level by fleet size and variety (N=4,049 owners)*
Owner’s size Variety:
number of types of vessel (per owner)
All vessels: owner manager All vessels: owner = manager 2 vessels 1 27.9 62.0 2 32.1 50.7 3-4 vessels 1 25.5 57.9 2 28.8 48.2 3 33.9 30.4 5-7 vessels 1 25.7 49.6 2 33.5 37.1 3 27.5 26.1 8-10 vessels 1 28.2 45.4 2 25.9 25.9 3 32.6 9.3 11-15 vessels 1 29.9 30.6 2 34.4 30.0 3 35.2 15.5 16-20 vessels 1 33.9 23.2 2 38.3 8.3 3 44.7 10.5 21-30 vessels 1 32.5 22.5 2 28.6 15.9 3 35.6 15.6 31-50 vessels 1 51.7 10.3 2 38.5 11.5 3 50.0 3.6
More than 50 vessels 1 6.3 6.3
2 28.1 9.4
3 31.9 4.4
All owners 1 27.3 53.9
2 31.5 36.6
3 35.8 14.8
* The row proportion for all vessels comprises the remainder, i.e., cases when only the management of some vessels is outsourced.
Table 4. Outsourcing MNL estimates (Reference category: owner = manager for all vessels)
Variables All vessels:
owner manager
Both types: owner = manager owner manager
coef. t-value coef. t-value
Constant -0.792*** -9.38 -1.865*** -16.76
Owner’s country Japan 0.431*** 2.68 0.742*** 4.45
Germany 0.546*** 3.27 -0.167 -0.83 China -0.147 -0.53 0.414 1.50 Greece -1.307*** -6.44 -0.364** -2.16 US 0.803*** 3.93 0.205 0.82 Norway 1.021*** 5.07 0.340 1.41 Russia -0.931*** -4.41 -0.112 -0.58 Turkey -0.693*** -3.49 0.233 1.29 Korea (South) -0.515** -2.23 0.194 0.91 Singapore 0.808*** 3.39 0.447 1.60 Panama 0.367 1.30 0.544* 1.75 Indonesia -2.582*** -6.06 -0.773*** -3.19 United Kingdom 1.737*** 5.58 0.746** 2.04 Hong Kong 0.404 1.63 0.288 0.99 Netherlands 0.730*** 2.75 0.232 0.72 Italy 0.329 1.34 -0.087 -0.29 Denmark 0.899*** 2.75 0.818** 2.28
Others Ref Ref
Owner’s size 2 vessels Ref Ref
3-4 vessels -0.041 -0.39 0.541*** 4.27 5-7 vessels 0.077 0.63 1.085*** 8.01 8-10 vessels 0.196 1.14 1.553*** 9.01 11-15 vessels 0.635*** 3.62 1.864*** 10.47 16-20 vessels 1.250*** 4.62 2.585*** 9.66 21-30 vessels 0.841*** 3.17 2.377*** 9.34 31-50 vessels 2.322*** 5.84 3.219*** 8.07
More than 50 vessels 1.660*** 3.82 3.656*** 8.84
Variety (at least two types of vessels) 0.532*** 5.88 0.661*** 7.06
Number of owners 4049
Log likelihood -3789.4
Source: Authors’ calculations based on Lloyd’s Register Fairplay – World Shipping Encyclopaedia (June 2009) Note: Estimates from an MNL logit model. Significance levels are 1% (***), 5% (**) and 10% (*).
Table 5. Estimates of the probability of a vessel having the same owner and manager
Variables (1) Random effects probit (2) Fixed effects logit
coef. t-value coef. t-value
Constant 1.626*** 11.07
Age 0-4 Ref Ref
5-9 -0.139*** -3.71 -0.188*** -2.85 10-14 -0.173*** -4.41 -0.230*** -3.28 15-19 -0.238*** -5.15 -0.355*** -4.31 20-24 -0.318*** -6.42 -0.531*** -5.95 25-29 -0.183*** -3.90 -0.290*** -3.38 30-34 -0.083 -1.51 -0.105 -1.04 35 and more 0.319*** 5.02 0.567*** 4.66
Size (gt) 1000-4999 Ref Ref
5000-9999 -0.036 -0.84 0.060 0.78
10000-24999 -0.073 -1.58 0.019 0.23
25000-49999 -0.104** -1.98 -0.047 -0.49
More than 50000 0.143** 2.51 0.427*** 4.13
Type of ship Bulker / combination Ref Ref
Container -0.011 -0.20 -0.017 -0.18 Dry cargo -0.128** -2.43 -0.249** -2.56 Offshore -0.543*** -6.22 -0.886*** -5.53 Pass./Ferry 0.153 1.60 0.163 0.86 Reefer 0.363*** 3.27 0.634*** 2.91 Roro 0.128* 1.86 0.262** 2.08 Tanker -0.397*** -8.27 -0.666*** -7.53
Owner’s country Japan -0.547** -2.33
Germany -0.835*** -3.15 China 0.159 0.44 Greece 1.860*** 8.51 US -1.457*** -4.68 Norway -1.712*** -6.43 Russia 1.151*** 4.79 Turkey 0.912*** 3.66 Korea (South) 0.928*** 3.23 Singapore -1.037*** -2.89 Panama -0.400 -0.87 Indonesia 2.859*** 9.08 United Kingdom -2.726*** -8.46 Hong Kong -0.530 -1.41 Netherlands -1.163*** -2.83 Italy -0.509 -1.20 Denmark -1.167*** -3.23 Others Ref
Owner’s size 2 vessels Ref
3-4 vessels 0.073 0.47 5-7 vessels -0.110 -0.61 8-10 vessels -0.281 -1.07 11-15 vessels -0.967*** -3.40 16-20 vessels -1.447*** -4.72 21-30 vessels -1.212*** -3.93 31-50 vessels -2.684*** -9.37
More than 50 vessels -1.508*** -5.70
Variety (more than 2 types in fleet) -0.969*** -7.21
Number of vessels 39925 19485
Number of owners 4049 1034
Log likelihood -12544.2 -6804.5
Source: Authors’ calculations based on Lloyd’s Register Fairplay – World Shipping Encyclopaedia (June 2009) Note: Estimates from random effect probit models. Significance levels are 1% (***), 5% (**) and 10% (*).