HAL Id: hal-02998293
https://hal.archives-ouvertes.fr/hal-02998293
Preprint submitted on 10 Nov 2020HAL is a multi-disciplinary open access
archive for the deposit and dissemination of sci-entific research documents, whether they are pub-lished or not. The documents may come from teaching and research institutions in France or abroad, or from public or private research centers.
L’archive ouverte pluridisciplinaire HAL, est destinée au dépôt et à la diffusion de documents scientifiques de niveau recherche, publiés ou non, émanant des établissements d’enseignement et de recherche français ou étrangers, des laboratoires publics ou privés.
unicellular algae
Xue Zhao, Achal Rastogi, Anne Deton Cabanillas, Ouardia Mohamed,
Catherine Cantrel, Berangère Lombard, Omer Murik, Auguste Genovesio,
Chris Bowler, Daniel Bouyer, et al.
To cite this version:
Xue Zhao, Achal Rastogi, Anne Deton Cabanillas, Ouardia Mohamed, Catherine Cantrel, et al.. H3K27me3 natural variation selectively marks genes predicted to be important for differentiation in unicellular algae. 2020. �hal-02998293�
1
H3K27me3 natural variation selectively marks genes predicted to be important for 1
differentiation in unicellular algae 2
3
Xue Zhao1,3, Achal Rastogi1†,Anne Flore Deton Cabanillas1, Ouardia Ait Mohamed1, Catherine
4
Cantrel1, Berangère Lombard2, Omer Murik1¥, Auguste Genovesio1, Chris Bowler1, Daniel 5
Bouyer1, Damarys Loew2, Xin Lin1§, Alaguraj Veluchamy4, Fabio Rocha Jimenez Vieira1 and 6
Leila Tirichine1,3* 7
8
1Institut de Biologie de l'ENS (IBENS), Département de biologie, École normale supérieure,
9
CNRS, INSERM, Université PSL, 75005 Paris, France 10
11
2Institut Curie, PSL Research University, Centre de Recherche, Laboratoire de Spectrométrie 12
de Masse Protéomique, 26 rue d’Ulm 75248 Cedex 05 Paris, France 13
3CNRS UMR6286, UFIP UFR Sciences et Techniques, Université de Nantes, 2 rue de la
14
Houssinière 44322, Nantes Cedex 03 15
4Laboratory of Chromatin Biochemistry, BESE Division Building 2, Level 3, Office B2-3327,
16
4700 King Abdullah University of Science and Technology (KAUST), Thuwal 23955-6900, 17
Kingdom of Saudi Arabia 18
†Present address: Corteva Agriscience, Madhapur, Hyderabad 500 081, Telangana, India
19 20
¥Present address: Medical Genetics Institute, Shaare Zedek Medical Center, Jerusalem, Israel
21 §
Present address: State Key Laboratory of Marine Environmental Science, Xiamen University 22 23 24 25 26 27
2
Abstract
28
In multicellular organisms H3K27me3 has been shown to be deposited by Polycomb Repressive 29
Complex 2 (PRC2) to establish and maintain gene silencing, critical for cell fate and 30
developmentally regulated processes. PRC2 complex is absent in both yeasts Saccharomyces 31
cerevisiae and Schizosaccharomyces pombe, which initially suggested that PRC2 arose with
32
the emergence of multicellularity. However, its discovery in several unicellular species 33
including microalgae questions its role in unicellular eukaryotes. Here, we show in the model 34
diatom Phaeodactylum tricornutum (Pt), using mutants in the homologue of the catalytic 35
subunit of PRC2, enhancer of zeste E(z), that Pt E(z) is responsible for di and tri-methylation 36
of lysine 27 of histone H3. H3K27me3 depletion abolishes cell morphology in Pt providing 37
evidence for a role of H3K27me3 in cell differentiation in unicellular species. Genome wide 38
profiling of H3K27me3 in fusiform and triradiate cells further revealed genes that may specify 39
cell identity. These results suggest a role for PRC2 and its associated histone mark in cell 40
differentiation in unicellular species and highlights their ancestral function in a broader 41
evolutionary context than is currently appreciated. 42
3
Introduction
43
Tri-methylation of lysine 27 of histone H3 (H3K27me3) is a mark deposited by Polycomb 44
Repressive Complex 2 (PRC2), which mediates silencing of gene expression during 45
differentiation and development in both animals and plants 1-3. PRC2 is comprised of four core 46
proteins, highly conserved among multicellular organisms: the histone methyltransferase 47
(HMTase) enhancer of zeste E(z), the WD40 domain containing polypeptide Extra Sex Comb 48
Esc, the C2H2 type zinc finger protein Suppressor of zeste 12 Su(z)12 and the Nucleosome
49
remodeling factor 55 kDa subunit Nurf-55 4,5. The absence of PRC2 in the unicellular yeast 50
models Saccharomyces cerevisiae and Schizosaccharomyces pombe initially led to suggestions 51
that it arose to regulate cell differentiation in multicellular organisms 6. This hypothesis has 52
recently been questioned because components of PRC2 and the associated mark H3K27me3 53
are found in several unicellular species that belong to different lineages including, but not only, 54
Stramenopiles, Alveolates and Rhizaria (SAR)7-9 (Supplementary Fig. 1a-d), thus questioning 55
the function of such a widespread complex in single celled organisms. 56
Attempts to understand the role of H3K27me3 in the unicellular green alga Chlamydomonas 57
reinhardtii were not conclusive because tri-methylation of lysine 27 could not be assessed
58
reliably due to its nominal mass which was found similar to acetylation of lysine 27 of the same 59
histone7. However, we have previously identified H3K27me3 by mass spectrometry and 60
mapped its localization genome-wide in the pennate diatom Phaeodactylum tricornutum9 (Pt),
61
which belongs to the stramenopile group of eukaryotes, only distantly related to the animal 62
(Opisthokonta) and plant (Archaeplastida) eukaryotic crown groups. Pt has different 63
morphotypes, fusiform (FM hereafter), which is the most prevailing morphology among the 64
sampled accessions known so far, triradiate (TM hereafter), oval (OM hereafter) and cruciform 65
(CM hereafter) 10-13 (Fig. 1a). Each morphotype can switch reversibly into a different 66
morphology in response to several growth and environmental cues10. FM is the most stable 67
morphotype while switching is more prominent in TM, CM and OM, which tend to convert to 68
FM in the growth conditions used in this study10,11. 69
Interestingly, western blot analysis using a monoclonal antibody against the mark in FM, TM, 70
CM and OM cells revealed a strong correlation between the complexity of the morphology 71
(branching of the cell) and the absolute quantity of H3K27me3, which is higher in both CM 72
and TM cells compared to FM and OM cells (Supplementary Fig. 1e), suggesting that PRC2 73
activity controls cell differentiation in P. tricornutum. Cell differentiation is often orchestrated 74
by H3K27me3-mediated silencing that underlies the establishment and maintenance of cellular 75
4
identity in multicellular model species 14. These results prompted us to investigate the putative
76
role of H3K27me3 in cell differentiation in a unicellular model. In silico annotation of 77
polycomb complex members and identification of H3K27me3 by mass spectrometry15 in a well-78
developed experimental model such as P. tricornutum (Supplementary Fig. 1a-c) might give 79
new insights for the unsolved questions in the study of PRC2 complex in multicellular species, 80
especially the availability of different morphotypes which is unique to P. tricornutum among 81
stramenopiles, present an opportunity to decipher its role in single celled organisms with respect 82
to its potential contribution to establish morphotype switches as well as its function in an 83
evolutionary context. 84
To gain insights into the function of E(z) and its associated H3K27me3 mark in Pt, we generated 85
two CRISPR/cas9 knockouts of the gene in each of the three morphotypes (FM, TM and CM) 86
leading to putative loss of function mutations including premature stop codon and frameshifts 87
(Fig. 1b). Light microscopy analysis of E(z) knockouts shows a change in cell morphology 88
which becomes shorter in the FM background. Both triradiate and cruciform morphologies were 89
abolished in TM and CM, respectively while transgenic lines carrying cas9 control vectors in 90
each morphotype remain unchanged (Fig. 1c). Whereas P. tricornutum transgenic lines with 91
the Cas9 control vector show similar H3K27me3 enrichment than the wild type (Supplementary 92
Fig. 2a). knockout of E(z) led to an overall depletion of H3K27me3 shown by western blot 93
using a monoclonal antibody against the mark (Fig. 1d), suggesting that the loss or diminution 94
of E(z) activity, and hence H3K27me3, causes the observed changes in cell morphology (Fig. 95
1c; Supplementary Fig. 2a; Table S1). Overall, this suggests that E(z) and its associated mark 96
are required for morphotype switch/to establish specific cell identity. 97
Mass spectrometry analysis of histones extracted from both wild type and E(z) knockout 98
confirmed the loss of H3K27me3 and revealed a depletion of di-methylation of H3K27, 99
corroborating the role of E(z) in di and tri-methylation of lysine 27 of histone H3 100
(Supplementary Fig. 2b,c,d). This is similar to fungi 16 and mammals17 but different from A.
101
thaliana where PRC2 loss of function leads to specific depletion of H3K27me318, although in
102
vitro assays with reconstituted A. thaliana PRC2 components showed mono, di and tri-103
methylation of lysine 27 of histone H319,20. Western blot analysis of E(z) knockout mutants 104
using a monoclonal antibody against H3K27me2 (Supplementary Fig. 2e) confirmed the 105
depletion of the mark from the mutants, supporting further the mass spectrometry analysis and 106
the role of E(z) in di-methylation of lysine 27 of histone H3 in P. tricornutum. 107
5
Similar to animals, plants and Neurospora crassa, H3K27me3 appears not to be essential for 108
cell survival in P. tricornutum, as indicated by the overall growth of E(z) knockout lines, which 109
are only slightly retarded compared to wild type lines (Supplementary Fig. 2f). 110
To further investigate the role of H3K27me3 and its targets in different morphotypes, we carried 111
out a genomic approach and performed Chromatin Immuno-Precipitation (ChIP) on two 112
biological replicates of TM morphotypes using an antibody against H3K27me3 followed by 113
DNA sequencing (ChIP-Seq) to generate a map of H3K27me3 distribution, which we compared 114
to the one previously generated in FM21. ChIP-Seq data analysis revealed a similar H3K27me3 115
enrichment profile between TM and FM that localizes principally on transposable elements 116
(TEs), with 58% and 60% of the reads overlapping with TE annotations for FM21 and TM, 117
respectively (Fig. 2a). The mark was found to occupy, on average, ~11.6% of the genome in 118
FM cells, targeting approximately 15% of genes (consistent with 15) and ~13.2% of the genome 119
within TM, targeting 19% of genes in agreement with the absolute amount of H3K27me3 to be 120
elevated in TM compared to FM as detected by western blot (Supplementary Fig. 1e). Indeed, 121
more genes are marked by H3K27me3 in TM than in FM (Fig. 2a, Supplementary Fig. 3a), 122
although most of the PRC2 targets are shared between both morphotypes (Fig. 2a) and exhibit 123
globally broad coverage over the annotation (Supplementary Fig. 3b). Among the PRC2 target 124
genes, 635 and 297 genes are found to be specifically marked by H3K27me3 in TM and FM, 125
respectively (Fig. 2a). We used ChIP followed by quantitative PCR (ChIP-qPCR) to validate 126
H3K27me3 enrichment over specifically marked loci in both backgrounds, which corroborated 127
the genome wide data for most of the tested genes (Fig. 2b, c). Common marked loci and 128
unmarked loci were tested as internal controls (Supplementary Fig. 3c). To test for the loss of 129
H3K27me3 in E(z) knockouts, we performed ChIP-qPCR in FM and TM as well as the 130
respective mutants, which confirmed the depletion of H3K27me3 in these mutants (Fig. 1e,f). 131
To gain insights into the functional categories enriched in H3K27me3 target genes that are 132
shared between the two morphotype or specific, we applied to the updated Phatr3 annotation a 133
gene ontology analysis using DAMA22 and CLADE23 which is a machine learning methodology 134
that uses pHMMs, positive score matrix and support vector machines to infer the corresponding 135
most probable GO category to genes. DAMA and Clade allow a more sensitive remote 136
homology that permits to assign to genes with no or poor domain conservation the 137
corresponding GO categories that would have been missed by other methods. Are considered 138
statistically significant, only GO classes that are represented by at least 3 standard deviations 139
above the average of observed entries. 140
6
Out of 1,640 H3K27me3 marked genes, 753 could not be assigned to a more specific GO 141
category and are therefore marked as unknown. The genes that are marked in both morphotypes 142
show top enrichment in RNA related biological processes such as RNA-dependent DNA 143
biosynthetic process, RNA phosphodiester bond hydrolysis and RNA-DNA hybrid 144
ribonuclease activity. Genes marked by H3K27me3 specifically in TM displayed top 145
enrichment exclusively in (1) glycoprotein biosynthetic processes involved in the transfer of 146
sugar moieties that might determine different sugar composition of the cell wall which is known 147
to be sugar rich in P. tricornutum24, (2) Peptidyl tyrosine dephosphorylation processes with 148
Ankyrin repeats proteins known to act as scaffold for connecting molecular interactions, likely 149
important for development of the numerous signaling pathways associated generally to more 150
complex multicellular organisms25 (Fig. 2d; Supplementary Table S2). Genes that are 151
specifically marked in FM cells exhibit enrichment in categories such as peptidyl-tyrosine 152
phosphorylation containing genes with central roles as modulators of cell differentiation and 153
cell fate decisions26 (Fig. 2d; Supplementary Table S2). Interestingly, additional genes 154
specifically marked in each FM or TM share categories with predicted functions in positive 155
regulation of (1) GTPase activity with a role in cell morphology changes, and neurite outgrowth 156
and guidance27 as well as the differentiation of many cell types, including neurons, T 157
lymphocytes and myocytes28; (2) protein ubiquitination shown to play a role in the complex
158
regulation of the levels and function of many proteins and signaling pathways involved in 159
determining cell fate29. Overall, the genes that are specifically marked in the TM or FM 160
morphotypes reflect processes related to cell growth, proliferation and differentiation. 161
We have reported previously that H3K27me3 marked genes in FM are characterized by low 162
expression15, consistent with the role of H3K27me3 as a repressive mark. Interestingly, when 163
genes are marked by H3K27me3 in both FM and TM, their expression is lower compared to 164
the genes that are uniquely marked in FM and to a lesser extent in TM (Fig. 3a,b). This suggests 165
that specifically marked genes are kept under less stringent and tight repression which might be 166
due to their putative role in morphotype switch, which is known to be a dynamic process10. 167
Considering the conserved role of H3K27me3 in repression, we tested the effect of E(z) 168
knockout on gene expression. Therefore, RNA sequencing (RNA-seq) of two biological 169
replicates of the E(z) mutant (Del6) was carried out and compared to previously generated 170
RNA-seq in the wild type (FM). Around 1/4 of all genes are (23%, 2795 out of 12152 171
annotations) differentially expressed in the E(z) mutant (P-value. < 0.05), (Supplementary Fig. 172
3d; Supplementary Table S2), indicating an essential role in gene regulation by PRC2 in Pt. 173
7
We further monitored by RT-qPCR the expression of 27 specifically marked genes in the E(z) 174
knockout of the TM and found that 18 genes out of 27 showed a gain of expression in the mutant 175
compared to the TM background, demonstrating further that depletion of H3K27me3 likely 176
releases the repression of target genes and correlates with the loss of the triradiate morphology 177
(Fig. 3c). Although the remaining genes showed no change or even a gain in expression, these 178
genes can be targets of other repressive or active marks as shown previously with co-occurrence 179
of several repressive marks over genic regions9. The analysis of the R value30 which reflects 180
the entropy, and therefore the variability in expression of genes between FM, TM and loci 181
marked in both morphotypes, showed a higher value in specifically marked genes compared to 182
commonly marked ones (Fig. 3d). This supports further the finding that specific enrichment in 183
each of the morphotypes are less silenced and potentially more dynamic compared to genes 184
marked by H3K27me3 in both TM and FM cells whereas commonly H3K27me3 marked genes 185
are globally silenced. 186
To substantiate the assumption that phenotypic plasticity and morphotype switch are regulated 187
by PRC2 in P. tricornutum, we took advantage of the lack of stability of the TM phenotype and 188
its tendency to switch to FM. Specifically, we used clonal cell samples with FM and TM 189
morphologies from the same genetic background (TM), which switches habitually to fusiform 190
and therefore contains a mixture of FM and TM cells. We reasoned that the activity of E(z) 191
should correlate with H3K27me3 levels in the following way: (1) a pure triradiate population 192
isolated from TM-N (named here TM-T1): highest level of H3K27me3), (2) a population of 193
cells from TM after N generations (N is 60 ± 5) of cell division containing a mixture of triradiate 194
and fusiform morphotypes (TM-N): medium level of H3K27me3) and (3) fusiform cells 195
isolated from the triradiate background TM (TM-Fusi): lowest level of H3K27me3 (Fig. 4a). 196
E(z) transcript levels show a clear decrease in TM-N and TM-Fusi compared to TM-T1 (Fig.
197
4b) which correlates with the switch from TM to FM, reflecting a lower activity of E(z) and 198
H3K27me3 levels. We then asked whether specifically H3K27me3-marked loci in TM lose the 199
mark upon cell switching to FM after multiple generations of sub-culturing leading to TM-N 200
and in transformed fusiform cells (TM-Fusi). As expected, ChIP-qPCR showed clearly a loss 201
of the mark in a population containing a mixture of fusiform and triradiate cells (TM-N) as well 202
as in TM-Fusi compared to TM-T1 (Fig. 4c,d), which contains only triradiate cells, thus 203
correlating the morphology with the level of enrichment in H3K27me3 over specific genes. 204
In summary, we have demonstrated in this study the role in P. tricornutum of E(z) as a histone 205
methyltransferase responsible for di and tri-methylation of lysine 27 of histone H3. Knockout 206
8
of E(z) causes H3K27me3 depletion and loss of triradiate cell shape maintenance, providing 207
evidence for the involvement of E(z) and its associated mark in establishing and/or maintaining 208
cell morphology in unicellular species. We showed the dynamic nature of the mark, depending 209
on the specific morphology between and within P. tricornutum accessions that correlate with 210
the level of H3K27me3 enrichment. We showed differential marking in two different 211
accessions of P. tricornutum, FM versus TM, which identified genes related to cell fate 212
decisions compared to commonly marked genes. This is the first evidence of the involvement 213
of H3K27me3 in cell differentiation in unicellular eukaryotes only distantly related to animals 214
and plants. Our study points to the emerging function of PRC2 and its H3K27me3 associated 215
mark as a determinant of the establishment and maintenance of cell morphology in single celled 216
species such as P. tricornutum that shows signs of differentiation of the cell into diverse 217
morphologies. This same function likely diversified with the emergence of multicellularity with 218
PRC2 orchestrating development in plants and animals. 219
220
Methods
221
Strains and growth conditions
222
Phaeodactylum tricornutum Bohlin Clone Pt1 8.6 (CCMP2561)(referred as FM) and Clone
223
Pt8Tc (referred as TM) cells were grown as described previously 31. 224
Isolation and immunoprecipitation of chromatin
225
Chromatin isolation and immunoprecipitation were performed as described previously 32. The 226
following antibodies were used for immunoprecipitation: H3K27me3 (07-449) from Millipore 227
and H3K27me3 from cell signaling technology. qPCR on recovered DNA was performed as 228
described previously 32 229
CRISPR/Cas9 plasmid construction
230
hCAS9n (Cas9 from Streptococcus pyogenes, adapted to human codon usage, fused to SV40 231
nuclear localization sequence, and containing a D10A mutation) was amplified from 232
pcDNA3.3-TOPO-hCAS9n (kindly received from Dr. Yonatan B. Tzur, Hebrew University of 233
Jerusalem), using the primers 5’-CAC CAT GGA CAA GAA GTA CTC-3’ and 5’- TCA CAC 234
CTT CCT CTT CTT CTT-3’. The PCR product was first cloned into pENTR using pENTR/D-235
TOPO cloning kit (ThermoFisher Scientific), and then sub-cloned into a PT pDest, containing 236
9
an N-terminal HA-tag 31, following the manufacturer’s protocol, which was named pDest-HA-237
hCAS9n. 238
For the sgRNA vector we first cloned the snRNA U6 promoter33 from P. tricornutum genomic 239
DNA using the primers 5’- AAA CGA CGG CCA GTG AAT TCT CGT TTC TGC TGT CAT 240
CAC C-3’ and 5’- TCT TTA ATT TCA GAA AAT TCC GAC TTT GAA GGT GTT TTT TG-241
3’. PU6::unc-119_sgRNA (kindly received from Dr. Yonatan B. Tzur) backbone was amplified 242
using the primers 5’-CAA AAA ACA CCT TCA AAG TCG GAA TTT TCT GAA ATT AAA 243
GA-3’ and 5’-GGT GAT GAC AGC AGA AAC GAG AAT TCA CTG GCC GTC GTT T-3’. 244
The two PCR products were used as template for a second round fusion PCR reaction as 245
described in 34. We further transformed the resulting product into E. coli, and extracted the 246
ligated plasmid. The terminator sequence of the P. tricornutum U6 was amplified using the 247
primers 5’-CATTCTAGAAGAACCGCTCACCCATGC-3’ and
5’-248
GTTAAGCTTGAAAAGTTCGTCGAGACCATG-3’, digested by XbaI/HindIII and ligated 249
into XbaI/HindIII digested pU6::unc-119. The resulting vector, ptU6::unc-119-sgRNA, was 250
used as template to replace the target sequence to E(Z) target by PCR using primers 251
32817TS12fwd GTG TCG GAG CCC GCC ATA CCG TTT TAG AGC TAG AAA TAG C 252
and 32817TS12rev GGT ATG GCG GGC TCC GAC ACC GAC TTT GAA GGT GTT TTT 253
TG. Target sequences were picked using PhytoCRISP-Ex 35. 254
Transformation of P. tricornutum cells and screening for mutants
255
Wild type cells of the reference strain FM and the TM were transformed with three plasmids 256
(pPhat1, Cas9 and guide RNA with the target sequence) as described previously 36. Positive 257
transformants were validated by triple PCR screen for pPhaT1 shble primers (ACT GCG 258
TGCACTTCGTGGC/TCGGTCAGTCCTGCTCCTC), sgRNA
259
(GAGCTGGAAATTGGTTGTC/GACTCGGTGCCACTTTTTCAAGTT) and CAS9n
260
(GGGAGCAGGCAGAAAACATT/TCACACCTTCCTCTTCTTCTT). For each colony, a 261
rapid DNA preparation was performed as described previously and fragment of 400 bp was 262
amplified with primers flanking the target sequence in the E(z) gene. The forward primer used 263
is 5'-TAAGATGGAGTATGCCGAAATTC-3' and reverse primer is 5'-264
AGGCATTTATTCGTGTCTGTTCG-3' PCR product was run in 1% agarose gel and a single 265
band was extracted using Machery Nagle kit and according to the manual manufacturer. PCR 266
product was sequenced using the primer 5'-AGCCACCCTGCGTTAACTGAAAAT-3'. 267
10
To make sure that the fusiform cells originating from the switch of TM are not contaminants 268
from the FM, each of the TM-T1, TM-Fusi and TM-N were checked for their genetic 269
background whether it is FM or TM using a molecular marker designed around a 400 bp 270
insertion in the FM background (Supplementary Fig. 4g), identified from genome sequencing 271
of FM and TM strains of P. tricornutum37. The PCR check confirmed that all the cell samples 272
described above are in the TM genetic background. 273
274
Validation of enrichment and expression of target genes
275
qPCR: Total RNA was extracted from TM and FM cells as described previously 31 and cDNA 276
was synthesized with cDNA high yield synthesis kit according to the manufacturer user manual. 277
Quantitative PCR was performed as described previously 31 using the primer list in 278
Supplementary Table S3 279
Proteomics and PRM Measurements
280
Three independent histone purifications recovered from FM wild type cells as well as E(z) 281
knockout mutant Del6 in FM genetic background were simultaneously separated by SDS-282
PAGE and stained with colloidal blue (LabSafe Gel Blue GBiosciences). Three gel slices were 283
excised for each purification and in-gel digested by using trypsin/LysC (Promega). Peptide 284
extracted from each set were pooled and analyzed by nanoLC-MS/MS using an Ultimate 3000 285
system (Thermo Scientific) coupled to a TripleTOFTM 6600 mass spectrometer (AB Sciex). 286
Peptides were first trapped onto a C18 column (75 μm inner diameter × 2 cm; nanoViper 287
Acclaim PepMapTM 100, Thermo Scientific) with buffer A (2/98 MeCN/H2O in 0.1%formic 288
acid) at a flow rate of 2.5 µL/min over 4 min. Separation was performed on a 50 cm x 75 µm 289
C18 column (nanoViper C18, 3 μm, 100Å, Acclaim PepMapTM RSLC, Thermo Scientific) 290
regulated to 50°C and with a linear gradient from 1% to 30% buffet B (100 MeCN in 0.085% 291
formic acid) at a flow rate of 400 nL/min over 90 min. The mass spectrometer was operated in 292
PRM top30 high sensitivity mode with 100 ms acquisition time for MS1 and MS2 scans 293
respectively with included precursor mass list for 600 sec (see Supplementary Table S4) 294
PRM Data Analysis
295
The PRM data were analyzed using Skyline version 3.7.0.11317 MacCoss Lab Software, 296
Seattle, WA; https://skyline.ms/project/home/software/Skyline/begin.view, fragment ions for 297
each targeted mass were extracted and peak areas were integrated. The peptide areas were log2 298
11
transformed and the mean log2- area was normalized by the mean area of peptide STDLLIR 299
using software R version 3.1.0. On each peptide a linear model was used to estimate the mean 300
fold change between the conditions, its 97.5% confidence interval and the p-value of the two 301
sided associated t-test. The p-values were adjusted with the Benjamini-Hochberg procedure38. 302
The mass spectrometry proteomics data have been deposited to the ProteomeXchange 303
Consortium via the PRIDE [1] partner repository with the dataset identifier PXD012347. 304
305
Western blot analysis: Chromatin was extracted from wild type as well as mutants of both TM
306
and FM cells and western blot performed as described previously 32. 307
308
Sequencing and computational data analysis
309
ChIP-Seq: Chromatin Immunoprecipitation (ChIP) was done with monoclonal cell cultures
310
grown using single triradiate cell from Pt8 population (referred as TM). CHIP-Seq was 311
performed as described previously 15,39. Two replicates were performed and showed a good 312
Pearson correlation (Supplementary Fig. 5). Raw reads were filtered and low quality read-pairs 313
were discarded using FASTQC with a read quality (Phred score) cutoff of 30. Using the genome 314
assembly published in 2008 as reference (Pt1 8.6), we performed reference-assisted mapping 315
of filtered reads using BOWTIE. We then performed the processing and filtering of the 316
alignments using SAMTOOLS and BEDTOOLS. SICER 40 was then used to identify
317
significant enriched H3K27me3 peaks by comparing it with the INPUT. Differential 318
H3K27me3 peak enrichment analysis between FM and TM backgrounds was also done using 319
SICER-df plugin. Peaks with Padj < 0.05 differential enrichment or depletion were considered 320
significant. Functional inferences were obtained by overlapping the differentially enriched 321
peaks over structural annotations from Phatr3 genome annotation41. 322
RNA sequencing (RNA-Seq): Total RNA was extracted from FM, TM, and FM Ez-KO (Del6)
323
cell lines. RNA expression and differential gene expression analysis was performed using 324
Eoulsan version 1.2.2 with default parameters 42. Genes having at least 2 folds expression 325
change with P-value < 0.05 were considered as significant different expressed genes (DEGs). 326
Whole genome sequencing (WGS): Whole genome sequencing was performed using DNA
327
extracted from monoclonal cell cultures grown using single triradiate cell taken from Pt8 and 328
Pt1 accession, referred to as Pt8tc and Pt1 8.6, respectively. At least 6 μg of genomic DNA 329
from each accession was used to construct a sequencing library following the manufacturer’s 330
12
instructions (Illumina Inc.). Paired-end sequencing libraries with a read size of 100 bp and an 331
insert size of approximately 400 bp were sequenced on an Illumina HiSeq 2000 sequencer at 332
Berry Genomics Company (China) and Fasteris for Pt1 8.6 and Pt8tc, respectively. Low quality 333
read-pairs were discarded using FASTQC with a read quality (Phred score) cutoff of 30. Using 334
the genome assembly published previously43, we performed reference-assisted assembly of all 335
the accessions. We used BOWTIE (-n 2 –X 400) for mapping the high quality NGS reads to 336
the reference genome followed by the processing and filtering of the alignments using 337
SAMTOOLS and BEDTOOLS. For estimating the genetic diversity between Pt1 8.6 and Pt8Tc 338
genome, GATK 44 configured for diploid genomes, was used for variant calling, which included 339
single nucleotide polymorphisms (SNPs), small insertions and deletions ranging between 1 and 340
300 base pairs (bp). The genotyping mode was kept default (genotyping mode = 341
DISCOVERY), Emission confidence threshold (-stand_emit_conf) was kept 10 and calling 342
confidence threshold (-stand_call_conf) was kept at 30. The minimum number of reads per base 343
to be called as a high quality SNP was kept at 4 (i.e., read-depth >=4x). SNPEFF was used to 344
annotate the functional nature of the polymorphisms. 345
GO enrichment analysis: GO categories were grouped by 3 different levels of expression
346
according to a simple density clustering algorithm (also confirmed by iterative k-means 347
clustering). 348
Data Availability:
349
All data are available through NCBI Sequence Read Archive with accession number 350 PRJNA565539. 351 352 References 353 354
1 Aldiri, I. & Vetter, M. L. PRC2 during vertebrate organogenesis: a complex in transition. Dev 355
Biol 367, 91-99, doi:10.1016/j.ydbio.2012.04.030 (2012).
356
2 Fragola, G. et al. Cell reprogramming requires silencing of a core subset of polycomb targets. 357
PLoS Genet 9, e1003292, doi:10.1371/journal.pgen.1003292 (2013).
358
3 Surface, L. E., Thornton, S. R. & Boyer, L. A. Polycomb group proteins set the stage for early 359
lineage commitment. Cell Stem Cell 7, 288-298, doi:10.1016/j.stem.2010.08.004 (2010). 360
4 Schwartz, Y. B. & Pirrotta, V. A new world of Polycombs: unexpected partnerships and 361
emerging functions. Nature reviews. Genetics 14, 853-864, doi:10.1038/nrg3603 (2013). 362
5 Martinez-Balbas, M. A., Tsukiyama, T., Gdula, D. & Wu, C. Drosophila NURF-55, a WD repeat 363
protein involved in histone metabolism. Proceedings of the National Academy of Sciences of 364
the United States of America 95, 132-137 (1998).
13
6 Kohler, C. & Villar, C. B. Programming of gene expression by Polycomb group proteins. Trends 366
Cell Biol 18, 236-243, doi:10.1016/j.tcb.2008.02.005 (2008).
367
7 Shaver, S., Casas-Mollano, J. A., Cerny, R. L. & Cerutti, H. Origin of the polycomb repressive 368
complex 2 and gene silencing by an E(z) homolog in the unicellular alga Chlamydomonas. 369
Epigenetics 5, 301-312 (2010).
370
8 Mikulski, P., Komarynets, O., Fachinelli, F., Weber, A. P. M. & Schubert, D. Characterization of 371
the Polycomb-Group Mark H3K27me3 in Unicellular Algae. Front Plant Sci 8, 607, 372
doi:10.3389/fpls.2017.00607 (2017). 373
9 Veluchamy, A. et al. An integrative analysis of post-translational histone modifications in the 374
marine diatom Phaeodactylum tricornutum. Genome biology 16, 102, doi:10.1186/s13059-375
015-0671-8 (2015). 376
10 De Martino, A. et al. Physiological and Molecular Evidence that Environmental Changes Elicit 377
Morphological Interconversion in the Model Diatom Phaeodactylum tricornutum. Protist 378
162, 462-481, doi:S1434-4610(11)00006-X [pii]
379
10.1016/j.protis.2011.02.002 (2011). 380
11 De Martino, A. M., A. Juan Shi, K.P. Bowler, C. Genetic and phenotypic characterization of 381
Phaeodactylum tricornutum (Bacillariophyceae) accessions. J. Phycol. 43, 992–1009 (2007). 382
12 He, L., Han, X. & Yu, Z. A rare Phaeodactylum tricornutum cruciform morphotype: culture 383
conditions, transformation and unique fatty acid characteristics. PloS one 9, e93922, 384
doi:10.1371/journal.pone.0093922 (2014). 385
13 Borowitzka, M. A., Volcani, B.E. The polymorphic diatom Phaeodactylum tricornutum: 386
Ultrastructure of its morphotypes. J. Phycolo. 14, 10-21 (1978). 387
14 Margueron, R. & Reinberg, D. The Polycomb complex PRC2 and its mark in life. Nature 469, 388
343-349, doi:10.1038/nature09784 (2011). 389
15 Veluchamy, A. et al. An integrative analysis of post-translational histone modifications in the 390
marine diatom Phaeodactylum tricornutum. Genome biology 16, 102, doi:10.1186/s13059-391
015-0671-8 (2015). 392
16 Jamieson, K., Rountree, M. R., Lewis, Z. A., Stajich, J. E. & Selker, E. U. Regional control of 393
histone H3 lysine 27 methylation in Neurospora. Proceedings of the National Academy of 394
Sciences of the United States of America 110, 6027-6032, doi:10.1073/pnas.1303750110
395
(2013). 396
17 Ferrari, K. J. et al. Polycomb-dependent H3K27me1 and H3K27me2 regulate active 397
transcription and enhancer fidelity. Molecular cell 53, 49-62, 398
doi:10.1016/j.molcel.2013.10.030 (2014). 399
18 Lafos, M. et al. Dynamic regulation of H3K27 trimethylation during Arabidopsis 400
differentiation. PLoS Genet 7, e1002040, doi:10.1371/journal.pgen.1002040 (2011). 401
19 Jacob, Y. et al. ATXR5 and ATXR6 are H3K27 monomethyltransferases required for chromatin 402
structure and gene silencing. Nat Struct Mol Biol 16, 763-768, doi:10.1038/nsmb.1611 403
(2009). 404
20 Schmitges, F. W. et al. Histone methylation by PRC2 is inhibited by active chromatin marks. 405
Molecular cell 42, 330-341, doi:10.1016/j.molcel.2011.03.025 (2011).
406
21 Veluchamy, A. et al. An integrative analysis of post-translational histone modifications in the 407
marine diatom Phaeodactylum tricornutum. Genome Biol 16, 102 (2015). 408
22 Bernardes, J. S., Vieira, F. R., Zaverucha, G. & Carbone, A. A multi-objective optimization 409
approach accurately resolves protein domain architectures. Bioinformatics 32, 345-353, 410
doi:10.1093/bioinformatics/btv582 (2016). 411
23 Bernardes, J., Zaverucha, G., Vaquero, C. & Carbone, A. Improvement in Protein Domain 412
Identification Is Reached by Breaking Consensus, with the Agreement of Many Profiles and 413
Domain Co-occurrence. PLoS Comput Biol 12, e1005038, doi:10.1371/journal.pcbi.1005038 414
(2016). 415
14
24 Le Costaouëc, T., Unamunzaga, C., Mantecon, L. and Helbert, W. New structural insights into 416
the cell-wall polysaccharide of the diatom Phaeodactylum tricornutum. Algal research 26 417
172-179 (2017). 418
25 Marcotte, E. M., Pellegrini, M., Yeates, T. O. & Eisenberg, D. A census of protein repeats. J 419
Mol Biol 293, 151-160, doi:10.1006/jmbi.1999.3136 (1999).
420
26 Yu, J. S. & Cui, W. Proliferation, survival and metabolism: the role of PI3K/AKT/mTOR 421
signalling in pluripotency and cell fate determination. Development 143, 3050-3060, 422
doi:10.1242/dev.137075 (2016). 423
27 Etienne-Manneville, S. & Hall, A. Rho GTPases in cell biology. Nature 420, 629-635, 424
doi:10.1038/nature01148 (2002). 425
28 Bryan, B. A., Li, D., Wu, X. & Liu, M. The Rho family of small GTPases: crucial regulators of 426
skeletal myogenesis. Cell Mol Life Sci 62, 1547-1555, doi:10.1007/s00018-005-5029-z (2005). 427
29 Thompson, S. J., Loftus, L. T., Ashley, M. D. & Meller, R. Ubiquitin-proteasome system as a 428
modulator of cell fate. Curr Opin Pharmacol 8, 90-95, doi:10.1016/j.coph.2007.09.010 (2008). 429
30 Maheswari, U. et al. Digital expression profiling of novel diatom transcripts provides insight 430
into their biological functions. Genome biology 11, R85, doi:gb-2010-11-8-r85 [pii] 431
10.1186/gb-2010-11-8-r85 (2010). 432
31 Siaut, M. et al. Molecular toolbox for studying diatom biology in Phaeodactylum tricornutum. 433
Gene 406, 23-35, doi:S0378-1119(07)00275-2 [pii]
434
10.1016/j.gene.2007.05.022 (2007). 435
32 Lin, X., Tirichine, L. & Bowler, C. Protocol: Chromatin immunoprecipitation (ChIP) 436
methodology to investigate histone modifications in two model diatom species. Plant 437
methods 8, 48, doi:10.1186/1746-4811-8-48 (2012).
438
33 Rogato, A. et al. The diversity of small non-coding RNAs in the diatom Phaeodactylum 439
tricornutum. BMC genomics 15, 698, doi:10.1186/1471-2164-15-698 (2014). 440
34 Hobert, O. PCR fusion-based approach to create reporter gene constructs for expression 441
analysis in transgenic C. elegans. Biotechniques 32, 728-730 (2002). 442
35 Rastogi, A., Murik, O., Bowler, C. & Tirichine, L. PhytoCRISP-Ex: a web-based and stand-alone 443
application to find specific target sequences for CRISPR/CAS editing. BMC bioinformatics 17, 444
261, doi:10.1186/s12859-016-1143-1 (2016). 445
36 Falciatore, A., Casotti, R., Leblanc, C., Abrescia, C. & Bowler, C. Transformation of 446
nonselectable reporter genes in marine diatoms. Mar Biotechnol (NY) 1, 239-251, doi:MBT30 447
[pii] (1999). 448
37 Rastogi, A. V. F., Deton-Cabanillas AF, Veluchamy A., Cantrel, C., Wang, G., Vanormelingen, 449
P., Bowler, C., Piganeau, G., Hu, H. and Leila Tirichine. A genomics approach reveals the 450
global genetic polymorphism, structure and functional diversity of ten accessions of the 451
marine model diatom Phaeodactylum tricornutum 452
453
ISME J (2019).
454
38 Benjamini, Y., and Yekutieli, D. . The control of the false discovery rate in multiple testing 455
under dependency. Annals of Statistics 29, 1165–1188 (2001). 456
39 Veluchamy, A. et al. Insights into the role of DNA methylation in diatoms by genome-wide 457
profiling in Phaeodactylum tricornutum. Nat Commun 4, doi:10.1038/ncomms3091 (2013). 458
40 Zang, C. et al. A clustering approach for identification of enriched domains from histone 459
modification ChIP-Seq data. Bioinformatics 25, 1952-1958, 460
doi:10.1093/bioinformatics/btp340 (2009). 461
41 Rastogi, A. et al. Integrative analysis of large scale transcriptome data draws a 462
comprehensive landscape of Phaeodactylum tricornutum genome and evolutionary origin of 463
diatoms. Sci Rep 8, 4834, doi:10.1038/s41598-018-23106-x (2018). 464
15
42 Jourdren, L., Bernard, M., Dillies, M. A. & Le Crom, S. Eoulsan: a cloud computing-based 465
framework facilitating high throughput sequencing analyses. Bioinformatics 28, 1542-1543, 466
doi:10.1093/bioinformatics/bts165 (2012). 467
43 Bowler, C. et al. The Phaeodactylum genome reveals the evolutionary history of diatom 468
genomes. Nature 456, 239-244, doi:nature07410 [pii] 469
10.1038/nature07410 (2008). 470
44 McKenna, A. et al. The Genome Analysis Toolkit: a MapReduce framework for analyzing next-471
generation DNA sequencing data. Genome Res 20, 1297-1303, doi:10.1101/gr.107524.110 472 (2010). 473 474 Acknowledgements 475
Hanhua Hu from the Chinese Academy of Science is acknowledged for the gift of CM 476
morphotype. ). LT acknowledges funds from the CNRS and the region of Pays de la Loire 477
(ConnecTalent EPIALG project). CB acknowledges funding from the ERC Advanced Award 478
‘Diatomite. XZ was supported by a PhD fellowship from the Chinese Scholarship Council 479
(CSC-201604910722). AR was supported by an International PhD fellowship from the MEMO 480 LIFE Program. 481 482 483 Competing interests 484
The authors declare no competing interests. 485
16
Figure legends
487
Figure 1. Phaeodactylum tricornutum morphotypes and enhancer of zeste knockout
488
mutants. (a) P. tricornutum morphotypes (top left fusiform, scale bar = 3µm, top right oval,
489
bottom left triradiate, scale bar = 2µm, bottom right cruciform). Scale bars correspond to 1 µm 490
in OM and CM. (b) Sequence chromatograms of PCR product from WT cells and CRISPR cas9 491
mutants of enhancer of zeste showing the different indels in FM, TM and CM. (c) Light 492
microscopy images of WT, E(z) KO and Cas9 control cells. Empty vector controls containing 493
Cas9 and Shble antibiotic resistance gene show no loss of H3K27me3 and retain the wild type 494
morphology suggesting that morphology distortion is not due to the transformation but to the 495
absence of H3K27me3. (d) Western blots of WT and two E(z)KOs from each morphotype 496
using a monoclonal antibody against H3K27me3. Histone H4 was used as a loading control. 497
ChIP-QPCR enrichment levels of H3K27me3 on genes in WT and E(z) KO in FM (e) and TM 498
(f) backgrounds. 499
500
Figure 2. Genomic features of H3K27me3 targets in FM and TM cells. (a) Venn diagrams
501
showing the number of common and specific genomic features [Genes, Transposable elements 502
(TEs), and Intergenic Regions (IGRs)] targeted by H3K27me3 in TM (orange circles) and FM 503
(blue circles). ChIP-QPCR validation of H3K27me3 specifically marked genes in (b) TM and 504
(c) FM morphotypes. (d) Distribution of the most frequent GO terms on genes marked with
505
H3K27me3. The distribution was sub-divided into different categories, where TM and FM 506
represent the GOs observed exclusively on triradiate and fusiform genes, respectively. A third 507
category (Both) also presents a GO distribution for genes observed on both morphotypes. 508
509
510
Figure 3. Gene expression profiles of 3HK27me3 specific and common targets in FM and
511
TM. (a) The box plot represents mean enrichment of H3K27me3 (Y-axis), with log10 scaling,
512
over genes marked specifically in FM (blue), TM (orange), and also on genes marked in both 513
(commonly marked) morphotypes. The enrichment profile is generated using number of genes 514
marked by H3K27me3 specifically in each morphotype and also in both. The significant 515
H3K27me3 enrichment difference between specifically marked and commonly marked is 516
estimated using two-tailed t-test with P value < 0.0001, denoted by “****”. (b) Expression of 517
17
genes marked specifically in FM (blue), TM (orange), and in both phenotypic backgrounds with 518
same principle aesthetics and categorical genes, used in 2f. The significance/non-significance 519
of the variability of expression between specifically and commonly marked genes is estimated 520
using two-tailed t-test with P value = 0.0433, as denoted by “*”. “ns” denote non-significant. 521
(c) Relative expression level of H3K27me3 targets genes in the TM and enhancer of zeste knock 522
out M2-11. In the plot, fold change log2(PtM2-11/Pt8Tc) values are shown (d) Boxplot 523
showing the entropy value distribution of H3K27me3 marked genes. Entropy values measures 524
the differential expression of genes under different experimental conditions. Entropy values are 525
derived from expression data (fragments per kilobase of exon per million fragments mapped) 526
under five different experimental conditions. Genes marked specifically by H3K27me3 in TM 527
(Triradiate) shows higher variation in expression followed by FM (Fusiform) specific 528
H3K27me3 marked genes. Horizontal lines represent the median entropy values. The 529
significant of FM/TM-specific H3K27me3 marked genes and genes marked on both conditions 530
are estimated using two-tailed t-test with P value < 0.0001. 531
532 533
Figure 4. H3K27me3 enrichment levels and morphotype switch. (a) Schematic diagram
534
showing how TM-N, TM-T1 and TM-Fusi were generated. After generations of culture in lab 535
growth condition (ASW media, 19°C, 12h/12h light dark period), some triradiate cells switch 536
to fusiform forming a mixture of FM and TM cells, named TM-N. A single fusiform cell from 537
TM-N was picked and propagated clonally giving rise to TM-Fusi. Similarly, single triradiate 538
cell was isolated from TM-N and its clonal propagation gave a population of pure triradiate 539
cells named TM-T1. (b) Relative expression level of Enhancer of Zest in FM, TM-N, TM-T1 540
and TM-Fusi respectively, two pairs of primer were designed at N-terminal of Enhancer of 541
Zeste gene, and at the CXC domain respectively. (c) ChIP-QPCR enrichment levels of 542
H3K27me3 in TM-T1 and TM-Fusi. (d) ChIP-QPCR showing enrichment levels of H3K27me3 543
in TM-T1 and TM-N. 544
545
Supplementary Table 1. Cell counts of different morphologies and cell size measurements in
546
each wild type morphotype and knock out of E(z) 547
Supplementary Table 2. List of genes marked by H3K27me3 with their annotation and GOs.
18
Supplementary Table 3. List of the primers used in this study
549
Supplementary Table 4. Mass spectrometry quantification of Di- and Tri-methylation of
550
H3K27me3 551
Supplementary Figure 1. Phylogeny (a-c). (d) Western blots using a monoclonal antibody
552
against H3K27me3 on protein or chromatin extracts of different species representative of the 553
super SAR lineage (1: Bigelowiella_natans, 2: Gymnophora dimorpha, 3: Skeletonema 554
marinoi, 4: Thalassiosira pseudonana, 5: Raphoneis sp, 6: Synedra sp, 7:
555
Asterionellopsisglacialis, 8: Thalassiosira rotula, 9: Phaeodactylum tricornutum, 10:
556
Isocrhrysis lutea, 11: Amhedinium klebselii, 12: Amhedinium carteri). (e) Western blot on
557
chromatin extracts from OM, FM, TM and CM with a monoclonal antibody against H3K27me3 558
showing a significant difference in enrichment levels of H3K27me3 in TM and CM which are 559
higher compared to FM and OM. 560
561
Supplementary Figure 2. (a) Western blot of chromatin extracts of Cas9 control lines from
562
each of FM, TM and CM. H4 histone antibody was used as a loading control. (b, c) Mass 563
spectrometry quantification of di and tri-methylation of lysine 27 of histone H3 in both wild 564
type and enhancer of zeste knockout mutant. MS/MS spectrum of the [M + 2H]2+ precursor ion
565
of histone H3 (27–36 residue peptide) tri-methylated or di-methylated on K27. Broken bonds 566
above and below sequence denote b and y ions, respectively, that were annotated from the 567
spectrum. (d) Abundance of H3 K27 di- and tri-methylated KSAPATGGVK peptide. Y axis 568
shows normalized log2 (WT/Mutant) of the di-methylated and tri-methylated peptides. All 569
measurements have been performed in triplicate, and error bars indicated the 97.5% confidence 570
interval (see supplementary Table 1). (e) Western blot of chromatin extracts from wild type FM 571
and TM as well as E(z) knockouts in both backgrounds with a monoclonal antibody against 572
H3K27me2. H4 histone antibody was used as loading control. (f) Growth curves of wild type, 573
enhancer of zeste mutants and cas9 control line in each of FM, TM and CM. (g) Gel picture of 574
a molecular marker distinguishing FM and TM and amplifying an insertion in one allele present 575 in FM but absent in TM. 576 577 Supplementary Figure 3. 578
19
(a)Total genome coverage of H3K27me3 within TM (orange) and FM (blue) showing a higher 579
mapping of H3K27me3 in TM compared to FM. (b) mean distribution of H3K27me3 over 500 580
bp upstream, gene body, and 500 bp downstream region of all the gene targets in TM (orange 581
line) and FM (blue line). (c) Unmarked genes (J01910, J31617), commonly marked genes 582
(J34600, J44413) were chosen as internal controls. FM (EG00164) and TM specifically marked 583
(J49062) genes were used as controls for the reproducibility of independent ChIP-QPCR 584
results. (d) violin plot represents the mean fold change of gene expression in Ez(KO) lines in 585
TM compared to the wild-type (WT). The significant expression difference between Ez(KO) 586
and WT is estimated using two-tailed t-test with P value < 0.0001 587
588
Supplementary Figure 4. Scatter plots with Pearson correlation coefficient displaying the
589
relationship between TM and E(z) knock out RNA Seq replicates. 590
Supplementary Figure 5. Scatter plots with Pearson correlation coefficient displaying the
591
relationship between TM ChIP-Seq replicates 592
593 594
Supplementary Table 1. Cell counts of different morphologies and cell size measurements in
595
each wild type morphotype and knock out of E(z) 596
Supplementary Table 2. List of genes marked by H3K27me3 with their annotation and GOs.
597
Supplementary Table 3. List of the primers used in this study
598
Supplementary Table 4. Mass spectrometry quantification of Di- and Tri-methylation of
599
H3K27me3 600
Supplementary Figure 1. Phylogeny (a-c). (d) Western blots using a monoclonal antibody
601
against H3K27me3 on protein or chromatin extracts of different species representative of the 602
super SAR lineage (1: Bigelowiella_natans, 2: Gymnophora dimorpha, 3: Skeletonema 603
marinoi, 4: Thalassiosira pseudonana, 5: Raphoneis sp, 6: Synedra sp, 7:
604
Asterionellopsisglacialis, 8: Thalassiosira rotula, 9: Phaeodactylum tricornutum, 10:
605
Isocrhrysis lutea, 11: Amhedinium klebselii, 12: Amhedinium carteri). (e) Western blot on
606
chromatin extracts from OM, FM, TM and CM with a monoclonal antibody against H3K27me3 607
20
showing a significant difference in enrichment levels of H3K27me3 in TM and CM which are 608
higher compared to FM and OM. 609
610
Supplementary Figure 2. (a) Western blot of chromatin extracts of Cas9 control lines from
611
each of FM, TM and CM. H4 histone antibody was used as a loading control. (b, c) Mass 612
spectrometry quantification of di and tri-methylation of lysine 27 of histone H3 in both wild 613
type and enhancer of zeste knockout mutant. MS/MS spectrum of the [M + 2H]2+ precursor ion 614
of histone H3 (27–36 residue peptide) tri-methylated or di-methylated on K27. Broken bonds 615
above and below sequence denote b and y ions, respectively, that were annotated from the 616
spectrum. (d) Abundance of H3 K27 di- and tri-methylated KSAPATGGVK peptide. Y axis 617
shows normalized log2 (WT/Mutant) of the di-methylated and tri-methylated peptides. All 618
measurements have been performed in triplicate, and error bars indicated the 97.5% confidence 619
interval (see supplementary Table 1). (e) Western blot of chromatin extracts from wild type FM 620
and TM as well as E(z) knockouts in both backgrounds with a monoclonal antibody against 621
H3K27me2. H4 histone antibody was used as loading control. (f) Growth curves of wild type, 622
enhancer of zeste mutants and cas9 control line in each of FM, TM and CM. (g) Gel picture of 623
a molecular marker distinguishing FM and TM and amplifying an insertion in one allele present 624 in FM but absent in TM. 625 626 Supplementary Figure 3. 627
(a)Total genome coverage of H3K27me3 within TM (orange) and FM (blue) showing a higher 628
mapping of H3K27me3 in TM compared to FM. (b) mean distribution of H3K27me3 over 500 629
bp upstream, gene body, and 500 bp downstream region of all the gene targets in TM (orange 630
line) and FM (blue line). (c) Unmarked genes (J01910, J31617), commonly marked genes 631
(J34600, J44413) were chosen as internal controls. FM (EG00164) and TM specifically marked 632
(J49062) genes were used as controls for the reproducibility of independent ChIP-QPCR 633
results. (d) violin plot represents the mean fold change of gene expression in Ez(KO) lines in 634
TM compared to the wild-type (WT). The significant expression difference between Ez(KO) 635
and WT is estimated using two-tailed t-test with P value < 0.0001 636
21
Supplementary Figure 4. Scatter plots with Pearson correlation coefficient displaying the
638
relationship between TM and E(z) knock out RNA Seq replicates. 639
Supplementary Figure 5. Scatter plots with Pearson correlation coefficient displaying the
640
relationship between TM ChIP-Seq replicates 641 642 643 644 645 646
b a FM OM TM CM f FM TM CM DEL6 TS12 M2-10 M2-11 M20 M32 FM αH4 αH3K27me3 WT TM αH4 αH3K27me3 WT CM αH3K27me3 αH4 WT 0 1 2 3 4 5 6 7 H 3 K 27 m e3 e nr ic h m ent
FM IP FM DEL6 IP FM Mock FM DEL6 Mock
d
e
WT Mutant Cas9 control
FM TM CM c 0 0.2 0.4 0.6 0.8 1 1.2 1.4 H 3 K 27 m e3 e nr ic h m ent
M2-11IP1 M2-11mock Pt8TcIP1 Pt8Tcmock
c 297 1326 635 37 99 15 360 2043 294 Genes TEs IGRs a b FM TM **** d 0 1 2 3 4 5 6 7 8 H 3 K 27 m e3 e nr ic hm en t 0 20 40 60 80 100 120 140 160 180 H 3 K 27 m e3 e nr ic hm en t TM TM-mock FM FM-mock
Figure 2
FM S peci fic Both (FM ) TM S peci fic Both (TM ) 0 1 2 3 4 L og 10 ( E nr ic h m en t) **** **** FM S peci fic Both (FM ) TM S peci fic Both (TM ) -1 1 3 5 Lo g1 0 (E xp re ss ion ) * ns b a 0.25 0.5 1 2 4 8 16 32 64 128 256 512 lo g( M 2-1 1/ T M ) c d
Figure 3
0 5 10 15 20 25 30 35 40 45 44695 49062 40151 43588 36531 43513 TM-T1 mock TM-T1 IP TM-N mock TM-N IP 0 5 10 15 20 25 30 35 40 45 44695 49062 40151 43588 36531 43513
TM-T1mock TM-T1IP TM-Fusi mock TM-Fusi IP TM-N After N generations TM-T1 Clonal propagation TM-Fusi TM Clonal propagation H 3K 27 m e3 en ric hm e nt H 3K 27 m e3 e nr ic hm en t a b c d R e la tive e xp re ss io n o f E (z ) 0 0.05 0.1 0.15 0.2 0.25 FM TM-N TM-T1 TM-Fusi Primer designed
Figure 4
a
b
c
0 0.5 αH3K27me3 αH4 OM FM TM CM e d Rhizaria H ap to ph yte Alveolates Diatoms αH3K27me3 1 2 3 4 5 6 7 8 9 10 11 12
Figure S1
y 1 b 1 b 2 y 3 b 3 y4 y5 b 5 y 6 b 7 o y 7 a 8 y 8 b 8 a9 y9 f b c e d αH3K27me2 αH4 FM DEL6 FM C as 9 TM M 2-11 TM C as 9 500bp 250bp % In te ns ity m/z, Da y1 a1 y1* b 2 y 2 b 3 a 3 y 3 y4 y 5 b 5 a5 b 6 a 6 b6o y 7 b 7 b8 a 8 y9 y 9 o % In te ns ity m/z, Da 0 2 4 6 8 10 lo g2 (W T/ M ut an t) 0.00E+00 2.00E+06 4.00E+06 6.00E+06 8.00E+06 1.00E+07 1.20E+07 1.40E+07 D ay 1 D ay 4 D ay 6 D ay 8 Da y1 0 Da y1 2 Da y1 4 Da y1 7 FM DEL6 FMCas9 0.00E+00 5.00E+06 1.00E+07 1.50E+07 2.00E+07 D ay 1 D ay 4 D ay 6 D ay 8 D ay 10 D ay 12 D ay 14 D ay 17 TM M2-11 TM Cas9 0.00E+00 2.00E+06 4.00E+06 6.00E+06 8.00E+06 1.00E+07 1.20E+07 1.40E+07 1.60E+07 1.80E+07 Da y1 Da y4 Da y6 Da y8 Da y1 0 Da y1 2 Da y1 4 Da y1 7 CM M20 CM Cas9 FM TM CM N um be ro f c el ls /m l
Figure S2
g N um be ro f c el ls /m l N um be ro f c el ls /m l a αH4 αH3K27me3 Pt 1 8. 6 w t Pt 8T c w t Pt cr w t Pt 1 8. 6 Ca s9 Pt 8T cC as 9 Pt cr Ca s90 20 40 60 80 100 120 U P UP UP UP UP UP UP UP UP UP G EN E G EN E G EN E G EN E G EN E G EN E G EN E G EN E G EN E G EN E DO W N DO W N DO W N DO W N DO W N DO W N DO W N DO W N DO W N DO W N FM TM N or m al iz ed re ad c ou nt s ATG -500 bps Gene Body +500 bps * b a H 3K 27 m e3 c ove ra ge ( % ) 12.5 13 13.5 14 14.5 15 FM TM d FM [Ez(KO) vs WT] c
Figure S3
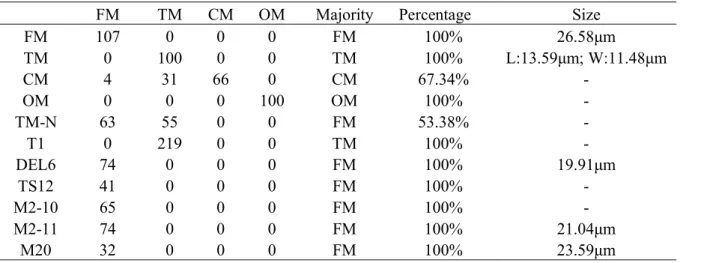
0 50 100 150 200 J01910 J31617 J34600 J44413 EG00164 J49062 TM FM TM mock TM mock H 3K 27 m e3 re la tiv e en ric hm en tTable 1. Cell counts of different morphologies and cell size measurements in each wild type morphotype and knock out of E(z)
FM TM CM OM Majority Percentage Size
FM 107 0 0 0 FM 100% 26.58μm TM 0 100 0 0 TM 100% L:13.59μm; W:11.48μm CM 4 31 66 0 CM 67.34% - OM 0 0 0 100 OM 100% - TM-N 63 55 0 0 FM 53.38% - T1 0 219 0 0 TM 100% - DEL6 74 0 0 0 FM 100% 19.91μm TS12 41 0 0 0 FM 100% - M2-10 65 0 0 0 FM 100% - M2-11 74 0 0 0 FM 100% 21.04μm M20 32 0 0 0 FM 100% 23.59μm
Table 2. Mass spectrometry quantification of Di- and Tri-methylation of H3K27me3
peptide sequence Protein Modification (without Nterm Met) peptide used for normalization log2(WT/Mutant) CI 2.5% CI 97.5% adjusted p value KSAPATGGVK Dimethyl (K:27) STDLLIR 1.52038639 1.09023167 1.95054112 2.10E-07