THERMOGRAPHY VS HOLOGRAPHIC TECHNIQUES FOR NONDESTRUCTIVE TESTING
OF COMPOSITES: SIMILARITIES, DIFFERENCES AND POTENTIAL
CROSS-FERTILIZATION
Marc GeorgesCentre Spatial de Liège, Université de Liège, Liege Science Park, 4031 Angleur, Belgium [email protected]
SUMMARY: Thermography and holography are full-field non-contact techniques which are used in nondestructive testing (NDT) applications. Thermography is a step forward to holography for damage detection because it is easier to interpret. We discuss their common aspects and what distinguish them. Also the complementarity of both is addressed and an innovative combination of both is proposed. At last we show how processing developed for thermography can benefit to holography, specifically in the domain of composite materials.
INTRODUCTION
Active infrared (IR) thermography [1] is a well-established technique for NDT, especially in the field of damage detection in composites. A thermal IR camera observes at the surface of an inspected part the tiny temperature variations which are due to the passage of a heat wave which is altered by the presence of defects underneath the surface. Generally these temperature variations come from various ways depending on the excitation source, either external or internal (the material itself under some stress). The most noticeable thermography method use brief thermal waves (flash lamp) with various analysis techniques of the thermogram series recorded during the temperature decrease. These techniques can be deterministic like Fourier transform (Pulse Phase Thermography) [2] or statistical (Principal Component Analysis) [2,3]. Another method uses modulated halogen lamps for heating the sample and a processing technique based on synchronous detection (lock-in thermography) [2,4].
Damage detection is also possible by holographic techniques [5]. A hologram of the defective part is recorded at the rest and afterwards it undergoes some external load (heat, pressure variation, vibration). When loaded, the object is deformed and a second hologram is recorded. Afterwards one observes the interference between the object wavefields obtained from both holograms. The global deformation of the sample under the load provides a system of interference fringes and defects are located by a stronger density of fringes or by a sudden deviation of the fringes in the pattern. The holographic techniques we refer to here encompasses different variants like classical holographic interferometry (photoplates, photorefractive crystals, etc...), electronic speckle pattern interferometry (ESPI), digital holographic interferometry (DHI) and electronic speckle shearing interferometry (aka shearography). However in this paper we will mostly consider ESPI and shearography. In the latter, we observe directly the derivative of displacement along a transverse direction.
The similarities between the thermography and holography are obvious: both are full-field and non-contact. Often the loading techniques are the same and the excitation levels are similar. Their biggest difference is that thermography provides monotonic images whereas holography provides complex fringe patterns or wrapped phase maps. Therefore the latter needs more processing than the former. In most cases industrials prefer thermography to holography, mostly because they can more easily understand by themselves the thermograms, contrary to interferograms. Instead of discouraging us, this must lead us to improve the capability of holography to provide quickly defect maps. Unlike holographic techniques, thermography makes largely use of processing temporal series of images. Such series show a rich content of information and, for instance, allows one to separate unwanted contributions to the signal (global heating) and obtain unique images of defects.
International Conference on Processes in Combined Digital Optical and Imaging Methods applied to Mechanical Engineering E. Hack and P. K. Rastogi, Conference chairs, Ascona, Switzerland, 8–13 May 2016
So, if thermography is easier to apply and interpret compared to holography, what could be the point to carry on with holo/shearography for damage detection? Simply because the latter provides mechanical information about the behaviour of the composite parts under given loads, and specifically loads that they will undergo during life-cycle, for instance. Thermography is probably more efficient and mature than holography for detecting defects in non-destructive inspection. However to our opinion, it is of lesser interest from the point of view of engineers who try to understand and improve the integrity of their structures, for example with respect to impacts. Also some experiments have shown that signature of some types of defects appear more easily with shearography than thermography, and reverse.
For that reason, we think that we cannot oppose the two techniques, but instead we try to use them both, either in combination or separately, depending on the information required by the industrial end-users. Also, some of our recent works aimed precisely at improving the processing of shearography for defect detection, being inspired by strategies largely used in thermography. This cross-fertilization of both techniques will be discussed in the next sections. First we will show an innovative way of combining them. Afterwards we will discuss different works aiming at improving applicability of holography that have been inspired by thermography.
COMBINATION OF THERMOGRAPHY AND HOLOGRAPHY
The interest of combining holographic and thermographic has been demonstrated already. Some groups have proposed experiments in which two separate systems are placed one beside the other and observe simultaneously the sample [6,7]. We recently proposed an innovative way to combine both by considering digital holography and ESPI in the long-wave infrared (LWIR), corresponding to the sensitivity range of uncooled thermographic cameras and CO2 lasers. LWIR holography has many advantages which are
discussed in Refs [8-10]. We showed that this system allows obtaining temperature variations and deformation simultaneously and in every pixel, with advantages in different applications, like thermo-mechanical assessment of composite materials, as well as defect detection. This is due to the fact that holograms or specklegrams recorded by thermal cameras contains a background incoherent part which comes from the thermal emission of the object. It can be separated by the holographic part of the signal by various methods [9]. Figure 1(a) shows a picture of a mobile instrument, described in details in Ref [8] and developed in the FANTOM project [10]. It is placed in front of huge composite structures lying in a testing facility (hangar) of a leading aircraft manufacturer. Heating lamps are used with the step heating (a few seconds). Initial hologram and thermogram are taken prior heating and they are subtracted from new ones captured during heating and relaxation. We then obtain simultaneous deformation and temperature as shown in Figures 1 (b) and (c) respectively. A defect is observed in both images and surrounded in red.
FIGURE 1: (a) Mobile LWIR ESPI system in front of large composite aircraft fuselage, (b) interferogram showing defect, (c)
thermogram of the same zone showing defect (circled in red).
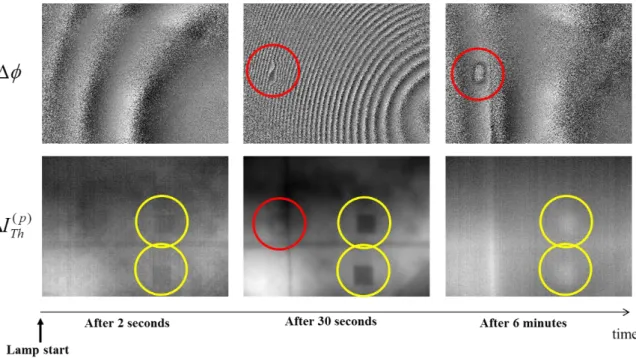
Another example is shown in Figure 2. In this case the interferograms series (top line) shows a defect that is not (or barely) observable in the simultaneous thermogram series (bottom line). Conversely the temperature component of the signal show other defects which are not seen in the interferograms. This demonstrates the efficiency of the combination of both to show different defects, increasing so the probability of detecting defects.
FIGURE 2: Evolution of a interferogram (top line) and thermogram (bottom line) series capture by the mobile LWIR ESPI
instrument. A defect is observed in the deformation, whereas other defects are observed from temperature variations.
WHEN THERMOGRAPHY INSPIRES HOLOGRAPHY
Another way to envisage cross-fertilization is to apply to holography processing techniques that have been proven in thermography. A first example comes from the group who is at the basis of optical lock-in thermography in early 1990s [4] and who showed the use of modulated lamps and lock-in processing in holographic techniques [11]. These works were later followed by other groups [12,13]. In this case a better assessment of defect located in depth can be performed by selecting the lamp modulation frequency.
A second example is the following. We showed recently the application of principal components analysis (PCA) to the defect detection by shearography [14]. PCA has been applied initially in thermography [3] on time series of thermograms. The quantity of information present in such time series allows separating pertinent information from other like global heating. In the case of PCA applied to thermography, a set of increasing order empirical orthogonal functions (EOFs) display images in which artifacts inside the structure have an increasing spatio-temporal variability when a heat wave travels inside the structure. From a series of hundreds of thermograms, only 2 or 3 EOFs show the defects, the other EOFs displaying mainly noise.
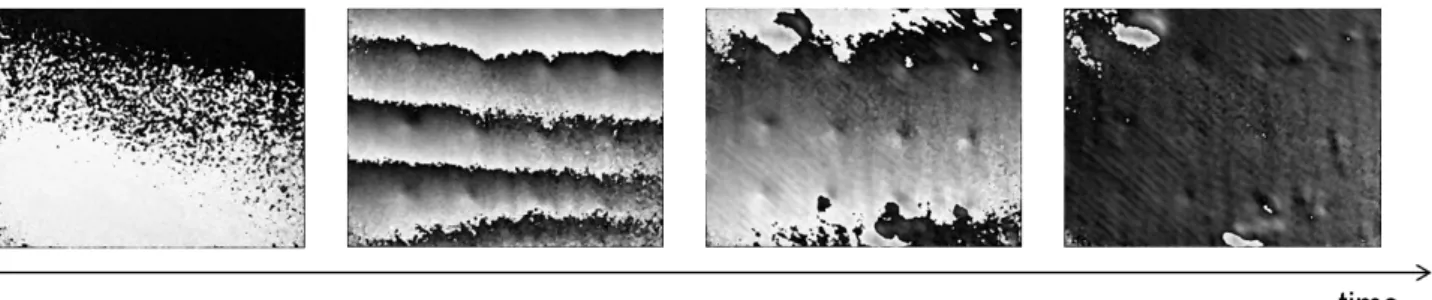
We have applied the PCA principle to the analysis of a temporal series of shearographic interferograms obtained on a composite panel. The latter is a sandwich panel with foam core and a variety of inclusions and debondings between the skins and the core. A heating lamp is placed on the back side of the sample. Figure 3 shows 4 phase maps out of a sequence of few hundreds. The phase is displayed here modulo 2π (shown without spatial phase unwrapping). The first interferogram on the left shows a global behavior in the derivative of displacement field at the beginning of heating. The next interferogram shows the deformation induced by the heat wave and shows both a global behavior (the 4 horizontal fringes) and some local variations to the fringes, which come from the presence of inserts inside the core. In the third image the global deformation has decreased significantly, the inclusions appear better while new local defects appear on top and bottom of the image. In the last image, the global deformation has disappeared and two important defects appear on the top and bottom.
This example shows that during the travel of a heat wave through a sample, the interferograms vary quite significantly with time and defects located at different depths are visible at some specific instants. Here the deeper ones appear first because they are hit by the thermal wave first. Therefore they provoke a local deformation at these instants. The shallow defects appear at the end of the sequence, while the previous ones have disappeared. This shows also how complex can be the analysis of such a sequence when many defects are present at different depths.
FIGURE 3: Temporal series of shearographic interferograms showing different defects at different instants during the
travel of the heat wave through the sample.
We have applied the PCA to the complete sequence and obtained various EOFs. The first and second order EOFs are the only one of interest and are shown in Figure 4. We easily see that the different defects which appear at different instants of the temporal series appear as equivalently variable events in the spatio-temporal data sets and are grouped together in the 2 first EOFs. It must be remarked that we cannot apply shearograms directly to PCA processing but we have to apply the temporal phase unwrapping, which is necessary to obtain a monotonic variation of the signal with the time.
FIGURE 4: (a) first EOF, (b) second EOF of the temporal series
REFERENCES
1. X. Maldague, Theory and practice of infrared technology for nondestructive testing (Wiley, N-Y, 2001) 2. C. Ibarra-Castanedo, N. Avdelidis, et al., Proc. SPIE 7661, 76610O (2010).
3. N. Rajic, Compos. Struct. 58, 521-528 (2002)
4. G. Busse, D. Wu, and W. Karpen, J. Appl. Phys. 71, 3962-3965 (1992)
5. M. Viotti, and A. Albertazzi, Robust speckle metrology: Techniques for stress analysis and NDT (SPIE Press, Bellingham, 2014)
6. M. Feligiotti, E. Hack, et al., Proc. SPIE 7387, 73870H (2010) 7. S. Sfarra, C. Ibarra-Castanedo, et al., Strain 79, 175-189 (2013) 8. J-F. Vandenrijt, C. Thizy, et al., Opt. Eng. 52, 101903 (2013)
9. M. Georges, J-F. Vandenrijt, et al., Opt. Exp. 22, 25517-25529 (2014) 10. M. Georges, Proc. SPIE 9525, 952557 (2015)
11. H. Gerhard, and G. Busse, NDT&E Int. 39, 627-635 (2009) 12. A. Dolinko, and G. Kaufmann, Opt. Las. Eng. 45, 690-694 (2007) 13. G. Kim, S. Hong, et al., Int. J. Prec. Eng. And Manuf. 13, 465-470 (2012) 14. J-F. Vandenrijt, N. Lièvre, and M. Georges, Proc. SPIE 9203, 92030L (2014)