Science Arts & Métiers (SAM)
is an open access repository that collects the work of Arts et Métiers Institute of Technology researchers and makes it freely available over the web where possible.
This is an author-deposited version published in: https://sam.ensam.eu Handle ID: .http://hdl.handle.net/10985/6757
To cite this version :
Abir ISSA, Annie-Claude BAYEUL-LAINE, Gérard BOIS - Numerical study of the influence of Geometrical Parameters on flow in water Pump-Sump - In: Conference on Modelling Fluid Flow (CMFF’09), Hungary, 2009-09-09 - Conference on Modelling Fluid Flow (CMFF’09) The 14th International Conference on Fluid Flow Technologies - 2009
Any correspondence concerning this service should be sent to the repository Administrator : [email protected]
Conference on Modelling Fluid Flow (CMFF’09) The 14th International Conference on Fluid Flow Technologies Budapest, Hungary, September 9-12, 2009
N
UMERICAL
S
TUDY OF THE
I
NFLUENCE OF
G
EOMETRICAL
P
ARAMETERS ON
F
LOW IN
W
ATER
P
UMP
-S
UMP
Abir ISSA
1, Annie-Claude BAYEUL-LAINẺ
2, Gérard BOIS
31 Arts et Métiers ParisTech, LML, UMR CNRS 8107, 8 Boulevard Louis XIV 59046 Lille Cedex, France Fax: +33 20 53 55 93. E-mail:
2 Arts et Métiers ParisTech, LML, E-mail: [email protected] 3 Arts et Métiers ParisTech, LML, E-mail: [email protected]
ABSTRACT
Water for irrigation, domestic and industrial supply as well for some power generation is normally drawn directly from rivers or from reservoir through sumps.
The flow at the pump section sump may have large effects on the pump performances and the operating conditions. The flow patterns in the sump are mainly determined by the shape and scale of the sump. However, it’s not always possible to design a sump pump to provide uniform and stable flow to pumps, due to site constraints. For example in some cases air entraining (surface and subsurface vortex) occurs. These vortices may reduce pump performances and lead to increase plant operating costs.
It becomes essential to investigate the pump sump to avoid these non uniformities inlet flow problems. Two approaches (experimental and numerical) are generally followed for such investigation.
The numerical approach usually used solves the Reynolds averaged Navier-Stokes (RANS) equations with a near-wall turbulence model. In the validation of this numerical model, emphasis was placed on the prediction of the number, the location, the size and the strength of the various types of vortices.
A previous studydone by the same hauteur of this one [1], has shown the influence on a single type of mesh with different cell numbers, different intake pipe depths and different water levels, for two turbulence models closure.
The present paper mainly focuses, first, on the effect of pump intake location in the sump and secondly on the effect of several inlet velocity gradients at inlet sump section.
Keywords: CFD, free surface vortex, submerged vortex.
NOMENCLATURE
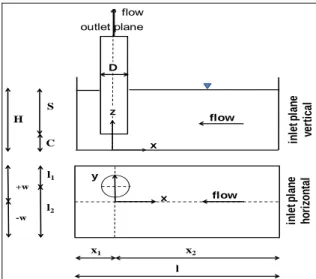
C [m] clearance distance from floor
D [m] pipe intake diameter
H [m] water level in the sump-pump
L [m] the Pump-sump length
S [m] submergence depth for the pipe U [m/s] mean velocity in the sump V [m/s] mean velocity in the intake pipe
W [m] pump-sump width
g [m/s2] acceleration due to gravity
k [m2/s2 ] turbulence kinetic energy ν [m2/s] kinematic viscosity
ω [s-1] specific dissipation rate ρ [kg/m3] water density.
σ [N/m] coefficient of surface tension Fr Froude number for the pipe submergence Re Reynolds number in the pipe
We Weber number
1. INTRODUCTION
It’s essential to design a sump pump that can provide fairly uniform and free vortices flow to the pumps. However, it’s not always possible, due to geometrical site specific constraints, which may cause a poor design of the intake.
Low intake submerged depth could also results in the formation of the air entraining free surface vortices that could as well promote cavitation, [2].
Non uniform inlet flow field at sump entrance even far from pump intake section can also leads to accumulative effects due to 3D boundary layers development on the side-wall creating corners vortices that can be strength by local strong streamline curvature when approaching pump intake.
All these non uniformities may create flow instabilities, vibrations and other undesirable phenomena that can cause operating difficulties and frequent maintenance of the whole pump arrangements.
Melville et al. [2] have listed the main geometrical parameters that could influence the flow pattern in sump pump (Figure 1): submergence of the pump intake pipe(S), floor clearance(C), width clearance (l), back wall clearance(x1). As well
non-dimensional cinematic parameters include: - Reynolds number in the intake pipe Eq. (1)
ν VD
Re= (1)
- Froude number of the submerged Eq. (2)
gS U
Fr= (2)
- The Weber number, Eq. (3)
σ D V We ρ 2 = (3)
Experimental investigations have been performed on physical scale model to reduce non uniformities of specific flow and geometrical conditions ([3] to [6]). More basic studies have been also conducted to establish empirical criteria for vortex formation and avoidance, ([7] to [9]).
Over the past 15 years, modeling sumps by using CFD has remarkably developed to evaluate the flow around suction pipe intake in the sump, and contribute to the advancement of the knowledge about vortices formation, swirl, and pre-rotation. Tagomori and Gotoh [10] have used a finite volume method to solve the RANS equations with the (k-ε) turbulent model, in order to study the effects of non uniform inlet flow on vortex generation and the effects of additional devices to prevent vortical flow formation. Takata et al. [11] use large eddy simulations of pump intake flows at low Reynolds number (104). More recently, CFD benchmarks have been performed by Matsui et al. [12] in order to compare different software results with experiments.
Constantinescu and Patel [13] have developed a CFD model to solve RANS equations and two turbulence model equations in order to simulate the flow in the sump; than they valued their results by experience.
Both of laboratory experimental results and numerical data from sump pump modeling show that the vortices (size, form, location, and strength) depend on the pipe location in the sump and the pump sump geometry itself.
2. BACKGROUND
In a rectangular sump configuration, Constantinescu and Patel [13], reported that the strength of vortices increases with increase of vorticity in the approach flow; the intensity of the
free surface and floor-attached vortices increases with asymmetry in the approach flow in the horizontal plane; the intensity of the side-wall attached vortices grows with asymmetry in the approach flow in the vertical plane; back-wall and corner vortices are due to secondary flows; the intensity of floor-attached vortices decreases while that of side-wall and back-wall vortices increases as the floor clearance is increased.
There is a general agreement among the various studies that free-surface vortices are observed as the submergence decreases and air-entraining vortices appear at low submergence. This last aspect has been recently studied and reported by Shula and Kshirsagar [14].
J. Matsui and Kamemoto [12], have analyzed the simulation of the flow in a standard pump sump by 5 groups with various codes, grids, and methods. These results are compared with the experimental result by PIV measurement. The distribution of vorticity is different in each CFD results. Numerical method, turbulent model, grid numbers, and grid shape may change the vorticity largely.
In previous paper [1] the study has been focused on the submergence effect with the intake pipe always located in the middle in the sump width. This study also demonstrated that, the vorticity level becomes greater when the submergence decreases.
The aim of this paper is to complete numerically the previous study done ([1]), in order to evaluate the effect of:
Firstly: asymmetric location of the pipe in the sump for uniform upstream condition (case I)
Secondly: Two different non-uniform inlet flow conditions at the inlet horizontal plane, for symmetric location of the pipe. (cases II and III).
3. SUMP GEOMETRY AND TEST CASES
The intake geometry used for the calculations is sketched in Fig.1. in le tp la n e ve rt ical x flow z D outlet plane flow S C H in le t p la n e hor iz o n ta l x1 x2 l x y flow l1 l2 +w -w
It is based on the Constantinescu and Patel’s one ([13]). It consists of a rectangular sump with an intake pipe of diameter D=0.1m. It’s to note that the intake pipe is placed at a fixed value from the back wall(x1=0.9D). The level of all water in the sump
still constant (C=0.75D-S=2D) for all tests. As well the mean velocity in the pipe which is equal to V=0.286m/s.
The channel inlet is situated (x2=6,5D)
upstream the pipe axis, and the length of the intake pipe is equal to 8D
As already said, two configurations have been chosen for the present study. For case I, the intake pipe is located asymmetrically in the sump pump according to x axis like l1=D, l2=1.6D, and the
feeding at the inlet of sump is uniform (Fig. 1). For the two other cases, the intake pipe is located at the middle of the sump width (Fig. 2).
Figure 2. Pump-sump shape feeding non-uniform
Modified inlet conditions create a non uniform inlet flow condition in y direction depending on Ф angle values as shown in Table 1. The velocity profile obtained for case III at x=3D, is shown in Fig. 3.
Table 1. Cases studied for feeding asymmetrical
Cases x3 L3 Ф II D D 45° III D 0.5D 26.6° ‐0,15 ‐0,1 ‐0,05 0 0,05 0,1 0,15 0 0,01 0,02 0,03 0,04 W (m ) Velocity (m/s) Velocity
Figure 3. The inlet velocity at x=3D
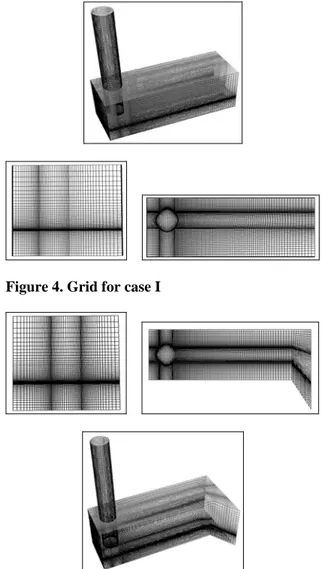
4. GRID AND CALCULATIONS
The calculation domain is mainly divided into 3 blocks, as illustrate in Fig. 4. The first block presents the part of sump which is below the intake pipe, the second one is the rest of sump which includes the submergence pipe intake, assuming an infinity thin pipe wall, and the lastone contains the upper part of pipe up to the free surface. The resulting computational grid is a structured hexahedral grid with 592050 cells, for case I.
For cases II and III, two blocks grid was added in order to modify the inlet of the sump as sketched in Fig. 5 as an example. A total of 59800 cells for case II and 60500 cells for case III have been reached.
For all cases tested, the values of non dimensional numbers are: Re= 28600, We=114 and Fr=0.023. The free surface is considered as a symmetrical condition. Hydrostatic pressure is assumed constant in the inlet plan, and the velocity is imposed in the outlet plane of the pipe. In this study, the flowfield of pump sump isassumed to be steady state and is solved by using a commercial code FLUENT using the turbulent model (k-ω).
Figure 4.Grid for case I
5. PRESENTATION OF RESULTS
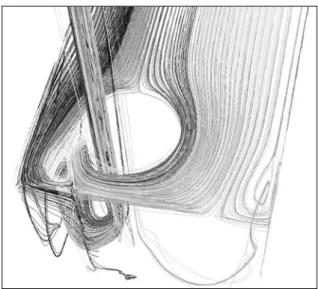
Two types of results are presented. First of all a global overview of streamlines issued from free surface sump are givenin figures 6 to 8 for the three test cases I, II and III respectively. It has to be noticed that the streamline patterns obtained for case I looks like case II or II but on the opposite side. Secondly, the vorticity contours and tangential velocity component contours, for different increasing levels of z inside the inlet intake pipe, are presented in Figs. 9 to 16 for case I, Figs. 17 to 24 for case II and in Figs. 17 to 24 for last case III.
6. DISCUSSION
For case I, the vorticity field has both negative and positive values at first z location as shown in fig 9. Negative values extend more than the positive ones and only negative values remain for increasing z positions inside the pump inlet pipe (figs. 10 to 12). The tangential velocity contours presented in figs. 13 to 16 show a clockwise tangential velocity evolution.
For case II, and because of the opposite streamline structure already seen in figures 7 and 8 compared to figure 6, the vorticity field still have both positive and negative values at first z location as shown in figure 17. Now, compare to case I, only positive values remain for increasing z positions inside the pump inlet pipe (figs 18 to 20). These evolutions can also be seen looking at tangential velocity contours on figs 21 to 24.
Maximum tangential velocities reach a maximum value of about 30 per cent of mean velocity V inside the pipe.
Except first z location where both positive and negative tangential velocities still remain, flow mainly got a counter clockwise rotation inside the pump inlet pipe with expected decreasing values of tangential velocities for increasing z locations due to wall friction. These results show that, among the two main swirls that can be observed from free surface, the strongest one corresponds to the swirl created because of inlet velocity gradient. This is confirm looking at figure 8 and figures 25 to 32 corresponding to test case III for which the inlet velocity field creates a counter clockwise vortex similar to case II but stronger due to stronger velocity gradient as shown in figure 3. The more the inlet gradient is strong, the more tangential velocity remains inside the pipe. More detailed investigations show that the inlet pipe velocity field is more sensitive to inlet velocity field than asymmetric tube position in the sump such as case I configuration.
Figure 6. Streamline at the free surface-case I
Figure 7. Streamline at the free surface-case II
Figure 9. Vorticity-z=0.075D-case I
Figure 10. Vorticity-z=0.125D-case I
Figure 11 Vorticity-z=0.175D-case I
Figure 12. Vorticity-z=0.25D-case I
Figure 13. Tangential Velocity-z=0.075D-case I
Figure 14. Tangential Velocity-z=0.125D-case I
Figure 15. Tangential Velocity-z=0.175D-case I
Figure 17. Vorticity-z=0.075D-case II
Figure 18. Vorticity at z=0.125D-case II
Figure 19. Vorticity-z=0.175D-case II
Figure 20. Vorticity-z=0.25D-case II
Figure 21. Tangential Velocity-z=0.075D-case II
Figure 22. Tangential Velocity-z=0.125D-case II
Figure 23. Tangential Velocity-z=0.175D-case II
Figure 25. Vorticity-z=0.075D-case III
Figure 26. Vorticity at z=0.125D-case III
Figure 27. Vorticity-z=0.175D-case III
Figure 28. Vorticity-z=0.25D-case III
Figure 29. Tangential Velocity-z=0.075D-case III
Figure 30. Tangential Velocity-z=0.125D-case III
Figure 31. Tangential Velocity-z=0.175D-case III
7. CONCLUSION
3D flow calculations have been performed on a sump configuration in order to evaluate the sensitivity on both asymmetric geometrical and velocity field configuration on the inlet intake pipe.
This study complete a previous one already published for which other parameters have been studied for symmetrical configurations. Numerical results show that a slight modification on inlet flow conditions can have a relative strong effect on the incoming flow pattern inside the pump intake pipe. This may create tangential velocity inlet flow conditions that cannot be easily damped even with modified sump configuration that can be sometime seen. This also means that it will be very difficult to analyse such flows in research configuration if one wants to compare experiments and calculations for example for uniform inlet flow conditions which are difficult to obtain in an experimental set up.
REFERENCES
[1] Abir Issa, Annie-Claude Bayeul-Lainé, Gérard Bois , 2008, “Numerical Simulation of Flow Field Formed in Water Pump-Sump”, 24h Symposium Hydraulic Machinery Systems. Bresil.
[2] Melville, B. W. Ettema, R., and Nakato, T. 1994, “Review of flow problems at water intake Pump Sumps”, EPRI Res. Proj. PR3456-01 Final Rep. Iowa Inst.of Hydr. THE Univ of Iowa. Iowa City. pp. II.61 - II.68.
[3] Nakato, T. 1988, “Hydraulic-Labortatory Model Studies of the Circulation-Water Pump-Intake Structure, Florida Power Corporation, Crystal River. Units 4 and 5”, IIHR Rep. No.320, Iowa Inst.of Hydr. THE Univ of Iowa. Iowa City.
[4] Nakato, T. 1989, “A Hydraulic-Model Study of the Circulation-Water Pump-Intake Structure”, Laguna Verde Nuclear Power Station, Unit. 1, Comision Federal De Electrcidad. IIHR Rep. No.330, Iowa Inst.of Hydr. The Univ of Iowa. Iowa City
[5] Nakato, T. 1990, “A Hydraulic-Model Study of the Proposed Pump-Intake and Discharge Flume Crystal River Cooling-Tower Project”, IIHR Rep. No.339, Iowa Inst.of Hydr. THE Univ of Iowa. Iowa City
[6] Ettema, R., and Nakato, T, 1990, “Hydraulic- Model Study of the Circulation-Water and
Essential-Service-Water Pump-Intake structures: Korea Electric Power Corporation
Yonggwag Station, Units 3 and 4”, IIHR Limited Distribution Rep. No.339, Iowa Inst.of Hydr. THE Univ of Iowa. Iowa City. Iowa.
[7] Anwar, H. O., 1966, “Formation of a Weak Vortex” J. Hydr. Res., 4(1), 1-16
[8] Anwar, H. O., and Amphlett, M. B., 1980, “Vortices at Vertically in Verted Intake”, J. Hydr. Res., 18(2), 123-134
[9] Daggett, L. L., and Keulegan, G. H., 1972, “Similitude Conditions in Free Surface Vortex Formation”, J. Hydr. Div., ASCE. 100(11), 1565-1580
[10] Tagamori, M.,and Gotoh, M., 1989, “ Flow Patterns and Vortices in pumps sumps” Proc., Int. Symp. Large Hydr. Machienry.China Press, Beijing. China, 13-22
[11] Takata, I., Kawata, Y., Kobayashi, T., and Morinishi, Y., 1992, “Large-Eddy Simulation of Unsteady Turbulent Swirl Flow in a pump Intake”, 1 st Computational Fluid Dyn. Eur. Conf., Elsevier Applied Science, New York, 255-261
[12] Matsui, J., Kamemoto, K., and Okamura. T., 2006,” CFD Benchmrak and a Model Experiment on the Flow in Pump Sump”. 23TH Symposuim. Yokohama. 1(10)-(16)
[13] Constantineascu, G., and Patel, V. C., 1998, ”Numerical Model for Simulation of Pump Intake Flow and Vortices”. Jounal of hydraulic Engineering. Div, ASCE, vol 124, 123-134. Iowa Inst of Hydr Res. The Univ of Iowa. Iowa City, Iowa.