1
Assessment of growth and survival of Listeria monocytogenes in raw milk butter by
1
durability tests
2
Growth assessment of Listeria monocytogenes in butter
3
El-Hajjaji Soundous1, Gérard Amaury1, De Laubier Juliette1, Di Tanna Sybille1, Lainé 4
Aurélie1, Patz Viviane1, Sindic Marianne1 5
1
Laboratory of Quality and Safety of Agro-food Products, Gembloux Agro-Bio Tech, 6
University of Liège, Passage des Déportés, 2, 5030 Gembloux, Belgium. 7
8 9
Corresponding author: 10
El-Hajjaji Soundous (email: soundous.el-hajjaji@student.uliege.be) 11
University of Liège - Gembloux Agro-Bio Tech 12
Passage des Déportés, 2 13
B-5030 Gembloux. 14
2
Abstract
15
Butter is a complex matrix characterized by a high fat content. Existing publications on the 16
behavior of Listeria monocytogenes in this type of food reported contrasted results. This study 17
was performed to provide further information and data about raw milk butter’s ability to 18
support survival or growth of L. monocytogenes. Durability tests were performed on naturally 19
contaminated samples of raw milk butter with various physico-chemical characteristics. At 20
the end of shelf life, no growth of L. monocytogenes was observed in the studied butters, 21
regardless of their physico-chemical characteristics (pH, aw, water dispersion index and salt 22
concentration) and the initial level of contamination. The number of positive samples and the 23
colony counts of L. monocytogenes were even decreased at the end of the storage period. 24
Key words: pathogen, dairy product, storage, growth potential, intrinsic factors
3
1. Introduction
26
During the period 2008-2016, the European Union knew an increase of confirmed cases of 27
listeriosis, which was reported as the most severe zoonosis (European Food Safety Authority 28
and European Centre for Disease Prevention and Control, 2017). Listeriosis is a foodborne 29
infection characterized by gastroenteritis, meningitis, septicemia, abortion and sometimes 30
death. Its lethality rate is over 25% (Buchanan et al., 2017; Jordan et al., 2016). High risk 31
populations, i.e. pregnant women, newborn, immunocompromised individuals and the elderly 32
in particular, are the most susceptible to listeriosis (Gillespie et al., 2010; Goulet et al., 2008; 33
McLauchlin et al., 2004). Listeria monocytogenes is the causative agent of this infection. It 34
has the ability to grow in a wide range of temperature (-1.5°C to 45°C) with an optimum 35
between 30°C and 37°C, and at pH levels between 4.4 and 9.6 (Buchanan et al., 2004; 36
Magalhães et al., 2014). It can also survive in high salt concentrations (up to 10% of NaCl) 37
(Cole et al., 1990; Liu et al., 2005). 38
The European Commission regulation (EC) N° 2073/2005 on microbiological criteria for 39
foodstuffs has established safety criteria for ready-to-eat (RTE) foods other than those 40
intended for infants and for special medical purposes, as regards L. monocytogenes, 41
depending on their characteristics (pH and water activity), the possible growth of L. 42
monocytogenes and the stage where the criterion applies. If growth is not possible, the
43
regulation imposes a number of counts ≤ 100 cfu/g in the five units comprising the sample 44
(n=5). This criterion is also applied for products with pH ≤ 4.4 or aw ≤ 0.92, products with pH 45
≤ 5.0 and aw ≤ 0.94, and products with a shelf life of less than five days. It can also be applied 46
to other products subject to scientific justification. Otherwise, the regulation imposes an 47
absence of this pathogen in 25g (n=5) before the food has left the immediate control of the 48
producer, unless the latter is able to demonstrate that his product will not exceed the limit 100 49
cfu/g throughout the shelf-life (EC, 2005). 50
4
In a number of studies, it is reported that L. monocytogenes can be present in butter (made of 51
raw or pasteurized milk), and that listeriosis outbreaks have been caused by contaminated 52
butter in USA (Ryser and Marth, 1999), Finland (Lyytikäinen et al., 2000) and England 53
(Advisory Committee on the Microbiological Safety of Food, 2003). Based on these previous 54
findings, butter can be considered as RTE food potentially allowing growth of this pathogen. 55
These records have led researchers to take interest in the behavior of L. monocytogenes in 56
butter. Existing publications are not sufficient to determine butter’s ability to support survival 57
or growth of L. monocytogenes. 58
The purpose of this study was to assess growth and survival of L. monocytogenes in raw milk 59
butter during shelf life. 60
2. Materials and methods
61
This study was conducted in two parts. In the first one, durability tests were performed on 62
naturally contaminated samples of butter. Both physico-chemical and microbiological 63
characteristics were determined. In the second part, samples of raw milk butter were collected 64
from the Walloon market and were analyzed for physico-chemical characteristics only. 65
2.1. Durability tests 66
2.1.1. Samples 67
Twenty different batches of raw milk butter, with no preservatives, naturally contaminated 68
with L. monocytogenes were collected from 20 different farms in Wallonia. A certain 69
procedure was to be followed: (a) detection of L. monocytogenes following a request for 70
analysis by the producer or the authority, (b) requesting a permission to take the contaminated 71
batches once being informed, and (c) contacting the laboratory. This whole procedure took at 72
least one week. Only batches that were no more than 14 days old were considered, in order to 73
have a significant evolution of L. monocytogenes over time. 74
5
The samples were sent refrigerated (max 7°C) to the food laboratory of CdL (Comité de Lait, 75
Battice, Belgium) for durability test. 76
2.1.2. Storage conditions 77
Depending on the age of the butter upon arrival at the laboratory, different preservation 78
conditions were applied. If the samples were more than seven days old, they were stored at 79
12°C until the end of shelf life. Otherwise, they were kept at 7°C until the seventh day after 80
the production, and then stored at 12°C to simulate a break in the cold chain. These storage 81
temperatures and periods were chosen to reflect the foreseeable conditions of distribution and 82
storage as advised by the “EURL-Lm technical guidance document for conducting shelf-life 83
studies on L. monocytogenes in ready-to-eat foods” (EURL Lm, 2014). A storage period of 30 84
days, from the moment of manufacture, was chosen for the samples of raw milk butter in 85
order to cover most of those encountered in the market. 86
2.1.3. Microbiological and physico chemical analyses 87
For each batch of raw milk butter, physico-chemical (pH, water activity, NaCl content based 88
on sodium determination in serum phase and water distribution) and microbiological 89
characteristics (L. monocytogenes (detection and enumeration), Escherichia coli, coagulase 90
positive Staphylococci, Pseudomonas spp., total aerobic flora, yeasts and molds) were 91
determined at the reception of the samples (“day 0”) and at the end of the shelf life (30 days 92
after the day of manufacture: “day 30”). A batch of butter consists of several subunits on 93
which the repetitions of the analyses are carried out. For L. monocytogenes, 30 samples are 94
analyzed at “day 0” and 30 at “day 30”. All analyses were performed according to standard 95
methods. Table 1 summarizes the parameters analyzed with the number of repetition and the 96
method applied for each parameter. 97
2.1.4. Statistical analysis 98
6
Confidence interval: The estimated proportion of units exceeding 100 cfu/g and the 99
confidence interval associated were determined using a Bayesian calculator. The calculation 100
was based on the central confidence interval. 101
Growth potential: it is an estimation of the difference between the median of count results at 102
the end of shelf-life in log cfu/g and the median of results at the beginning. Before the log 103
transformation, some conditions were applied to the raw quantitative data relative to L. 104
monocytogenes. An enumeration value of 9 cfu/g was fixed in case of < 10 cfu/g (the limit of
105
enumeration of the method). On the other hand, a value of 0.04 cfu/g (1 cfu/25g) was used if 106
an absence of L. monocytogenes was found in 25g. 107
Statistical analyses were carried out with R software, version 3.3.3. To evaluate the significant 108
differences and mean values, Student test or Wilcoxon test were applied depending on the 109
normality of data. Statistical significance was defined when a p-value was below 0.05. 110
The relationship between the intrinsic factors at “day 0” and L. monocytogenes was estimated 111
using Pearson correlation coefficient. 112
2.2. Physico-chemical characterization of raw milk butters from the market 113
In order to ascertain that the intrinsic factors of the samples analyzed by storage are 114
representative of those encountered in the Walloon market, 144 raw milk butters were 115
collected from 61 different farms in Wallonia. The collection was organized over two periods. 116
The first one occurred between December 2017 and January 2018, and the second one 117
occurred between May and June 2018. The samples were transported refrigerated to the 118
laboratory LARECO (LAboratoire de REcherches et de COnseils, Marche-en-Famenne, 119
Belgium) where pH and water activity (aw) analysis were performed on each sample 120
according to ISO 7238 and ISO 21807 respectively. A water dispersion test (Wator test) was 121
also carried out according to ISO 7586. To determine the number and size of the water 122
droplets, the processing and analysis of the images of indicator paper “wator”, scanned 123
7
beforehand in a resolution of 600 dpi (dots per inch), was carried out with ImageJ 1.51s 124
Freeware (Rueden et al., 2017; Schindelin et al., 2012). When necessary, the droplets contour 125
was defined manually using the “eraser” tool, and the white holes in the black spots were 126
filled with the command “fill holes”. The size of the water droplets was expressed by the 127
Feret’s diameter which is the distance between two parallel tangents on opposite sides of the
128
profile of a particle (Merkus, 2009). The mean number and the mean size of the droplets for 129
each group were then calculated. 130
Statistical analyses were carried out with R software, version 3.3.3. To evaluate the significant 131
differences and mean values, Student test (normally distributed data as indicated by Shapiro 132
Wilk test, p > 0.05) or Wilcoxon test (non normally distributed data) were applied. Statistical 133
significance was defined when a p-value was below 0.05. 134 3. Results 135 3.1. Physico-chemical characterization 136 3.1.1. Durability tests 137
Contaminated samples of butter were collected for durability studies. The physico-chemical 138
and microbiological characteristics were both determined. 139
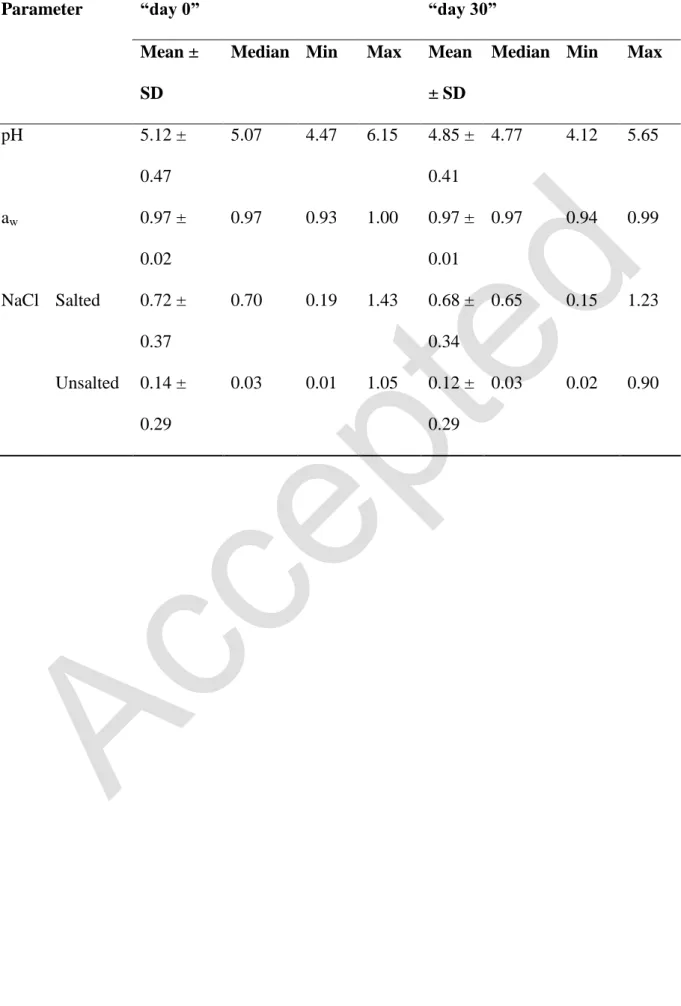
The analyzed samples presented a wide variation in terms of pH. The pH values obtained at 140
“day 0” ranged from 4.47 to 6.15, with a mean value of 5.12 ± 0.47 (Table 2). However, a 141
significant decrease of pH values was observed at the end of shelf life (“day 30”) with a mean 142
value of 4.85 ± 0.41. 143
The values of aw ranged from 0.93 to 1.00 with a mean value 0.97 ± 0.02 at “day 0”, and 144
from 0.94 to 0.99 with a mean value 0.97 ± 0.01 at “day 30”. 145
Within the batches of raw milk butter collected, 40 % were salted. The maximum salt content 146
observed was 1.43% (mg/100 mg) of NaCl. 147
8
Regarding water dispersion, all the samples were classified high in the grading scale (scale 148
units 1 and 2A), as they presented a lot of relatively large water droplets. 149
3.1.2. Raw milk butters from the market 150
Additional raw milk butter samples from all over Wallonia were collected for physico-151
chemical characterization. The pH of the raw milk butter samples ranged from 4.25 to 6.50 152
with an average of 5.12 ± 0.61 (Table 3). The values of pH of raw milk butters collected in 153
the first period were not different from those collected in the second period (p-value 0.39). 154
Also, no difference was found between these samples and those from the durability tests (p-155
value 0.50). 156
For water activity, the values obtained for raw milk butters varied from 0.91 to 1.00 with a 157
mean value of 0.98 ± 0.02. 158
The water dispersion values of butter samples found using the grading scale presented in the 159
standard are listed in Table 4. More than half of the samples were classified “high” in the 160
grading scale (scale units 1 and 2A). These are characterized by many droplets (about 5 161
droplets/ cm²) with relatively large size (about 2 mm). An example is shown in Figure 1. 162
3.2. Microbial profile of raw milk butter samples analyzed by durability tests 163
Beside L. monocytogenes, Escherichia coli, coagulase positive Staphylococcus, Pseudomonas 164
spp., total aerobic flora, yeasts and molds were also analyzed. E. coli and Staphylococcus are 165
generally used as hygienic indicators to examine food processing, while Pseudomonas spp., 166
yeasts and molds are related to food spoilage. 167
The results of E. coli at “day 0” showed that only 19 % of the samples were below 1.0 log 168
cfu/g, while 14 % were between 1.0 and 2.0 log cfu/g and 67 % of the samples exceeded 2.0 169
log cfu/g. The mean number of colonies detected at “day 0” was 3.0 log cfu/g. Concerning 170
Staphylococcus, 44 % of the samples exceeded the threshold limit of enumeration 1.0 log
9
cfu/g. Overall, at the end of the storage period, a decrease in E. coli and Staphylococcus was 172
observed. 173
It appears also from the results that butter samples have a relatively high total bacterial count, 174
reaching 7.7 log cfu/g. The data displayed in Table 5 indicate that yeasts and molds counts at 175
“day 0” ranged from 1.0 to 7.5 log cfu/g and from 0.9 to 4.7 log cfu/g respectively. The 176
samples showed a significant increase in yeasts and molds counts at the end of storage period 177
compared to “day 0”. The samples had also high counts of Pseudomonas spp. that reached 7.6 178
log cfu/g. 179
3.3. Behavior of L. monocytogenes in raw milk butter samples analyzed by durability tests 180
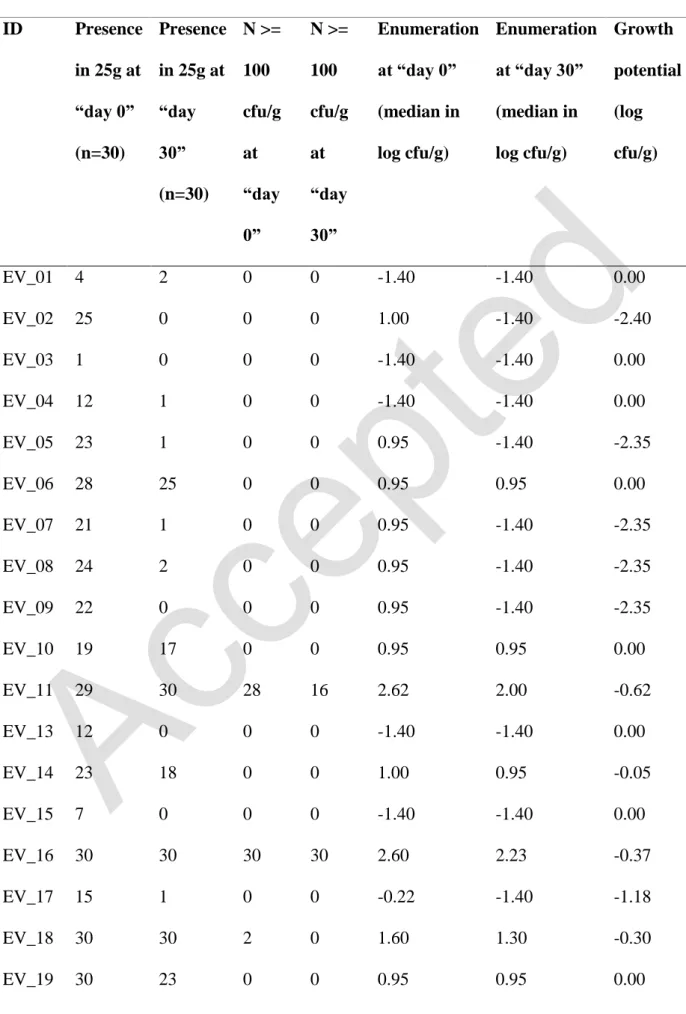
For each batch of butter naturally contaminated with L. monocytogenes, 30 samples were 181
analyzed at the beginning and at the end of the storage period. L. monocytogenes was detected 182
in 66 % (398 presences) of the samples analyzed at “day 0”. Of these, 40 % had a 183
contamination level of less than 1.0 log cfu/g, 16% between 1.0 and 2.0 log cfu/g, and the 184
remaining 10 % had a contamination level beyond the critical limit of 2.0 log cfu/g. The 185
results of the latter samples were not interpreted with the rest, since the objective behind the 186
durability test consisted in verifying that the limit of 100 cfu/g is not exceeded at the end of 187
the storage period. It was found that high level of L. monocytogenes is correlated with high 188
pH and aw values (correlation coefficient of 0.39 and 0.29 respectively). In contrast, salt had 189
an inverse effect on L. monocytogenes (correlation coefficient of -0.17), compared to pH and 190
aw. However, no statistical relationship was found (p value > 0.05). 191
At the end of the storage period, no growth of L. monocytogenes was observed in any of the 192
batches. An estimated growth potential of 0.0 was the highest value obtained. For the batches 193
with a contamination level at the beginning below 2.0 log cfu/g, the estimated proportion of 194
units exceeding this value at the end of shelf life was 0.0 % with a confidence interval at 95 % 195
of [0.0 % - 0.6 %]. A decrease of L. monocytogenes was also observed in the samples 196
10
exceeding 2.0 log cfu/g with a highest estimated growth potential value of -0.3 (Table 6). It 197
was found that growth potential is positively correlated with pH and aw values (correlation 198
coefficient of 0.41 and 0.16 respectively). In contrast, high salt content implies low growth 199
potential (correlation coefficient of -0.41). However, no statistical relationship was found (p 200
value > 0.05). 201
4. Discussion
202
In this study, the behavior of L. monocytogenes was investigated in a range of raw milk 203
butters with various physico-chemical characteristics, in order to determine whether or not 204
this product supports the growth of the pathogen. Durability studies were performed on 205
naturally contaminated samples stored for 30 days at conditions that reflected the reality. 206
The findings of this study showed that, in most of the contaminated samples, the levels of L. 207
monocytogenes in raw milk butter were low (< 10 cfu/g). The same result were reported by
208
Kozak et al. (1996), Lewis et al. (2006) and N’Guessan et al. (2015). It was also found that, 209
not only L. monocytogenes did not grow in this product, but it even decreased. Yet the 210
samples showed pH and aw values favorable for the growth of the pathogen (Tables 7a and 211
7b). Indeed, L. monocytogenes has optimal growth rates at aw ≥ 0.98 and a pH value between 212
6.00 and 8.00, while growth stops below aw of 0.92 and pH of 4.40 (Buchanan et al., 2004; 213
Hitchins and Whiting, 2001). However, the durability test samples had pH and aw values that 214
ranged from 4.47 to 6.15 and from 0.93 to 1.00 respectively, which were relatively similar to 215
those observed in the market samples (Tables 2 and 3). 216
The results relative to the growth of L. monocytogenes in butter were in accordance with those 217
reported by Michelon et al. (2016) who observed no growth of the pathogen in the tested 218
samples of churned butters and commercial milk fat products (pH < 5.80). The levels of the 219
bacterium remained however stable during shelf life. This may be explained by the fact that 220
the products studied by Michelon et al. (2016) were made from pasteurized cream, which 221
11
reduced the microbial concentration and so, the nutritional competition. The same reason 222
could explain the increase of L. monocytogenes in “sweet cream whipped salted butter” 223
reported by Holliday et al. (2003). The product was made from pasteurized cream with 224
absence of preservatives. 225
The size and distribution of water droplets was another characteristic to observe regarding 226
bacterial growth. Bullock and Kenney (1969) found that bacterial counts after the storage 227
period were three to four times higher in the low fat dairy spreads with large serum droplets 228
(> 50 microns), compared to the products with small droplets (3 to 20 microns). Studies have 229
also demonstrated that water droplets size and distribution is a key parameter in preventing 230
the growth of L. monocytogenes (Michelon et al., 2016; Voysey et al., 2009). Voysey et al. 231
(2009) observed that L. monocytogenes grew easily in coarse butter with large water droplets 232
size. In this study, butter samples had in general large water droplets (about 2 mm), which is 233
favorable for the growth of microorganisms. However, no growth was observed in any of the 234
samples. This could be due to the fact that the initial level of L. monocytogenes of the 235
contaminated samples was much lower than that used by Voysey et al. (2009). 236
In this study, the samples showed various microbial profiles in terms of E. coli, 237
Staphylococcus, Pseudomonas spp., total aerobic flora, yeasts and molds. De Reu et al. (2004)
238
noted that the high colony counts of the hygiene indicators coliforms, E. coli and 239
Staphylococcus aureus are related to the presence of Listeria spp. in raw milk butter, although
240
no significant statistical relationship was found. Unlike E. coli and S. aureus, an increase in 241
yeasts and molds involves a decrease in L. monocytogenes. According to a study conducted 242
by Goerges et al. (2006), all tested yeasts had an inhibitory potential on L. monocytogenes. 243
The authors related this result to the competition for nutrients. Pseudomonas spp. was also 244
reported as an effective competitor of L. monocytogenes (Farrag and Marth, 1989). This 245
psychrotrophic bacterium showed exhibited wide spectrum antimicrobial activity against L. 246
12
monocytogenes among other Gram positive bacteria (Cheng et al., 1995; Freedman et al.,
247
1989; Gram, 1993). The findings of this study showed that the presence and the levels of L. 248
monocytogenes in the samples decreased regardless of the levels of the other bacteria. This
249
result could be due to the presence of other microorganisms like lactic acid bacteria. Ahamad 250
and Marth (1989) have reported that lactic acid had an inhibitory effect on L. monocytogenes. 251
Bacteriocins, one of the many antimicrobial substances produced by lactic acid bacteria, have 252
also been identified as exhibiting activity against L. monocytogenes (Chen and Hoover, 2003; 253
Dortu and Thonart, 2009; Jordan et al., 2016). 254
5. Conclusion
255
No growth was observed in the samples of naturally contaminated butter analyzed with 256
durability test. The number of contaminated samples and the colony counts of L. 257
monocytogenes even decreased at the end of the storage period. The durability tests performed
258
show that raw milk butter does not allow the growth of the pathogen regardless of its physico-259
chemical and microbiological characteristics. Nevertheless, an analysis on raw milk butter 260
with high pH value (pH > 6.2) would be interesting to support these findings. This study 261
suggested that the behavior of L. monocytogenes in raw milk butter could be affected by other 262
parameters like the microbiota, especially lactic acid bacteria. It would be of interest to study 263
the evolution of the pathogen in butter compared to that of microbiota. 264
Acknowledgments
265
This study was conducted with the financial support of the Service Public of Wallonia (SPW). 266
The authors are thankful to the producers who agreed to give their batches for analysis. They 267
are also thankful to the food laboratory of CdL and LARECO for carrying out the analyses. 268
The authors also thank Valérie Michel for her instructions regarding data interpretation. 269
13
References
270
Advisory Committee on the Microbiological Safety of Food, 2003. Recent trends in listeriosis 271
in the UK. 272
Ahamad, N., Marth, E.H., 1989. Behavior of Listeria monocytogenes at 7, 13, 21, and 35°C in 273
Tryptose Broth Acidified with Acetic, Citric, or Lactic Acid. J. Food Prot. 52, 688– 274
695. https://doi.org/10.4315/0362-028X-52.10.688 275
Buchanan, R., Lindqvist, R., Ross, T., Smith, M., Todd, E., Whiting, R., 2004. Risk 276
assessment of <i>Listeria monocytogenes<i/> in ready-to-eat foods, Microbiological 277
risk assessment series. Food and Agriculture Organization of the United Nations ; 278
World Health Organization, Rome : Geneva, Switzerland. 279
Buchanan, R.L., Gorris, L.G.M., Hayman, M.M., Jackson, T.C., Whiting, R.C., 2017. A 280
review of Listeria monocytogenes: An update on outbreaks, virulence, dose-response, 281
ecology, and risk assessments. Food Control 75, 1–13. 282
https://doi.org/10.1016/j.foodcont.2016.12.016 283
Bullock, D.H., Kenney, A.R., 1969. Effect of emulsion characteristics of a low-fat dairy 284
spread on bacterial growth. J. Dairy Sci. 52, 625–628. 285
Chen, H., Hoover, D.G., 2003. Bacteriocins and their Food Applications. Compr. Rev. Food 286
Sci. Food Saf. 2, 82–100. https://doi.org/10.1111/j.1541-4337.2003.tb00016.x 287
Cheng, C.-M., Doyle, M.P., Luchansky, J.B., 1995. Identification of Pseudomonas 288
fluorescens strains isolated from raw pork and chicken that produce siderophores
289
antagonistic towards foodborne pathogens. J. Food Prot. 58, 1340–1344. 290
Cole, M.B., Jones, M.V., Holyoak, C., 1990. The effect of pH, salt concentration and 291
temperature on the survival and growth of Listeria monocytogenes. J. Appl. Microbiol. 292
69, 63–72. 293
14
De Reu, K., Grijspeerdt, K., Herman, L., 2004. A Belgian survey of hygiene indicator bacteria 294
and pathogenic bacteria in raw milk and direct marketing of raw milk farm products. J. 295
Food Saf. 24, 17–36. 296
Dortu, C., Thonart, P., 2009. Les bactériocines des bactéries lactiques: caractéristiques et 297
intérêts pour la bioconservation des produits alimentaires/Bacteriocins from lactic acid 298
bacteria: interest for food products biopreservation. Biotechnol. Agron. Société 299
Environ. 13, 143. 300
EC, 2005. Commission Regulation (EC) N° 2073/2005 of 15 November 2005 on 301
microbiological criteria for foodstuffs. 302
EURL Lm, 2014. Technical Guidance Document for conducting shelf-life studies on Listeria 303
monocytogenes in ready-to-eat foods.
304
European Food Safety Authority, European Centre for Disease Prevention and Control, 2017. 305
The European Union summary report on trends and sources of zoonoses, zoonotic 306
agents and food‐borne outbreaks in 2016. EFSA J. 15. 307
https://doi.org/10.2903/j.efsa.2017.5077 308
Farrag, S.A., Marth, E.H., 1989. Behavior of Listeria monocytogenes when incubated together 309
with Pseudomonas species in tryptose broth at 7 and 13 C. J. Food Prot. 52, 536–539. 310
Freedman, D.J., Kondo, J.K., Willrett, D.L., 1989. Antagonism of foodborne bacteria by 311
Pseudomonas spp.: a possible role for iron. J. Food Prot. 52, 484–489.
312
Gillespie, I.A., Mook, P., Little, C.L., Grant, K., Adak, G.K., 2010. Listeria monocytogenes 313
infection in the Over-60s in England between 2005 and 2008: A retrospective case– 314
control study utilizing market research panel data. Foodborne Pathog. Dis. 7, 1373– 315
1379. 316
15
Goerges, S., Aigner, U., Silakowski, B., Scherer, S., 2006. Inhibition of Listeria 317
monocytogenes by food-borne yeasts. Appl. Environ. Microbiol. 72, 313–318.
318
https://doi.org/10.1128/AEM.72.1.313-318.2006 319
Goulet, V., Hedberg, C., Le Monnier, A., De Valk, H., 2008. Increasing incidence of 320
listeriosis in France and other European countries. Emerg. Infect. Dis. 14, 734. 321
Gram, L., 1993. Inhibitory effect against pathogenic and spoilage bacteria of Pseudomonas 322
strains isolated from spoiled and fresh fish. Appl. Environ. Microbiol. 59, 2197–2203. 323
Hitchins, A.D., Whiting, R.C., 2001. Food-borne Listeria monocytogenes risk assessment. 324
Food Addit. Contam. 18, 1108–1117. https://doi.org/10.1080/02652030110050104 325
Holliday, S.L., Adler, B.B., Beuchat, L.R., 2003. Viability of Salmonella, Escherichia coli 326
O157: H7, and Listeria monocytogenes in butter, yellow fat spreads, and margarine as 327
affected by temperature and physical abuse. Food Microbiol. 20, 159–168. 328
Jordan, K., Hunt, K., Dalmasso, M., 2016. Listeria monocytogenes in milk products, in: Garg, 329
N., Abdel-Aziz, S.M., Aeron, A. (Eds.), Microbes in Food and Health. Springer 330
International Publishing, pp. 289–315. https://doi.org/10.1007/978-3-319-25277-3_15 331
Kozak, J., Balmer, T., Byrne, R., Fisher, K., 1996. Prevalence of Listeria monocytogenes in 332
foods: incidence in dairy products. Food Control 7, 215–221. 333
Lewis, H.C., Little, C.L., Elson, R., Greenwood, M., Grant, K.A., McLauchlin, J., 2006. 334
Prevalence of Listeria monocytogenes and other Listeria species in butter from United 335
Kingdom production, retail, and catering premises. J. Food Prot. 69, 1518–1526. 336
Liu, D., Lawrence, M.L., Ainsworth, A.J., Austin, F.W., 2005. Comparative assessment of 337
acid, alkali and salt tolerance in Listeria monocytogenes virulent and avirulent strains. 338
FEMS Microbiol. Lett. 243, 373–378. https://doi.org/10.1016/j.femsle.2004.12.025 339
Lyytikäinen, O., Autio, T., Maijala, R., Ruutu, P., Honkanen-Buzalski, T., Miettinen, M., 340
Hatakka, M., Mikkola, J., Anttila, V.J., Johansson, T., others, 2000. An outbreak of 341
16
Listeria monocytogenes serotype 3a infections from butter in Finland. J. Infect. Dis.
342
181, 1838–1841. 343
Magalhães, R., Mena, C., Ferreira, V., Silva, J., Almeida, G., Gibbs, P., Teixeira, P., 2014. 344
Bacteria: Listeria monocytogenes, in: Encyclopedia of Food Safety. Elsevier, pp. 450– 345
461. https://doi.org/10.1016/B978-0-12-378612-8.00101-3 346
McLauchlin, J., Mitchell, R.T., Smerdon, W.J., Jewell, K., 2004. Listeria monocytogenes and 347
listeriosis: a review of hazard characterisation for use in microbiological risk 348
assessment of foods. Int. J. Food Microbiol. 92, 15–33. https://doi.org/10.1016/S0168-349
1605(03)00326-X 350
Merkus, H.G., 2009. Particle Size Measurements: Fundamentals, Practice, Quality. Springer 351
Science & Business Media. 352
Michelon, D., Leclercq, A., Garric, G., Guillier, L., Beaufort, A., Bergis, H., 2016. Growth 353
Potential Assessment of Listeria in milk fat products by challenge testing: Growth 354
potential of Listeria in milk fat products. J. Food Saf. 36, 260–270. 355
https://doi.org/10.1111/jfs.12239 356
N’Guessan, E., Godrie, T., De Laubier, J., Di Tanna, S., Ringuet, M., Sindic, M., 2015. A 357
survey of bacteria found in Belgian dairy farm products. Biotechnol. Agron. Société 358
Environ. 19, 346–354. 359
Rueden, C.T., Schindelin, J., Hiner, M.C., DeZonia, B.E., Walter, A.E., Arena, E.T., Eliceiri, 360
K.W., 2017. ImageJ2: ImageJ for the next generation of scientific image data. BMC 361
Bioinformatics 18. https://doi.org/10.1186/s12859-017-1934-z 362
Ryser, E.T., Marth, E.H., 1999. Listeria, listeriosis, and food safety. Second Edition. CRC 363
Press. 364
Schindelin, J., Arganda-Carreras, I., Frise, E., Kaynig, V., Longair, M., Pietzsch, T., 365
Preibisch, S., Rueden, C., Saalfeld, S., Schmid, B., Tinevez, J.-Y., White, D.J., 366
17
Hartenstein, V., Eliceiri, K., Tomancak, P., Cardona, A., 2012. Fiji: an open-source 367
platform for biological-image analysis. Nat. Methods 9, 676. 368
Voysey, P.A., Anslow, P.A., Bridgwater, K.J., Lavender, B., Watson, L., 2009. The effects of 369
butter characteristics on the growth of Listeria monocytogenes. Int. J. Dairy Technol. 370
62, 326–330. https://doi.org/10.1111/j.1471-0307.2009.00505.x 371
18
Table 1: Physico-chemical and microbiological parameters analyzed during each durability
373
study, number of repetition and method applied for each parameter. 374
Parameter Number of
samples
Day of analysis* Method
Temperature (°C) 1 “day 0” /
Water dispersion 1 “day 0” ISO 7586
pH 5 “day 0” and “day 30” ISO 7238
Water activity (aw) 1 “day 0” and “day 30” ISO 21807 Salt (% of NaCl in mg/100
mg, water phase)
3 “day 0” and “day 30” ISO 8070 - Sodium determination L. monocytogenes
(presence/absence in 25g)
30 “day 0” and “day 30” Vidas LMO II
L. monocytogenes (cfu/g) 30 “day 0” and “day 30” ISO 11290-2
Escherichia coli (cfu/g) 3 “day 0” and “day 30” ISO 16649-2
Coagulase positive Staphylococcus (cfu/g)
3 “day 0” and “day 30” ISO 6888-2
Pseudomonas spp. (cfu/g) 3 “day 0” and “day 30” ISO 11059
Total aerobic flora at 22°C (cfu/g)
3 “day 0” and “day 30” Tempo AC
Yeasts (cfu/g) 3 “day 0” and “day 30” ISO 6611
Molds (cfu/g) 3 “day 0” and “day 30” ISO 6611
* “day 0” corresponds to the day of the first analysis after reception of the samples 375
“day 30” corresponds to the day 30 after production
19
Table 2: Physico-chemical characteristics of raw milk butters at “day 0” and “day 30”
377
Parameter “day 0” “day 30”
Mean ± SD
Median Min Max Mean
± SD
Median Min Max
pH 5.12 ± 0.47 5.07 4.47 6.15 4.85 ± 0.41 4.77 4.12 5.65 aw 0.97 ± 0.02 0.97 0.93 1.00 0.97 ± 0.01 0.97 0.94 0.99 NaCl Salted 0.72 ± 0.37 0.70 0.19 1.43 0.68 ± 0.34 0.65 0.15 1.23 Unsalted 0.14 ± 0.29 0.03 0.01 1.05 0.12 ± 0.29 0.03 0.02 0.90 378
20
Table 3: pH and aw of raw milk butters collected from the market during the two periods 379
Parameter Period of December and January (n = 75)
Period of May and June (n = 69)
Mean ± SD Median Min Max Mean ± SD Median Min Max
pH 5.10 ± 0.63 4.90 4.25 6.50 5.15 ± 0.58 4.95 4.40 6.50 aw 0.97 ± 0.02 0.98 0.91 0.99 0.98 ± 0.01 0.98 0.93 1.00 380
21
Table 4: Results of water dispersion, expressed by scale units, of raw milk butters collected
381
from the market 382
Scale units Number of droplets / cm² Droplets size (cm) Frequency Percentage (%) 1 5 ± 3 0.23 ± 0.05 64 44.4 2A 5 ± 2 0.18 ± 0.04 55 38.2 2B 5 ± 2 0.15 ± 0.02 15 10.4 2C NA NA 0 0.0 3A 2 ± 1 0.11 ± 0.01 3 2.1 3B 2 ± 2 0.14 ± 0.06 5 3.5 3C 1 ± 0 0.08 ± 0.00 1 0.7 4 NA NA 0 0.0 5 0.1 ± 0 0.09 ± 0.00 1 0.7 383
22
Table 5: Microbial profile of raw milk butter samples at “day 0” and “day 30”
384
Parameter “day 0” (log cfu/g) “day 30” (log cfu/g)
Mean ± SD
Median Min Max Mean
± SD
Median Min Max
Escherichia coli 3.01 ± 1.33 3.23 0.95 4.70 2.25 ± 1.60 1.15 0.95 5.48 Coagulase positive Staphylococci 1.93 ± 1.26 0.95 0.95 4.70 1.35 ± 0.85 0.95 0.95 4.17 Total aerobic flora 7.17 ± 0.63 7.69 5.48 7.69 7.17 ± 0.68 7.34 5.48 8.32 Yeasts 3.27 ± 1.27 3.04 1.00 7.48 4.91 ± 0.80 4.70 2.85 6.48 Molds 2.02 ± 1.04 1.78 0.95 4.70 3.12 ± 1.26 3.26 0.95 5.70 Pseudomonas spp. 5.73 ± 1.46 6.46 2.00 7.61 5.61 ± 1.29 5.98 3.00 7.74 385
23
Table 6: Results of durability tests realized on raw milk butter about L. monocytogenes
386 ID Presence in 25g at “day 0” (n=30) Presence in 25g at “day 30” (n=30) N >= 100 cfu/g at “day 0” N >= 100 cfu/g at “day 30” Enumeration at “day 0” (median in log cfu/g) Enumeration at “day 30” (median in log cfu/g) Growth potential (log cfu/g) EV_01 4 2 0 0 -1.40 -1.40 0.00 EV_02 25 0 0 0 1.00 -1.40 -2.40 EV_03 1 0 0 0 -1.40 -1.40 0.00 EV_04 12 1 0 0 -1.40 -1.40 0.00 EV_05 23 1 0 0 0.95 -1.40 -2.35 EV_06 28 25 0 0 0.95 0.95 0.00 EV_07 21 1 0 0 0.95 -1.40 -2.35 EV_08 24 2 0 0 0.95 -1.40 -2.35 EV_09 22 0 0 0 0.95 -1.40 -2.35 EV_10 19 17 0 0 0.95 0.95 0.00 EV_11 29 30 28 16 2.62 2.00 -0.62 EV_13 12 0 0 0 -1.40 -1.40 0.00 EV_14 23 18 0 0 1.00 0.95 -0.05 EV_15 7 0 0 0 -1.40 -1.40 0.00 EV_16 30 30 30 30 2.60 2.23 -0.37 EV_17 15 1 0 0 -0.22 -1.40 -1.18 EV_18 30 30 2 0 1.60 1.30 -0.30 EV_19 30 23 0 0 0.95 0.95 0.00
24
EV_20 22 24 0 0 0.95 0.95 0.00
25
Table 7a: Physico-chemical and microbiological characteristics of the batches at “day 0”
387 ID Starter cultures pH at "day 0" (mean ± SD) aw at "day 0" NaCl at "day 0" (mean ± SD in %NaCl ) L. monocytogenes at "day 0" (mean ± SD in log cfu/g ) E. coli at "day 0" (mean ± SD in log cfu/g ) Staphylococ ci at "day 0" (mean ± SD in log cfu/g ) Total aerobic flora at "day 0" (mean ± SD in log cfu/g ) Yeasts at "day 0" (mean ± SD in log cfu/g ) Molds at "day 0" (mean ± SD in log cfu/g ) Pseudomon as at "day 0" (mean ± SD in log cfu/g ) EV_01 yes 5.02 ± 0.06 0.97 0.19 ± 0.00 -1.08 ± 0.81 NA NA NA NA NA NA EV_02 yes 4.72 ± 0.06 0.93 0.52 ± 0.00 0.76 ± 1.01 NA NA NA NA NA NA EV_03 yes 4.62 ± 0.13 0.94 0.02 ± 0.00 -1.32 ± 0.43 0.95 ± 0.00 0.95 ± 0.00 5.48 ± 0.00 NA 4.70 ± 0.00 NA EV_04 no 5.49 ± 0.22 0.96 0.03 ± 0.00 -0.43 ± 1.21 0.95 ± 0.00 1.93 ± 0.22 7.69 ± 0.00 3.80 ± 0.10 3.02 ± 0.06 7.24 ± 0.54 EV_05 no 5.40 ± 0.17 0.98 1.35 ± 0.07 0.41 ± 1.01 3.21 ± 0.02 3.03 ± 0.05 7.69 ± 0.00 3.02 ± 0.25 1.55 ± 0.13 5.55 ± 0.72 EV_06 no 6.12 ± 0.04 0.97 0.02 ± 0.01 0.80 ± 0.60 3.88 ± 0.10 0.95 ± 0.00 7.62 ± 0.12 1.36 ± 0.39 1.46 ± 0.28 7.23 ± 0.15 EV_07 no 4.60 ± 0.09 0.97 0.65 ± 0.03 0.25 ± 1.10 3.91 ± 0.13 1.03 ± 0.13 7.59 ± 0.17 4.48 ± 0.00 0.95 ± 0.00 2.10 ± 0.18 EV_08 yes 4.72 ± 0.14 0.95 0.98 ± 0.07 0.48 ± 0.96 3.17 ± 0.15 1.68 ± 0.59 7.69 ± 0.00 2.80 ± 0.35 2.26 ± 0.83 4.87 ± 0.12 EV_09 no 4.60 ± 0.08 0.97 0.32 ± 0.05 0.33 ± 1.06 3.26 ± 0.07 0.95 ± 0.00 7.69 ± 0.00 2.55 ± 0.05 1.75 ± 0.05 4.64 ± 0.11 EV_10 no 5.42 ± 0.04 0.96 0.72 ± 0.05 0.09 ± 1.15 4.48 ± 0.00 3.65 ± 0.06 7.69 ± 0.00 3.25 ± 0.20 1.06 ± 0.10 6.23 ± 0.30 EV_11 no 5.42 ± 0.27 0.98 0.05 ± 0.01 2.51 ± 0.74 2.51 ± 0.04 4.70 ± 0.00 7.69 ± 0.00 3.23 ± 0.18 1.00 ± 0.00 6.48 ± 0.00
26 EV_13 no 4.54 ± 0.05 1.00 0.06 ± 0.01 -0.46 ± 1.17 1.26 ± 0.24 0.95 ± 0.00 7.69 ± 0.00 4.48 ± 0.00 3.62 ± 0.06 2.49 ± 0.50 EV_14 no 5.40 ± 0.06 0.95 0.83 ± 0.09 0.58 ± 1.12 4.48 ± 0.00 3.53 ± 0.08 7.69 ± 0.00 2.38 ± 0.22 1.46 ± 0.41 5.83 ± 0.16 EV_15 no 4.88 ± 0.08 0.97 1.02 ± 0.04 -0.85 ± 1.01 2.33 ± 0.08 0.95 ± 0.00 6.69 ± 0.00 4.07 ± 0.08 1.10 ± 0.17 6.48 ± 0.00 EV_16 no 5.20 ± 0.09 0.99 0.03 ± 0.00 2.57 ± 0.08 4.48 ± 0.00 0.95 ± 0.00 6.69 ± 0.00 3.00 ± 0.33 2.31 ± 0.24 6.48 ± 0.00 EV_17 yes 5.20 ± 0.19 0.97 0.30 ± 0.04 -0.16 ± 1.26 0.95 ± 0.00 0.95 ± 0.00 6.69 ± 0.00 2.24 ± 0.04 2.33 ± 0.14 5.75 ± 0.12 EV_18 no 5.50 ± 0.15 0.98 0.02 ± 0.01 1.48 ± 0.32 1.88 ± 0.09 0.95 ± 0.00 6.69 ± 0.00 6.72 ± 0.66 2.00 ± 0.00 6.48 ± 0.00 EV_19 no 5.85 ± 0.10 0.99 0.03 ± 0.00 0.95 ± 0.00 3.26 ± 0.04 2.82 ± 0.19 6.69 ± 0.00 2.09 ± 0.28 0.95 ± 0.00 6.48 ± 0.00 EV_20 no 4.67 ± 0.10 0.98 0.03 ± 0.01 0.37 ± 1.09 4.70 ± 0.00 3.74 ± 0.13 6.69 ± 0.00 4.05 ± 0.43 3.19 ± 0.37 6.70 ± 0.00 EV_21 no 4.83 ± 0.07 0.99 0.02 ± 0.01 0.26 ± 1.10 4.48 ± 0.00 0.95 ± 0.00 6.69 ± 0.00 2.01 ± 0.51 1.73 ± 0.05 6.32 ± 0.14 388
27
Table 7b: Physico-chemical and microbiological characteristics of the batches at “day 30”
389 ID pH at "day 30" (mean ± SD) aw at "day 30" NaCl at "day 30" (mean ± SD in %NaCl ) L. monocytogenes at "day 30" (mean ± SD in log cfu/g ) E. coli at "day 30" (mean ± SD in log cfu/g ) Staphylococ ci at "day 30" (mean ± SD in log cfu/g ) Total aerobic flora at "day 30" (mean ± SD in log cfu/g ) Yeasts at "day 30" (mean ± SD in log cfu/g ) Molds at "day 30" (mean ± SD in log cfu/g ) Pseudomonas at "day 30" (mean ± SD in log cfu/g ) EV_01 4.93 ± 0.05 0.95 0.15 ± 0.00 -1.24 ± 0.60 NA NA NA NA NA NA EV_02 4.53 ± 0.02 0.97 0.44 ± 0.00 -1.40 ± 0.00 NA NA NA NA NA NA EV_03 4.16 ± 0.04 0.97 0.02 ± 0.00 -1.40 ± 0.00 0.95 ± 0.00 0.95 ± 0.00 5.48 ± 0.00 NA 5.70 ± 0.00 NA EV_04 4.61 ± 0.05 0.98 0.02 ± 0.01 -1.32 ± 0.43 0.95 ± 0.00 0.95 ± 0.00 7.56 ± 0.19 4.48 ± 0.00 4.43 ± 0.42 6.00 ± 0.00 EV_05 5.27 ± 0.08 0.96 1.19 ± 0.04 -1.32 ± 0.43 1.07 ± 0.20 2.35 ± 0.16 7.09 ± 0.54 5.99 ± 0.09 3.65 ± 0.30 6.45 ± 0.32 EV_06 5.54 ± 0.04 0.98 0.02 ± 0.00 0.59 ± 0.91 3.86 ± 0.08 0.95 ± 0.00 7.53 ± 0.17 4.60 ± 0.15 1.85 ± 0.35 7.57 ± 0.22 EV_07 4.67 ± 0.06 0.97 0.65 ± 0.01 -1.32 ± 0.43 1.22 ± 0.42 0.95 ± 0.00 7.69 ± 0.00 4.48 ± 0.00 0.95 ± 0.00 6.23 ± 0.30 EV_08 4.55 ± 0.11 0.96 0.88 ± 0.03 -1.24 ± 0.60 0.95 ± 0.00 0.95 ± 0.00 6.64 ± 0.37 4.60 ± 1.52 3.34 ± 0.12 3.00 ± 0.00 EV_09 4.53 ± 0.07 0.97 0.36 ± 0.04 -1.40 ± 0.00 0.97 ± 0.03 0.95 ± 0.00 7.26 ± 0.17 4.48 ± 0.00 4.48 ± 0.00 3.00 ± 0.00 EV_10 5.35 ± 0.04 0.96 0.52 ± 0.01 -0.07 ± 1.19 5.48 ± 0.00 0.95 ± 0.00 8.01 ± 0.27 5.48 ± 0.00 1.47 ± 0.58 5.84 ± 0.10 EV_11 4.79 ± 0.03 0.99 0.05 ± 0.01 1.99 ± 0.11 1.81 ± 0.29 4.10 ± 0.06 7.96 ± 0.07 4.60 ± 0.39 3.48 ± 0.00 5.97 ± 0.09
28 EV_13 4.33 ± 0.02 0.98 0.05 ± 0.00 -1.40 ± 0.00 0.95 ± 0.00 0.95 ± 0.00 6.48 ± 1.06 4.51 ± 0.53 4.24 ± 0.47 3.71 ± 0.05 EV_14 5.38 ± 0.05 0.94 0.90 ± 0.09 0.01 ± 1.17 3.57 ± 0.18 0.95 ± 0.00 7.44 ± 0.23 4.48 ± 0.00 2.21 ± 0.49 6.67 ± 0.11 EV_15 4.74 ± 0.06 0.96 1.00 ± 0.01 -1.40 ± 0.00 0.95 ± 0.00 0.95 ± 0.00 7.31 ± 0.14 5.48 ± 0.00 2.16 ± 0.10 6.12 ± 0.12 EV_16 4.94 ± 0.04 0.98 0.02 ± 0.01 2.19 ± 0.08 4.14 ± 0.25 0.95 ± 0.00 7.69 ± 0.00 5.06 ± 0.16 3.19 ± 0.26 5.76 ± 0.15 EV_17 4.92 ± 0.05 0.97 0.28 ± 0.02 -1.32 ± 0.43 0.95 ± 0.00 0.95 ± 0.00 6.77 ± 0.32 4.70 ± 0.00 3.08 ± 0.15 5.62 ± 0.14 EV_18 5.20 ± 0.06 0.98 0.02 ± 0.01 1.29 ± 0.31 1.14 ± 0.29 0.95 ± 0.00 6.64 ± 0.17 5.97 ± 0.11 2.00 ± 0.00 5.98 ± 0.07 EV_19 5.47 ± 0.11 0.98 0.02 ± 0.01 0.41 ± 1.01 2.82 ± 0.15 1.84 ± 0.26 6.95 ± 0.11 3.98 ± 0.86 2.05 ± 0.05 6.22 ± 0.21 EV_20 4.40 ± 0.13 0.98 0.03 ± 0.00 0.48 ± 0.96 5.17 ± 0.16 2.59 ± 0.37 7.69 ± 0.00 6.48 ± 0.00 4.16 ± 0.28 6.63 ± 0.39 EV_21 4.56 ± 0.04 0.99 0.02 ± 0.00 -0.93 ± 0.96 3.49 ± 0.84 0.95 ± 0.00 6.83 ± 0.35 4.13 ± 0.30 3.68 ± 0.94 4.52 ± 0.90
29 390
Figure 1: Examples of the spots obtained for water distribution and their classification using
391
the grading scale. A: scale unit 1, B: scale unit 2A, C: scale unit 3B, D: scale unit 392