Use of (Co)Variance Functions to Describe (Co)Variances
for Test Day Yield
A. TIJANI, G. R. WIGGANS, C. P.VAN TASSELL, J. C. PHILPOT, and N. GENGLER *Unité de Zootechnie, Faculté Universitaire des Sciences
Agronomiques, B-5030 Gembloux, Belgium Animal Improvement Programs Laboratory and Gene Evaluation and Mapping Laboratory, Agricultural Research Service, USDA, Beltsville, MD 20705-2350 Fonds National Belge de la Recherche Scientifique, B-1000 Brussels, Belgium
Received March 16, 1998. Accepted September 5, 1998.
1On leave from École Nationale d'Agriculture, Meknès, Morocco.
1999 J Dairy Sci 82(Jan.)
ABSTRACT
(Co)variance functions for milk, fat, and protein yields during first lactation were developed from (co)variance components for four lactation stages of 75 d each that had been previously estimated using test day data from 17,190 Holstein cows from 37 herds in Pennsylvania and Wisconsin. The (co)variance functions were evaluated at 18, 43, 68, 93, 118, 143, 168, 193, 218, 243, 268, and 293 d in milk. Residuals were subdivided into time-dependent (permanent) and temporary environmental effects for estimation of (co)variance functions. Mean relative variance (portion of total variance) for time-dependent environmental effects was 0.50 for milk yield and 0.51 for fat and protein yields. Heritability estimates generally were lower at the start and end of lactation and were highest for milk yield; mean heritability estimates were 0.20 for milk, 0.16 for fat, and 0.17 for protein yields. Phenotypic and genetic correlations were higher between milk and protein yields than between milk and fat yields. Within yield traits, genetic correlations declined from 0.93 for adjacent lactation stages to 0.52 for milk, 0.58 for fat, and 0.60 for protein between initial and final lactation stages. Within lactation stage, mean genetic
correlations were 0.40 between milk and fat yields, 0.78 between milk and protein yields, and 0.55 between fat and protein yields; corresponding mean phenotypic correlations were 0.65, 0.92, and 0.67. The (co)variance function methodology allowed interpolation and extension of (co)variance components over the entire lactation.
(Key words: (co)variance function, test day model, variance component estimation)
INTRODUCTION
The use of test day yields instead of 305-d lactation yields recently has become the focus of much research on evaluation systems for dairy genetics. Recent studies (1, 2, 3, 4, 7, 10, 11, 12,
13, 15, 16, 18, 19) have discussed the advantages that test day models have over lactation models, especially because environmental effects can be accounted for more accurately, and greater variability in milk recording plans can be accommodated.
Wiggans and Goddard (19) proposed a multitrait analysis of test day yields. However, this approach requires a large number of genetic parameters to be estimated, especially when test day records for milk, fat, and protein are considered as different traits within a lactation. Fortunately, canonical transformation can be used to simplify multitrait analysis. This procedure can be thought of as a linear transformation of the original measures to new variables that are
genetically and phenotypically uncorrelated. Variance components can be estimated using those uncorrelated variables even when more than two variables are random (9).
Gengler et al. (1) used a multitrait analysis with canonical transformation to obtain (co)variance components for milk, fat, and protein test day yields for first lactations of US Holsteins.
However, because canonical transformation requires that all values be present, their analysis was restricted to four lactation stages of 75 d each to minimize the number of missing values.
A full multitrait model assumes that each test day yield within a lactation is a distinct trait. That assumption results in a highly overparameterized analysis because of the high correlations among test days. In this case, the (co)variance functions proposed by Kirkpatrick et al. (5, 6) can be used to describe the full parameter space with a reduced number of parameters and to
calculate (co)variances between any two traits. Generally, a (co)variance function can be defined as a continuous function that represents the variance and (co)variance of traits measured at different points on a trajectory. This approach is equivalent to a regular multitrait (co)variance matrix of infinite dimension in which different traits are defined as points on the given trajectory
(8). (Co)variance functions are particularly useful for situations modeling spatial or temporal data, and a trajectory can be linked to phenomena that are space, age, or time dependent, such as growth or lactation. (Co)variance structures at any point along a continuous (time) scale can be predicted with (co)variance functions, and greater flexibility is possible in using measurements at any point along the trajectory. If observations are sparse, information from all other
measurements is used. The aim of this study was to show the use of (co)variance functions to interpolate and to extend the estimated (co)variance components obtained by Gengler et al. (1) to all DIM within first lactation.
MATERIALS AND METHODS
Data
Data were (co)variance estimates for milk, fat, and protein yields from the study of Gengler et al. (1), which used test day data from first lactation records of 17,190 cows that calved from 1990 through 1996 in 37 large herds in Wisconsin and Pennsylvania. To estimate those (co)variances, Gengler et al. (1) defined four lactation stages of 75 d each starting with d 6; test days nearest the center of each lactation stage (d 43, 118, 193, and 268) were retained. The model of Gengler et al. (1) was solved iteratively in two steps: 1) adjustment of test day yields for effects of herd, test date, and milking frequency and effects of lactation stage within class of age and season of calving and 2) estimation of (co)variance components with a model that accounted for effects of herd, year, and calving season; calving age; and breeding value.
(Co)variance Functions
The use of (co)variance functions allows a complete description of the (co)variance structure of milk, fat, and protein yields during first lactation. To illustrate the use of (co)variance functions, the 4 lactation stages of 75 d each of Gengler et al. (1) were replaced by 12 lactation stages of 25 d each that started at d 6. Twelve stages were chosen to minimize the likelihood of more than one test in the same lactation stage for records from monthly record keeping plans that would be used for genetic evaluations calculated with a test day model. The model to describe the (co) variance function was based on those used by Kirkpatrick et al. (5, 6), Meyer and Hill (8), and Veerkamp and Goddard (18).
Let denote the (co)variance matrix for observations of three yield traits (milk, fat, and protein) in four lactation stages, and let be defined as the matrix of Legendre polynomial functions evaluated for a yield trait during a lactation stage. Matrix can be represented as
where = Kronecker (direct) product, I3 = identity matrix of dimension 3 (the number of yield traits), and = matrix of Legendre polynomial functions evaluated for the defined lactation stages (8). When a full-order fit is assumed, , where K = matrix of (co)variance
function coefficients, which can be estimated as . For reduced fit, a new approach was
used with , where = generalized least squares inverse of
.
The method is straightforward for the genetic (co)variance matrix G with but is less clear for the residual (co)variance matrix R, because R contains combinations of two types of (co)variances. First, records are affected by nongenetic influences that affect successive observations. The resulting (co)variance structure would be similar to the genetic (co)variance matrix; (co)variances would decrease as the interval between test days increased. Second, records are affected by a random measurement error (8). This error can be considered to be a temporary environmental effect. If one yield trait (e.g., milk) is analyzed, the (co)variance structure of the random measurement error can be assumed to be a diagonal matrix. If correlated yields are analyzed, this structure becomes more complicated with linked random measurement errors for milk, fat, and protein.
The following decomposition of R was used: , where I4 = identity matrix of dimension 4 (the number of lactation stages); matrix of temporary environmental (co) variances among milk, fat, and protein yields; and R* = part of R that remains after extracting temporary environmental (co)variances. This model can be considered approximate because temporary environmental (co)variances were considered constant across test days. The use of constant (co)variances for temporary environmental effects is consistent with the usual
assumption of constant residual (co)variances for single trait models. Conversely, the assumption of constant (co)variances for measurement error is more logical because measurement errors should not be time dependent; i.e., variance of measurement error is constant even if the relative importance of measurement errors varies with the associated total variance. Therefore, R* is a time-dependent (permanent) environmental (co)variance matrix, and E is a time-independent (temporary) environmental (co)variance matrix.
A reduced (co)variance function is fit to Fitting a full-order (co)variance function for G, reducing full-order (12 - 3 = 9) of the (co)variance function for R*, and estimating E results in a model equivalent to full fit (8). A reduced-fit model also was necessary for R*, because a full fit on R yielded unlikely negative residual (co)variances in some preliminary analyses.
Kirkpatrick et al. (5) proposed a method to separate R* and E based on fitting a (co)variance function on the (co)variances only and estimating the variances without the measurement error. However, this approach was difficult to use because the structure of R - R* is not a simple diagonal matrix. Therefore, the following strategy was implemented.
Reduced genetic and environmental (co)variances with increased days between tests have been reported (7, 10, 13). However, this proportionality cannot be assumed for (co)variances of G and R, because R contains both time-dependent and time-independent (time-independent)
environmental (co)variances. A preliminary study using the (co)variances estimated by Gengler et al. (1) showed that the correlation between all the elements of G and R was 0.75, and the correlation between the noncritical elements of G and R was 0.93. Therefore, G and R* were considered to have decreasing (co)variances with increasing time between test days, and similar rates of decrease were assumed to simplify computations.
Initial estimation of R* was based on the regression of elements of R on G with replacement of elements that contain measurement error with their estimates. Estimation of E as the part of R that was not contained in R* was based on the geometric mean of the elements of R - R* that correspond to a given measurement error (co)variance; E was checked for positive definiteness and adjusted. Then R* was updated as with new elements used for E, checked for positive definiteness, and adjusted; E then was recomputed, and the iteration was continued until R* and E were positive definite so that the best possible fit of R* and best estimation of E could be achieved.
The matrix GE with extended (and interpolated) genetic (co)variances was estimated as
, where = matrix of Legendre polynomial functions to estimate extended genetic (co)variances for milk, fat, and protein yields in the 12 lactation stages, and KG = matrix of coefficients of the genetic (co)variance function. The residual (co)variance matrix RE was
estimated as , where = matrix of reduced
Legendre polynomial functions to estimate extended residual (co)variances for milk, fat, and protein yields in the 12 lactation stages, and K
R = matrix of coefficients of the reduced residual
(co)variance function.
RESULTS AND DISCUSSION
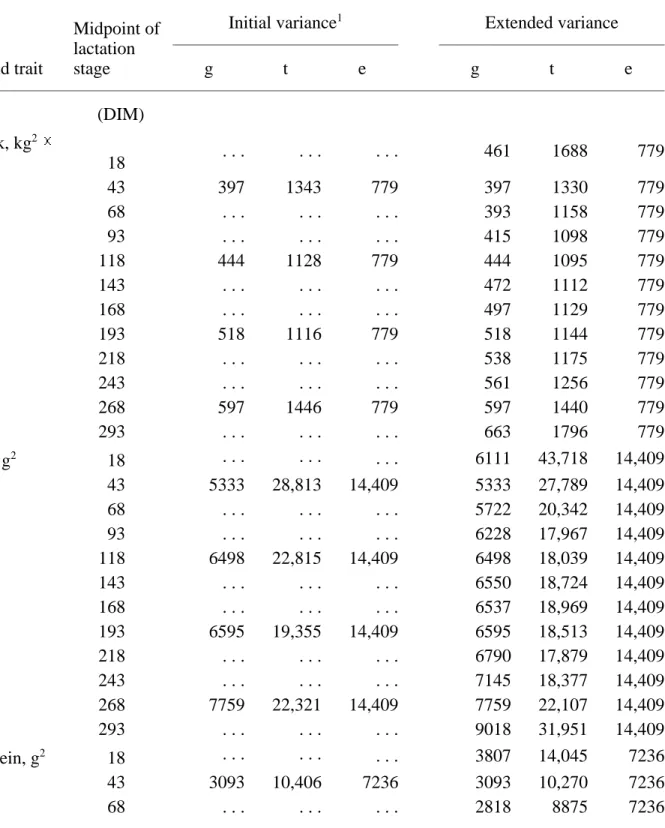
The initial and extended variances are in Table 1. Mean relative variance (a portion of the total variance) for time-dependent environmental effects were 0.50 for milk yield and 0.51 for fat and protein yields. Genetic variances for all yield traits tended to increase with lactation stage except for small decreases from first to third lactation stage for milk and fat yields and from first to fourth lactation stage for protein yield. In contrast, time-dependent environmental variances were
higher at the start and end of lactation, which indicates a greater influence by permanent environment during those stages of lactation.
TABLE 1. Estimates of genetic (g), time-dependent environmental (t), and temporary
environmental (e) variances for milk, fat, and protein yields in 4 initial and 12 interpolated and extended lactation stages.
Yield trait
Midpoint of lactation stage
Initial variance1 Extended variance
g t e g t e (DIM) Milk, kg2 100 18 . . . . . . 461 1688 779 43 397 1343 779 397 1330 779 68 . . . . . . 393 1158 779 93 . . . . . . 415 1098 779 118 444 1128 779 444 1095 779 143 . . . . . . 472 1112 779 168 . . . . . . 497 1129 779 193 518 1116 779 518 1144 779 218 . . . . . . 538 1175 779 243 . . . . . . 561 1256 779 268 597 1446 779 597 1440 779 293 . . . . . . 663 1796 779 Fat, g2 18 . . . . . . . . . 6111 43,718 14,409 43 5333 28,813 14,409 5333 27,789 14,409 68 . . . . . . 5722 20,342 14,409 93 . . . . . . 6228 17,967 14,409 118 6498 22,815 14,409 6498 18,039 14,409 143 . . . . . . 6550 18,724 14,409 168 . . . . . . 6537 18,969 14,409 193 6595 19,355 14,409 6595 18,513 14,409 218 . . . . . . 6790 17,879 14,409 243 . . . . . . 7145 18,377 14,409 268 7759 22,321 14,409 7759 22,107 14,409 293 . . . . . . 9018 31,951 14,409 Protein, g2 18 . . . . . . 3807 14,045 7236 43 3093 10,406 7236 3093 10,270 7236 68 . . . . . . 2818 8875 7236
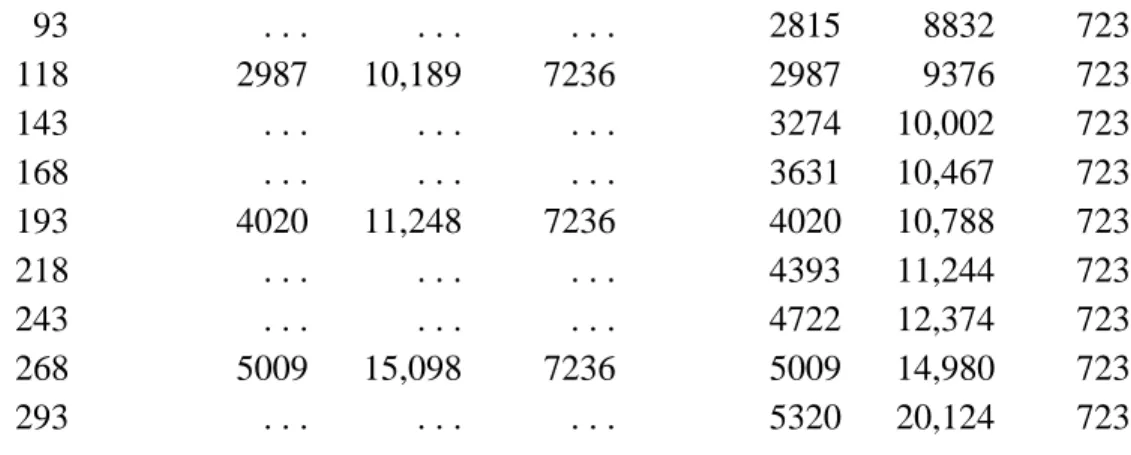
To illustrate the progression of those variances over first lactation, the relative variances for extended genetic, time-dependent, and temporary environmental effects are shown for milk yield (Figure 1), fat yield (Figure 2), and protein yield (Figure 3). For milk (Figure 1) and protein (Figure 3), initial and extended variances at corresponding DIM were similar for all three effects. For fat (Figure 2), relative genetic variance was slightly greater in the middle of the lactation. The behavior of the curve for relative genetic variance of fat yield results from the simultaneous fitting of all three yield traits.
93 . . . . . . 2815 8832 7236 118 2987 10,189 7236 2987 9376 7236 143 . . . . . . 3274 10,002 7236 168 . . . . . . 3631 10,467 7236 193 4020 11,248 7236 4020 10,788 7236 218 . . . . . . 4393 11,244 7236 243 . . . . . . 4722 12,374 7236 268 5009 15,098 7236 5009 14,980 7236 293 . . . . . . 5320 20,124 7236
1Results from iterative analysis of Gengler et al. (1); g = genetic variance, and t + e = residual
variance.
Figure 1. Evolution of extended (and interpolated) genetic ( ), time-dependent ( ), and temporary environmental ( ) variances for milk yield expressed as a relative fraction of phenotypic (total) variance; initial estimates are designated by markers.
Estimates of correlations between time-independent (temporary) environmental variances were 0.78 for milk and fat yields, 0.98 between milk and protein yields, and 0.68 between fat and
Figure 2. Evolution of extended (and interpolated) genetic ( ), time-dependent ( ), and temporary environmental ( ) variances for fat yield expressed as a relative fraction of phenotypic (total) variance; initial estimates are designated by markers.
Figure 3. Evolution of extended (and interpolated) genetic ( ), time-dependent ( ), and temporary environmental ( ) variances for protein yield expressed as a relative fraction of phenotypic (total) variance; initial estimates are designated by markers.
protein yields. Gengler et al. (1) found that phenotypic and genetic correlations were highest between milk and protein yields and lowest between milk and fat yields.
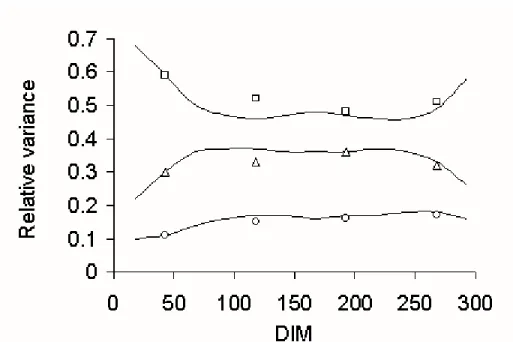
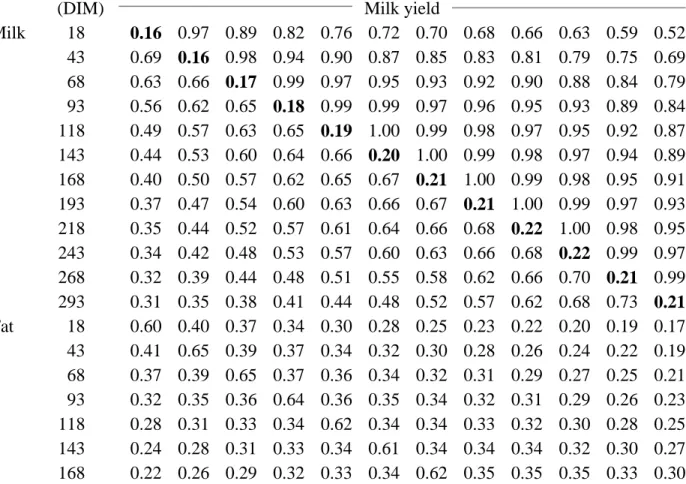
Heritability estimates for the 12 lactation stages are in Table 2. All estimates were between 0.10 and 0.22. Heritability estimates usually were higher for milk yield (mean of 0.20) than for fat and protein yields (means of 0.16 and 0.17, respectively). Heritability estimates in midlactation were higher than at the beginning or end of lactation as is also shown in Figures 1 to 3. Gengler et al. (1) found that heritabilities generally increased with lactation stage and were highest for milk yield; their mean heritability estimates from the iterative analysis that provided the initial (co) variance estimates for this study were 0.20 for milk yield, 0.15 for fat yield, and 0.16 for protein yield. Estimated heritability for fat yield was increased by fitting the (co)variance function.
TABLE 2. Heritabilities (on diagonal and bold), genetic correlations (above diagonal), and phenotypic correlations (below diagonal) for milk, fat, and protein yields estimated using (co) variance functions for 12 lactation stages.
Yield trait Midpoint of lactation stage 18 DIM 43 DIM 68 DIM 93 DIM 118 DIM 143 DIM 168 DIM 193 DIM 218 DIM 243 DIM 268 DIM 293 DIM
(DIM) Milk yield
Milk 18 0.16 0.97 0.89 0.82 0.76 0.72 0.70 0.68 0.66 0.63 0.59 0.52 43 0.69 0.16 0.98 0.94 0.90 0.87 0.85 0.83 0.81 0.79 0.75 0.69 68 0.63 0.66 0.17 0.99 0.97 0.95 0.93 0.92 0.90 0.88 0.84 0.79 93 0.56 0.62 0.65 0.18 0.99 0.99 0.97 0.96 0.95 0.93 0.89 0.84 118 0.49 0.57 0.63 0.65 0.19 1.00 0.99 0.98 0.97 0.95 0.92 0.87 143 0.44 0.53 0.60 0.64 0.66 0.20 1.00 0.99 0.98 0.97 0.94 0.89 168 0.40 0.50 0.57 0.62 0.65 0.67 0.21 1.00 0.99 0.98 0.95 0.91 193 0.37 0.47 0.54 0.60 0.63 0.66 0.67 0.21 1.00 0.99 0.97 0.93 218 0.35 0.44 0.52 0.57 0.61 0.64 0.66 0.68 0.22 1.00 0.98 0.95 243 0.34 0.42 0.48 0.53 0.57 0.60 0.63 0.66 0.68 0.22 0.99 0.97 268 0.32 0.39 0.44 0.48 0.51 0.55 0.58 0.62 0.66 0.70 0.21 0.99 293 0.31 0.35 0.38 0.41 0.44 0.48 0.52 0.57 0.62 0.68 0.73 0.21 Fat 18 0.60 0.40 0.37 0.34 0.30 0.28 0.25 0.23 0.22 0.20 0.19 0.17 43 0.41 0.65 0.39 0.37 0.34 0.32 0.30 0.28 0.26 0.24 0.22 0.19 68 0.37 0.39 0.65 0.37 0.36 0.34 0.32 0.31 0.29 0.27 0.25 0.21 93 0.32 0.35 0.36 0.64 0.36 0.35 0.34 0.32 0.31 0.29 0.26 0.23 118 0.28 0.31 0.33 0.34 0.62 0.34 0.34 0.33 0.32 0.30 0.28 0.25 143 0.24 0.28 0.31 0.33 0.34 0.61 0.34 0.34 0.34 0.32 0.30 0.27 168 0.22 0.26 0.29 0.32 0.33 0.34 0.62 0.35 0.35 0.35 0.33 0.30
193 0.21 0.25 0.29 0.31 0.33 0.35 0.36 0.64 0.38 0.38 0.36 0.34 218 0.20 0.25 0.28 0.31 0.34 0.36 0.37 0.39 0.67 0.41 0.41 0.39 243 0.21 0.25 0.28 0.31 0.34 0.36 0.38 0.41 0.43 0.70 0.45 0.45 268 0.21 0.25 0.28 0.30 0.33 0.35 0.38 0.41 0.44 0.46 0.72 0.49 293 0.21 0.24 0.26 0.28 0.30 0.32 0.35 0.38 0.42 0.46 0.49 0.70 Protein 18 0.89 0.57 0.51 0.44 0.38 0.33 0.30 0.27 0.25 0.24 0.23 0.22 43 0.59 0.91 0.55 0.51 0.46 0.42 0.39 0.36 0.34 0.32 0.29 0.26 68 0.55 0.57 0.92 0.55 0.52 0.49 0.47 0.44 0.41 0.38 0.34 0.29 93 0.49 0.53 0.56 0.91 0.55 0.54 0.52 0.50 0.47 0.43 0.38 0.32 118 0.43 0.50 0.54 0.56 0.91 0.56 0.55 0.54 0.51 0.48 0.42 0.35 143 0.39 0.46 0.52 0.55 0.57 0.91 0.58 0.57 0.55 0.51 0.46 0.39 168 0.36 0.44 0.50 0.54 0.57 0.58 0.91 0.59 0.58 0.55 0.50 0.44 193 0.34 0.42 0.48 0.53 0.56 0.58 0.59 0.92 0.60 0.59 0.55 0.50 218 0.33 0.40 0.46 0.50 0.54 0.56 0.59 0.61 0.93 0.62 0.60 0.56 243 0.33 0.38 0.43 0.47 0.50 0.53 0.57 0.59 0.62 0.93 0.64 0.62 268 0.31 0.36 0.39 0.42 0.45 0.48 0.52 0.56 0.60 0.64 0.93 0.67 293 0.30 0.32 0.34 0.36 0.38 0.41 0.46 0.50 0.56 0.62 0.67 0.93 Fat yield Milk 18 0.61 0.53 0.42 0.34 0.30 0.28 0.28 0.29 0.31 0.33 0.35 0.35 43 0.55 0.49 0.40 0.34 0.30 0.29 0.29 0.30 0.32 0.35 0.38 0.40 68 0.47 0.43 0.37 0.32 0.29 0.28 0.28 0.30 0.32 0.35 0.39 0.42 93 0.40 0.38 0.33 0.29 0.27 0.26 0.27 0.29 0.31 0.35 0.39 0.43 118 0.36 0.35 0.31 0.27 0.26 0.25 0.26 0.28 0.31 0.35 0.39 0.43 143 0.33 0.32 0.29 0.26 0.25 0.25 0.26 0.29 0.32 0.36 0.40 0.44 168 0.32 0.31 0.28 0.26 0.25 0.25 0.27 0.29 0.33 0.37 0.42 0.45 193 0.31 0.31 0.28 0.26 0.25 0.26 0.28 0.31 0.34 0.39 0.44 0.48 218 0.31 0.30 0.28 0.26 0.26 0.27 0.29 0.32 0.36 0.41 0.46 0.50 243 0.30 0.30 0.28 0.26 0.26 0.28 0.30 0.34 0.38 0.44 0.49 0.54 268 0.28 0.29 0.28 0.27 0.27 0.29 0.32 0.35 0.40 0.46 0.52 0.57 293 0.24 0.27 0.27 0.27 0.27 0.29 0.32 0.36 0.41 0.47 0.54 0.60 Fat 18 0.10 0.93 0.81 0.73 0.70 0.70 0.72 0.73 0.74 0.72 0.67 0.58 43 0.71 0.11 0.97 0.93 0.91 0.90 0.90 0.89 0.88 0.85 0.82 0.76 68 0.59 0.64 0.14 0.99 0.98 0.97 0.96 0.94 0.91 0.88 0.86 0.83 93 0.45 0.55 0.61 0.16 1.00 0.99 0.97 0.95 0.92 0.89 0.88 0.86 118 0.33 0.46 0.56 0.61 0.17 1.00 0.98 0.96 0.94 0.91 0.90 0.88 143 0.25 0.39 0.51 0.59 0.62 0.17 1.00 0.98 0.96 0.94 0.92 0.90 168 0.19 0.34 0.47 0.56 0.61 0.63 0.16 0.99 0.98 0.97 0.95 0.92 193 0.17 0.31 0.43 0.52 0.58 0.61 0.63 0.17 1.00 0.99 0.97 0.93 218 0.17 0.29 0.40 0.48 0.54 0.57 0.60 0.62 0.17 1.00 0.98 0.94
243 0.20 0.29 0.37 0.43 0.47 0.51 0.55 0.58 0.62 0.18 0.99 0.96 268 0.24 0.29 0.33 0.36 0.39 0.42 0.46 0.51 0.57 0.63 0.18 0.99 293 0.28 0.29 0.29 0.28 0.28 0.30 0.34 0.40 0.48 0.59 0.68 0.16 Protein 18 0.62 0.42 0.36 0.30 0.24 0.20 0.17 0.16 0.16 0.17 0.19 0.19 43 0.43 0.64 0.39 0.34 0.30 0.26 0.24 0.23 0.22 0.22 0.22 0.21 68 0.39 0.41 0.65 0.37 0.34 0.31 0.29 0.28 0.28 0.27 0.25 0.23 93 0.35 0.38 0.39 0.63 0.36 0.35 0.34 0.33 0.32 0.31 0.29 0.24 118 0.32 0.35 0.37 0.38 0.62 0.37 0.36 0.36 0.36 0.35 0.32 0.27 143 0.29 0.33 0.36 0.37 0.38 0.62 0.39 0.39 0.39 0.38 0.35 0.30 168 0.27 0.31 0.35 0.37 0.38 0.39 0.64 0.41 0.42 0.42 0.39 0.34 193 0.26 0.30 0.34 0.36 0.37 0.39 0.41 0.67 0.45 0.46 0.44 0.39 218 0.25 0.29 0.32 0.34 0.36 0.38 0.41 0.44 0.70 0.49 0.48 0.45 243 0.25 0.28 0.30 0.32 0.34 0.36 0.39 0.43 0.48 0.74 0.53 0.50 268 0.24 0.26 0.27 0.29 0.30 0.33 0.36 0.41 0.47 0.52 0.75 0.55 293 0.22 0.23 0.23 0.24 0.25 0.28 0.32 0.37 0.44 0.50 0.56 0.74 Protein yield Milk 18 0.85 0.81 0.77 0.74 0.71 0.70 0.69 0.69 0.68 0.67 0.65 0.61 43 0.78 0.79 0.78 0.76 0.75 0.74 0.74 0.74 0.74 0.74 0.72 0.69 68 0.69 0.73 0.74 0.75 0.75 0.75 0.76 0.76 0.76 0.76 0.76 0.74 93 0.61 0.66 0.70 0.72 0.74 0.75 0.75 0.76 0.76 0.77 0.77 0.76 118 0.55 0.61 0.67 0.70 0.73 0.74 0.75 0.76 0.76 0.77 0.78 0.77 143 0.51 0.58 0.64 0.69 0.72 0.74 0.75 0.76 0.77 0.78 0.79 0.79 168 0.48 0.56 0.63 0.68 0.71 0.74 0.75 0.77 0.78 0.79 0.80 0.81 193 0.46 0.55 0.62 0.68 0.71 0.74 0.76 0.77 0.79 0.80 0.82 0.83 218 0.44 0.54 0.61 0.67 0.71 0.74 0.76 0.78 0.79 0.81 0.83 0.85 243 0.42 0.52 0.60 0.66 0.70 0.73 0.75 0.77 0.79 0.82 0.84 0.87 268 0.39 0.49 0.57 0.63 0.68 0.70 0.73 0.75 0.77 0.80 0.84 0.87 293 0.34 0.44 0.53 0.59 0.63 0.66 0.68 0.70 0.73 0.77 0.81 0.86 Fat 18 0.74 0.74 0.73 0.73 0.73 0.74 0.74 0.74 0.74 0.72 0.68 0.61 43 0.64 0.63 0.62 0.62 0.62 0.62 0.63 0.64 0.64 0.63 0.61 0.56 68 0.51 0.50 0.50 0.49 0.49 0.50 0.51 0.52 0.52 0.53 0.52 0.49 93 0.42 0.42 0.41 0.41 0.42 0.43 0.44 0.45 0.46 0.47 0.47 0.45 118 0.37 0.37 0.37 0.38 0.39 0.40 0.42 0.43 0.45 0.46 0.46 0.45 143 0.35 0.36 0.37 0.38 0.39 0.41 0.43 0.45 0.46 0.48 0.49 0.48 168 0.35 0.36 0.38 0.40 0.42 0.44 0.46 0.48 0.50 0.52 0.53 0.53 193 0.35 0.38 0.40 0.43 0.45 0.48 0.50 0.53 0.55 0.57 0.58 0.58 218 0.36 0.39 0.42 0.45 0.48 0.51 0.54 0.56 0.59 0.61 0.63 0.63 243 0.36 0.39 0.43 0.46 0.49 0.53 0.56 0.58 0.61 0.64 0.66 0.67
Heritability estimates in Table 2 agree in general with those reported by Meyer et al. (7), Pander et al. (10), Pösö et al. (11), and Swalve (15). Jamrozik et al. (3) found clearly higher heritability estimates, but those higher estimates were due at least partially to inappropriate specification of the permanent environmental effect (14). The (co)variance functions used in this study were able to interpolate correctly between known lactation stages and to provide reasonable parameter estimates at the ends of the lactation curve.
Genetic and phenotypic correlations for the 12 lactation stages also are in Table 2. All
correlations were positive and ranged from 0.16 to 1.00; correlations from the iterative analysis that provided the initial (co)variance estimates also were all positive and ranged from 0.21 to 0.97 (1).
Within a yield trait, genetic correlations declined from 0.93 for adjacent lactation stages to 0.52 for milk, 0.58 for fat, and 0.60 for protein between initial and final lactation stages.
Phenotypic correlations for milk yield declined from 0.65 for adjacent lactation stages to 0.31 between initial and final lactation stages. For fat and protein yields, phenotypic correlations were highest ( 0.60) between adjacent lactation stages and lowest (0.17 for fat and 0.27 for protein) between the beginning of lactation and 180 to 255 DIM. Gengler et al. (1) reported that genetic correlations within a yield trait declined from 0.90 for adjacent lactation stages to 0.75 for milk and protein and to 0.82 for fat between initial and final lactation stages; corresponding decreases for phenotypic correlations were from 0.56 to 0.38 for milk, from 0.38 to 0.27 for fat, and from 0.47 to 0.32 for protein.
Genetic correlations were lowest between milk and fat yields (0.24 to 0.61), intermediate between fat and protein yields (0.31 to 0.74), and highest between milk and protein yields (0.34 to 0.87). Within lactation stage, genetic correlations averaged 0.40 between milk and fat, 0.55 between fat and protein, and 0.78 between milk and protein. Mean phenotypic correlations within lactation stage were 0.65 between milk and fat, 0.67 between fat and protein yields, and 0.92 between milk and protein yields. Gengler et al. (1) reported mean genetic correlations of
268 0.35 0.38 0.42 0.45 0.48 0.52 0.55 0.58 0.61 0.64 0.67 0.69 293 0.31 0.35 0.38 0.41 0.44 0.47 0.50 0.53 0.56 0.60 0.65 0.68 Protein 18 0.15 0.98 0.95 0.89 0.85 0.81 0.77 0.75 0.72 0.69 0.65 0.60 43 0.66 0.15 0.99 0.96 0.92 0.89 0.86 0.83 0.81 0.78 0.75 0.70 68 0.57 0.61 0.15 0.99 0.97 0.95 0.92 0.90 0.88 0.85 0.82 0.78 93 0.48 0.56 0.60 0.15 0.99 0.98 0.96 0.95 0.93 0.91 0.88 0.84 118 0.40 0.50 0.57 0.61 0.15 1.00 0.99 0.97 0.96 0.94 0.92 0.87 143 0.34 0.45 0.54 0.60 0.63 0.16 1.00 0.99 0.98 0.97 0.94 0.90 168 0.30 0.42 0.51 0.58 0.62 0.65 0.17 1.00 0.99 0.98 0.96 0.92 193 0.28 0.39 0.49 0.56 0.61 0.64 0.66 0.18 1.00 0.99 0.97 0.94 218 0.27 0.37 0.46 0.52 0.57 0.61 0.64 0.67 0.19 1.00 0.99 0.95 243 0.27 0.35 0.42 0.47 0.52 0.56 0.60 0.64 0.68 0.19 1.00 0.97 268 0.28 0.32 0.37 0.41 0.45 0.49 0.54 0.59 0.65 0.70 0.18 0.99 293 0.28 0.29 0.31 0.32 0.35 0.39 0.45 0.51 0.59 0.67 0.74 0.16
0.40 between milk and fat, 0.56 between fat and protein, and 0.78 between milk and protein within lactation stage; corresponding mean phenotypic correlations were 0.64, 0.66, and 0.91. Genetic and phenotypic correlations in Table 2 correspond to those reported by most researchers (7, 10, 13). However, Vargas et al. (17) reported slightly lower genetic correlations and notably higher phenotypic correlations than those in Table 2, which could have been caused by
differences in populations, data, statistical models, or computational methods.
The (co)variance functions provided plausible interpolated and extended estimates. For example, the estimated genetic correlation between 18 and 93 DIM was 0.82 for milk yield, and Kettunen et al. (4) reported a genetic correlation of 0.83 between 25 and 85 DIM. Few unexpected patterns were observed with the exception of lower genetic correlations between yield traits within lactation stages during the middle of lactation than at the ends of the lactation curve. However, this pattern was present in the results of the iterative analysis of Gengler et al. (1) that provided the initial (co)variance estimates and, therefore, is not a consequence of the (co)variance function methodology.
CONCLUSIONS
The estimation of (co)variance components is crucial for the development of genetic evaluation systems based on test day yields. Genetic and residual (co)variance matrices for milk, fat, and protein yields in 12 lactation stages of 25-d each were constructed from estimates from 4 lactation stages of 75 d each using (co)variance functions and a decomposition of residuals into time-dependent and temporary environmental effects. Correlations between temporary
environmental variances were lower for milk and fat yields than for milk and protein yields but higher than for protein and fat yields. Heritability estimates for yield traits ranged from 0.10 to 0.22. All genetic and phenotypic correlations were positive and ranged from 0.16 to 1.00.
Genetic variances increased with increased DIM, which suggests that selection on the last part of lactation would be effective; however, genetic correlations between the start and end of lactation were positive and moderately high for all yield traits (0.52 for milk, 0.58 for fat, and 0.60 for protein). Genetic correlations between the same yield trait at different lactation stages were higher than the corresponding phenotypic correlations. Genetic correlations were comparable with those estimated iteratively by Gengler et al. (1) for lactation stages with corresponding midpoints.
The proposed (co)variance polynomial functions provide a valid method for increasing the density of (co)variance estimates over a lactation. However, testing of functions other than polynomials is warranted.
ACKNOWLEDGMENTS
The support of the Administration Générale de la Coopération au Développement, Brussels, Belgium, and the financial support of the Fonds National Belge de la Recherche Scientifique, Brussels, Belgium, are acknowledged. N. Gengler is Chargé de Recherches for the Fonds National Belge de la Recherche Scientifique. The authors thank R. F. Veerkamp, Netherlands Agricultural Research Organization, Lelystad, The Netherlands; K. Meyer, University of New England, Armidale, Australia; and S. M. Hubbard, Animal Improvement Programs Laboratory,
ARS, USDA, Beltsville, MD, for manuscript review. The authors also thank J. P. Lambotte, Faculté Universitaire des Sciences Agronomiques, Gembloux, Belgium, for his suggestions on (co)variance functions and I. Misztal, University of Georgia, Athens, for providing the computer program to estimate initial variance components; this program is available at
ftp://nce.ads.uga.edu.
REFERENCES
1 Gengler, N., A. Tijani, G. R. Wiggans, C. P. Van Tassell, and J. C. Philpot. 1999. Estimation of (co)variances of test day yields for first lactation Holsteins in the United States. J. Dairy Sci. 82(Jan.). Online. Accessed Dec. 17, 1998.
2 Guo, Z., and H. H. Swalve. 1995. Modelling of the lactation curve as a sub-model in the evaluation of test day records. Proc. Open Session INTERBULL Annu. Mtg., Prague, Czech Republic, Sept. 7-8, 1995. Int. Bull Eval. Serv. Bull. No. 11. Dep. Anim. Breed. Genet., SLU, Uppsala, Sweden.
3 Jamrozik, J., L. R. Schaeffer, and J.C.M. Dekkers. 1997. Genetic evaluation of dairy cattle using test day yields and random regression model. J. Dairy Sci. 80:1217-1226.
4 Kettunen, A., E. A. Mäntysaari, and I. Strandén. 1997. Analysis of first lactation test day milk yields by random regression model. Proc. Open Session INTERBULL Annu. Mtg., Vienna, Austria, August 28-29, 1997. Int. Bull Eval. Serv. Bull. No. 16:39-42. Dep. Anim. Breed. Genet., SLU, Uppsala, Sweden.
5 Kirkpatrick, M., W. G. Hill, and R. Thompson. 1994. Estimating the (co)variance structure of traits during growth and ageing, illustrated with lactation in dairy cattle. Genet. Res. Camb. 64:57-66.
6 Kirkpatrick, M., D. Lofsvold, and M. Bulmer. 1990. Analysis of the inheritance, selection and evolution of growth trajectories. Genetics 124:979-993.
7 Meyer, K., H.-U. Graser, and K. Hammond. 1989. Estimates of genetic parameters for first lactation test day production of Australian Black and White cows. Livest. Prod. Sci.
21:177-199.
8 Meyer, K., and W. G. Hill. 1997. Estimation of genetic and phenotypic (co)variance functions for longitudinal or "repeated" records by restricted maximum likelihood. Livest. Prod. Sci. 47:185-200.
9 Misztal, I., K. Weigel, and T. J. Lawlor. 1995. Approximation of estimates of (co)variance components with multiple-trait restricted maximum likelihood by multiple diagonalization for more than one random effect. J. Dairy Sci. 78:1862-1872.
10 Pander, B. L., W. G. Hill, and R. Thompson. 1992. Genetic parameters of test day records of British Holstein-Friesian heifers. Anim. Prod. 55:11-21.
11 Pösö, J., E. A. Mäntysaari, and A. Kettunen. 1996. Estimation of genetic parameters of test day production in Finnish Ayrshire cows. Proc. Open Session INTERBULL Annu. Mtg., Veldhoven, The Netherlands, June 23-24, 1996. Int. Bull Eval. Serv. Bull. No. 14:45-48. Dep. Anim. Breed. Genet., SLU, Uppsala, Sweden.
12 Ptak, E., and L. R. Schaeffer. 1993. Use of test day yields for genetic evaluation of dairy sires and cows. Livest. Prod. Sci. 34: 23-34.
measurements in Spanish Holstein-Friesian. Proc. Open Session INTERBULL Annu. Mtg., Prague, Czech Republic, Sept. 7-8, 1995. Int. Bull Eval. Serv. Bull. No. 11. Dep. Anim. Breed. Genet., SLU, Uppsala, Sweden.
14 Schaeffer, L. R. 1997. Subject: random regressions.
http://chuck.agsci.colostate.edu/wais/logs/agdg869258263.html. Accessed Nov. 18, 1997.
15 Swalve, H. H. 1995. The effect of test day models on the estimation of genetic parameters and breeding values for dairy yields traits. J. Dairy Sci. 78:929-938.
16 Van Tassell, C. P., R. L. Quaas, and R.W. Everett. 1992. Parameter estimates for 305-day ME records and 305-day test-day residual records. J. Dairy Sci. 75(Suppl. 1):251. (Abstr.) 17 Vargas, B., E. Perez, and J.A.M. van Arendok. 1998. Analysis of test day yield data of
Costa Rican dairy cattle. J. Dairy Sci.81:255-263.
18 Veerkamp, R. F., and M. E. Goddard. 1998. (Co)variance functions across herd production levels for test day records on milk, fat and protein yield. J. Dairy Sci. 81:1690-1701.
19 Wiggans, G. R., and M. E. Goddard. 1997. A computationally feasible test day model for genetic evaluation of yield traits in the United States. J. Dairy Sci. 80:1795-1800.