Contents lists available atScienceDirect
Biochemical Pharmacology
journal homepage:www.elsevier.com/locate/biochempharm
Assessment of diagnostic accuracy of lung function indices and FeNO for a
positive methacholine challenge
N. Bougard
⁎, H. Nekoee, F. Schleich, F. Guissard, V. Paulus, AF Donneau, R. Louis
Pneumology and Public Health Department, University of Liege, CHU Liege, BelgiumA R T I C L E I N F O Keywords: Asthma Methacholine challenge FEV1 RV/TLC ratio FeNO A B S T R A C T
Demonstration of bronchial hyperresponsiveness is a key feature in asthma diagnosis. Methacholine challenge has proved to be a highly sensitive test to diagnose asthma in patients with chronic respiratory symptoms and preserved baseline lung function (FEV1 > 70% pred.) but is time consuming and may sometimes reveal un-pleasant to the patient.
We conducted a retrospective study on 270 patients recruited from the University Asthma Clinic of Liege. We have compared the values of several lung function indices and fractional exhaled nitric oxide (FeNO) in pre-dicting a provocative methacholine concentration≤16 mg/ml on a discovery cohort of 129 patients (57 already on ICS) and on a validation cohort of 141 patients (66 already on ICS).
In the discovery study (n = 129), 85 patients (66%) had a positive methacholine challenge with PC20M≤ 16 mg/ml. Those patients had lower baseline % predicted FEV1 (92% vs. 100%; p < 0.01), lower FEV1/FVC ratio (79% vs. 82%; p < 0.05), higher RV/TLC ratio (114% vs. 100%; p < 0,0001), lower SGaw (specific conductance) (0.76 vs. 0.95; p < 0,001) and higher FeNO (29 ppb vs. 19 ppb; p < 0,01). When performing ROC curve the RV/TLC ratio provided the greatest AUC (0.74, p < 0.001), sGAW had intermediate AUC of 0.69 (p < 0.001) while FeNO, FEV1 and FEV1/FVC ratio were modestly predictive (AUC of 0.65 (p < 0.05), 0,67 (p < 0.001) and 0,63 (p < 0.001). These results were confirmed in the validation study (n = 141). Based on a logistic regression analysis, significant variables associated with positive methacholine challenge were FeNO and RV/TLC (% Pred). A combined application of FeNO and RV/TLC (% Pred) for pre-dicting the PC20M had a specificity of 85%, a sensitivity of 59% and an AUC of 0.79. In the validation study, three variables (RV/TLC, FeNO and FEV1) were independently associated with positive methacholine challenge and the combination of these three variables yielded a specificity of 77%, a sensitivity of 39% and an AUC of 0.77.
The RV/TLC ratio combined to FeNO may be of interest to predict significant methacholine bronchial hy-perresponsiveness.
1. Introduction:
Excessive airway fluctuation is a fundamental feature in patient with asthma. It could be demonstrated by a significant reversibility of FEV1 (> 12% reversibility and 200 mL) following 400 µg inhaled sal-butamol when FEV1 < 80% predicted or by bronchial hyperrespon-siveness to methacholine challenge when FEV1 > 70% predicted[1]. Methacholine challenge test (MCT) has proved to be a highly sensitive test to diagnose asthma in patients with chronic respiratory symptoms and preserved baseline lung function[2,3]. However, the MCT is time consuming and unpleasant for the patient. Recent surveys indicate that wrong asthma diagnosis may be present up to 30% of patients who received an asthma diagnosis in the community[4]. Therefore,finding
a test or a combination of tests that may predict a positive MCT could be helpful for the clinician to diagnose asthma. On the other hand the severity of bronchial hyperresponsiveness to methacholine was shown to correlate with poor asthma control[5]and reducing the severity of methacholine responsiveness with stepping up ICS improved asthma control[6].
Here we have compared the values of several lung function indices obtained during routine lung function assessment using body plethys-mography together with measurement fractional exhaled nitric oxide (FeNO) in predicting a provocative methacholine concentration ≤16 mg/ml. We also investigated the relationship between the severity of methacholine bronchial hyperresponsiveness and baseline lung function indices and FeNO among those who tested positive
https://doi.org/10.1016/j.bcp.2020.113981
Received 31 January 2020; Accepted 14 April 2020
⁎Corresponding author.
E-mail address:[email protected](N. Bougard).
0006-2952/ © 2020 Elsevier Inc. All rights reserved.
(PC20M≤ 16 mg/ml). We first analysed the predicting values of FEV1, FEV1/FVC ratio, specific conductance (sGaw), RV/TLC ratio and FeNO on a discovery (or training) cohort of 129 patients (57 already on ICS) and the results were confirmed on a validation cohort of 141 patients (66 already on ICS) recruited from our asthma clinic.
2. Methods
We conducted a retrospective review of patients records from our pulmonary function laboratory files. We selected patients from our asthma clinic that had undergone spirometry, volume measurement by body plethysmography, FeNO measurement and a methacholine chal-lenge test from January 2017 to December 2017. We also selected a second cohort of patients from January 2018 to December 2018 as a validation cohort. These investigations were utilized to assess patients with recurrent respiratory symptoms of cough, breathlessness and/or wheezing and baseline FEV1 above 70% predicted. Almost half of these patients were already receiving inhaled corticosteroids. Demographic and functional patient characteristics are indicated in Table 1. The demographic and functional characteristic of the validation cohort were similar to those of the derivation cohort.
2.1. Exhaled nitric oxide
Exhaled nitric oxide was measured by a chemoluminescence ana-lyser (NIOX, aerocrine, Stockholm, Sweden) at aflow rate of 50 mL/s. This measure was conforming to the ATS/ERS task force’s re-commendations[7].
2.2. Pulmonary function testing
All Pulmonary function tests were performed according to the ERS/ ATS criteria [8]. Spirometry was performed using an electronic spi-rometer connected in real time to a computer (spirobank, MIR, Rome, Italy). All manoeuvres were repeated three times and the best FEV1 value was kept by the software program (winspiro, MIR). Methacholine chloride was purchased as powder (Provocholine 1280 mg; Metapharm, Brantford, Ontario, Canada) and dissolved in NaCl 0.9% by the hospital pharmacy to give appropriate concentrations. The methacholine chal-lenge was performed by using a Hudson jet nebulizer (Hudson RCI; Micro Mist, Research Triangle Park, NC) activated by an airflow rate of 6 L/minute and delivering 0.3 mL/minute. MCT was performed
according to a slightly modified Cockroft’s method. Patients succes-sively inhaled by tidal breathing for 2 min fourfold increasing con-centrations of methacholine chloride from 0.06 to 16 mg/ml as de-scribed previously[9]. The aerosol was generated by a jet nebulizer (Hudson, Temecula, CA, USA), whose characteristics were described previously[10]. Spirometry data and RV/TLC were expressed as per-cent predicted of normal reference value [11,12]. The specific con-ductance was determined by implementing a least-squearedfit of the line through the specific conductance loop at a defined fixed flow of 0.5 L/s[13,14].
2.3. Statistical analysis
The results were expressed as mean ± SD for continuous and normally distributed variables while we preferred median and inter-quartile ranges (IQR) for skewed distributions. For categorical vari-ables, the number of observations and percentages were given in each category. Comparison between the two groups was made with unpaired t test or Mann-Witney test respectively when the normality test using the method of Kolmogorov and Smirnov was passed or not. Correlations were made using the Spearman coefficient of correlation.
Receiver-operating characteristic (ROC) curves were constructed to define the accuracy of sGAW, RV/TLC, FEV1, FEV1/FVC and FENO to predict a positive MCT. This method determines the accuracy of the binary classification models and the area under the curve (AUC) is a common measure of its exact evaluation. Cut-off was defined as the value giving the best sum of sensitivity and specificity.
Logistic regression analysis was performed to assess the relationship between the binary outcomes (PC20M) andfive covariates, sGAW, RV/ TLC, FEV1, FEV1/FVC, FeNO. Ordinary estimation of unknown para-meters in the model was calculated by GLM (generalized linear mixed model) function by maximum likelihood. The ability of the equation to predict a positive MCT was verified in an independent cohort of 141 patients recruited from 1 January 2018 to 31 December 2018. The re-sults were considered to be significant at the 5% critical level (p < 0.05). All analyses were performed using the R software.
3. Results
3.1. Ability of lung function indices and FeNO to predict positive methacholine challenge in the discovery cohort
In the discovery cohort, 85/129 patients (66%) had a positive me-thacholine challenge with PC20M≤ 16 mg/ml (Table 1). Those pa-tients had lower baseline percent predicted FEV1 (p < 0.01), lower FEV1/FVC ratio (p < 0.05), higher RV/TLC ratio (p < 0.0001), lower sGaw (specific conductance) (p < 0.001) and higher FeNO (p < 0.01).
When performing ROC curve the RV/TLC ratio provided the greatest AUC (0.74, p < 0.001) (Fig. 1) while AUC from sGaw, FEV1, FEV1/FVC ratio and FeNO were modestly predictive ranging between 0.69 and 0.63 (Table 2). At a threshold of 99% predicted RV/TLC had a sensitivity and specificity of 54% and 87% respectively (Table 2).
We then performed a logistic regression with the binary outcomes (PC20M) and the 5 covariates (sGAW, RV/TLC, FeV1, FEV1/FVC and FeNO). The logistic regression model assumes that
⎜ ⎟ ⎛ ⎝ − ⎞ ⎠ = + + + + + P PC M P PC M
β β FeNO β sGAW β RV TLC β FEV β FEV FVC
log ( 20 )
1 ( 20 )
/ 1 1/
0 1 2 3 4 5
Ordinary estimation of unknown parameters in the model was cal-culated by GLM (generalized linear mixed model) function by max-imum likelihood. Estimation results are presented in Table 3.1. It turned out that only two variables, RV/TLC and FeNO, had a significant independent association with a positive MCT. Estimation results for the
Table 1
demographic and functional patient characteristics.
Cohort 1 Cohort 2 Number 129 141 PC20M≤ 16 mg/ml (Y/N) 85 Y (66%) 44 N (34%) 96 Y (68%) 45 N (32%) Atopie (Y/N) 58 Y (45%) 71 N (55%) 71 Y (50%) 70 N (50%) Sex (F/M) 78F (60%) 51 M (40%) 82F (58%) 59 M (42%) Age 50 ± 15 51 ± 15
Current smoking (Y/N) 14 Y (11%) 115 N (89%) 17 Y (12%) 124 N (88%) ICS (Y/N) 57 Y (44%) 72 N (56%) 66 Y (47%) 75 N (53%) FeNO (ppb) 22 (14–47) 23 (14–39) sGAW (1/kPa*s) 0.82 (0.63–1.01) 0.76 (0.58–0.98) RV/TLC (% pred) 109 ± 17 106 ± 23 FEV1 (% pred) 95 ± 14 91 ± 16 FEV1/FVC (%) 80 ± 7 78 ± 8 Blood Neutrophils (1/µl) 3750 (2812–4662) 3767 (2999–4801) Blood Eosinophils (1/µl) 201 (109–329) 151 (81–279) Sputum Neutrophils (%) 63 (45–78) 78 (43–80) Sputum Eosinophils (%) 1.8 (0.5–6.4) 1.6 (0.4–5.2)
significant variables are presented inTable 3.2. We thenfit the model again only taking into account the two significant variables. Compared to the one with thefive variables, the two variables model had a smaller AIC (139.67 VS 141.62) which indicates a better-fitting model. There-fore the best model assumes that
⎜ ⎟ ⎛ ⎝ − ⎞ ⎠ = + + P PC M P PC M β β RV TLC β FeNO log ( 20 ) 1 ( 20 ) 0 1 / 2
The AUC, threshold, sensitivity, and specificity are reported in Table 3.3. TheTable 3.4showed the Confusion Matrix. The ROC curve is represented inFig. 2.
A combined application of FeNO and RV/TLC (% Pred) for pre-dicting the PC20M resulted in an area under curves equals to 0.79 with the cut-off point of 0.464 and a sensitivity and specificity reaching 59% and 85% respectively.
3.2. Ability of lung function indices and FeNO to predict positive methacholine challenge in the validation cohort
The baseline demographic and lung function characteristics of the patients of the validation cohort (cohort 2) were very similar to the cohort 1 and shown inTable 1.
In the validation cohort it is again RV/TLC ratio that provided the greatest AUC (0.75) to predict positive PC20M (Fig. 3). At a threshold of 102% predicted, RV/TLC had a sensitivity and a specificity of 71% and 68% respectively (Table 4). Other lung function indices performed less well with lower AUC and the FeNO AUC was even not significant (Table 4). After multiple logistic regression, three variables (RV/TLC, FeNO and FEV1) had a significant predicting effect on the results of PC20M. Estimation results are presented inTables 5.1 and 5.2 respec-tively with and without non-significant variables. We performed a lo-gistic regression with the binary outcomes (PC20M) and these 3 cov-ariates. The logistic regression model assumes that
⎜ ⎟ ⎛ ⎝ − ⎞ ⎠ = + + + P PC M P PC M β β RV TLC β FeNO β FEV log ( 20 ) 1 ( 20 ) 0 1 / 2 3 1
A combined application of FeNO, RV/TLC (% Pred) and FEV1 (% Pred) for predicting the PC20M resulted in an AUC of 0.77 and a cut-off point of 0.363 yielding a sensitivity and a specificity of 69% and 77% respectively. The AUC, threshold, sensitivity, and specificity are re-ported inTable 5.3. Thetable 5.4showed the Confusion Matrix. The ROC curve is represented inFig. 4.
When the combined variables were compared each of individual variables, the combination of variables was superior to the FeNO alone in terms of specificity, was superior to the RV/TLC (% Pred) alone in terms of sensitivity. Combination of variables provided a greater AUC compared to the variables taken alone.
3.3. Correlation between PC20M and lung function indices and FeNO
Among the patients who tested positive to methacholine
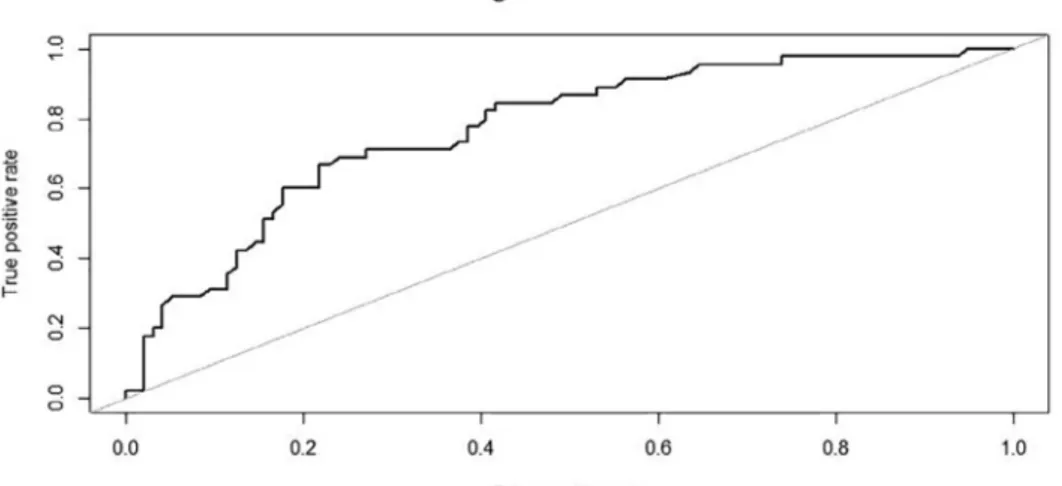
Fig. 1. Receiver-operating characteristic curve (ROC) for the discovery cohort to determine the RV/TLC value which best identified a positive methacholine challenge test (MCT) with PC20M≤ 16 mg/ml. The optimum cut-off point was 99% pred. (AUC 0.735, sensitivity 54.5%, specificity 87%, VPP 78.7%, VPN 68.6%, P < 0.001).
Table 2
Values derived from the ROC curves of lung function indices and FeNO for a positive methacholine challenge in the discovery cohort (Cohort 1).
AUC Threshold Sensitivity Specificity VPP VPN P-value
RV/TLC (% pred) 0.735 99 0.545 0.870 78.7% 68.6% < 0.001 sGAW (1/kPa*s) 0.689 0.73 0.864 0.494 87.5% 46.9% < 0.001 FeNO (ppb) 0.645 25 0.773 0.576 83.1% 48.6% < 0.05 FEV1 (% pred) 0.667 98 0.614 0.718 78.2% 52.9% < 0.001 FEV1/FVC (%) 0.626 77 0.818 0.459 83% 43.9% < 0.001 Table 3.1
Parameter estimation for logistic regression on the discovery cohort for thefive indices model.
Odds ratio Confidence Interval P-value Result Lower Upper
Intercept 8.707 0.021 3621.31 0.555 Not Significant
FeNO 0.973 0.956 0.990 0.009 Significant
(P < 0.05)
sGAW 3.238 0.959 10.938 0.112 Not Significant
RV/TLC 0.955 0.931 0.981 0.004 Significant
(P < 0.001)
FEV1 1.017 0.988 1.046 0.342 Not Significant
FEV1/FVC 1.003 0.945 1.064 0.929 Not Significant
(PC20M≤ 16 mg/ml) in the training cohort (cohort 1), the magnitude of PC20M was significantly and inversely correlated with FeNO (r = -0.37; p < 0.001) (Fig. 5a) but was poorly correlated with the other indices: FEV1 (r = 0.06; p > 0.5), FEV1/FVC (r = 0.20; p = 0.06), sGaw (r = 0.11; p > 0.1), RV/TLC (r = -0,18; p > 0.05). In the validation cohort (cohort 2) the magnitude of PC20M was again in-versely related to FeNO (r = -0.22, p < 0.05) (Fig. 5b), positively related to sGaw (r = 0.25, p < 0.05) but not significantly related to FEV1 (r = 0.15), FEV1/FVC (r = 0.11) and RV/TLC (r = -0.08) (p > 0.05 for all).
4. Discussion
Our study shows that a combination of RV/TLC measured by ple-thysmography and FeNO provides the best strategy to predict the po-sitivity of a methacholine challenge in patients with symptoms sug-gestive of asthma. It indicates that both gas trapping and epithelial cell activation may play key roles in determining the presence of bronchial
hyperresponsiveness.
Our data regarding the ratio RV/TLC are in keeping with what Stanbrook et al reported more than 25 years ago[15]. They found that RV/TLC was a specific (81%) but insensitive (29%) index of positive methacholine challenge test with a threshold set at 120% predicted. In our study sensitivity was clearly higher and above 50% with specificity above 60% in both cohorts. This is explained by the differences between cut-points. Ours were defined by ROC curves and turned around 100% in both cohorts. Therefore, our cut-points are much lower than the arbitrarily 120% reported in the study of Stanbrook et al. As Stanbrook et al did not give much details about their patients, likely some of these patients had COPD. Our cohorts were made of patients with both sus-pected asthma and confirmed asthma in whom methacholine challenge was performed to assess the extent of bronchial hyperresponsiveness as a component of the disease. Overall Stanbrook’study and ours point to the interest of looking at the index RV/TLC in asthmatics or in patients with suspicion of asthma. Yet, this parameter is seldom evoked in asthma literature while it has long been recognised as an important sign of lung hyperdistension in COPD. Moreover, our current study also aligns with the recent ATLANTIS study from Postma et al showing re-newed interest for small airway dysfunction indices, and for RV/TLC in particular, which appeared to correlate with asthma control[16].
In our study, traditional lung function indices reflecting more proximal airway obstruction like the ratio FEV1/FVC or sGaw per-formed less well than RV/TLC and, interestingly, did not emerge con-vincingly in the multiple logistic regression model. Our results would suggest that baseline distal airway obstruction, reflected by increased RV/TLC, may be critical in predicting positive methacholine challenge.
Table 3.2
Parameter estimation for logistic regression on the discovery cohort for the two indices model.
Odds ratio Confidence Interval P-value Result
Lower Upper Intercept 6.433 42.489 9109.72 < 0.001 Significant (P < 0.001) RV/TLC −0.058 0.921 0.967 < 0.001 Significant (P < 0.001) FeNO −0.029 0.954 0.987 0.004 Significant (P < 0.05) AIC: 139.67. Table 3.3
Outputs of ROC curve for two full andfinal models (Cohort 1).
AUC Threshold Sensitivity Specificity VPP VPN P-value Accuracy
Allfive Variables 0.805 0.379 0.75 0.753 85.3% 61.1% < 0.001 0.75
FeNO RV/TLC 0.787 0.464 0.591 0.847 80% 66.7% < 0.001 0.76
Table 3.4
Confusion Matrix (Prediction-accuracy output) (Cohort 1).
Real value
0 1
Predicted 0 72 18
Value 1 13 24
Accuracy: 0.759
Fig. 2. Receiver-operating characteristic curve (ROC) for the discovery cohort to determine the combination of RV/TLC and FeNO value which best identified a positive methacholine challenge test (MCT) with PC20M≤ 16 mg/ml. The op-timum cut-off point was 0.464 (AUC 0.787, sen-sitivity 59.1%, specificity 84.7%, P < 0.001).
We can speculate that methacholine deposition in the airways may be more proximal if the RV/TLC is higher, thereby increasing the fall in FEV1 upon methacholine inhalation, which is an index better reflecting changes in calibre of intermediate to large airways during the chal-lenge. However, if RV/TLC appears to be good at predicting positive methacholine challenge, it failed to correlate with the magnitude of bronchial hyperresponsiveness in the patients who had a PC20M below
16 mg/ml, which is in keeping with what was reported by Stanbrook et al.
The link between asthma and FeNO has been extensively studied over the last 20 years. We have previously reported that FeNO had a poor sensitivity but a good specificity and positive predictive value for a PC20 < 16 mg/ml in patients referred by chest physicians to a lung function laboratory for symptoms suggestive of asthma and normal spirometry[17]. Overall recent meta-analysis has shown that FeNO has low sensitivity but acceptable specificity to make an asthma diagnosis [18]. The interest of our current study is that it shows that, though not impressive in ROC curve, the contribution of FeNO emerged after multivariate logistic regression. This would suggest that the effect of FeNO may be counteracted by other variables to which it is linked. FeNO is seen as a biomarker of epithelial cell activation in a T2 en-vironment and has been related to the magnitude of airway eosinophilic inflammation[19]. However, FeNO has also been shown to be depen-dent on the airway calibre, with a reduction of its level in exhaled air when bronchial obstruction develops and reduces airway calibre[20]. As lower baseline airway calibre also contributes to bronchial hyper-esponsiveness as indicated by the predictive value of baseline FEV1 on the positivity of PC20M, it may explain why FeNO, though not per-forming strong in the prediction of positive PC20M, emerged as sig-nificant contributor after multiple logistic regression. Our results also show that combining RV/TLC and FeNO in a multiple logistic model improves with an AUC reaching 0.79 and an accuracy of 76%.
Interestingly, FeNO was the index that correlated the most convin-cingly with the severity of bronchial hyperresponsiveness among the subjects who tested positive to methacholine challenge. This confirms, in a mixed population including ICS treated patients, studies that in-vestigated corticoid naïve patients[21,3]. This observation supports the link between epithelial cell activation and smooth muscle airway re-activity.
Finally we acknowledge that our two cohorts of patients were a mix of T2 and non T2 mild to moderate asthma with a large range in FeNO values as well as in sputum and blood eosinophil counts. The existence the two types of asthma is a well accepted observation today, both in mild to moderate and in a severe asthma[22–24]. The average values
Fig. 3. Receiver-operating characteristic curve (ROC) for the validation cohort to determine the RV/TLC value which best identified a positive methacholine challenge test (MCT) with PC20M≤ 16 mg/ml. The optimum cut-off point was 102% pred. (AUC 0.748, sensitivity 71.1%, specificity 67.7%, VPP 83.3%, VPN 50.8%, P < 0.001).
Table 4
Values derived from the ROC curves of lung function indices and FeNO for a positive methacholine challenge in the validation cohort (cohort 2).
AUC Threshold Sensitivity Specificity VPP VPN P-value
RV/TLC (% pred) 0.748 102 0.711 0.677 83.3% 50.8% < 0.001 sGAW (1/kPa*s) 0.620 0.87 0.511 0.708 75.6% 45.1% < 0.05 FeNO (ppb) 0.559 32 0.867 0.385 86% 39.8% 0.13 FEV1 (% pred) 0.689 99 0.511 0.833 78.4% 59% < 0.001 FEV1/FVC (%) 0.683 79 0.689 0.667 82.1% 49.2% < 0.001 Table 5.1
Parameter estimation for logistic regression on the validation cohort for thefive indices model.
Odds ratio Confidence Interval P-value Result
Lower Upper
Intercept 0.215 0.0007 69.63 0.661 Not Significant
FeNO 0.983 0.967 0.999 0.083 Significant
(P < 0.1)
sGAW 0.792 0.244 2.571 0.744 Not Significant
RV/TLC 0.971 0.950 0.992 0.025 Significant
(P < 0.05)
FEV1 1.03 1.001 1.061 0.087 Significant
(P < 0.1)
FEV1/FVC 1.021 0.962 1.084 0.561 Not Significant
AIC: 161.15 Table 5.2
Parameter estimation for logistic regression on the validation cohort for the three indices model.
Odds ratio Confidence Interval P-value Result
Lower Upper
Intercept 0.774 0.018 33.229 0.911 Not Significant RV/TLC 0.970 0.951 0.989 0.012 Significant (P < 0.05) FeNO 0.983 0.967 0.998 0.074 Significant (P < 0.1) FEV1 1.034 1.006 1.061 0.042 Significant (P < 0.05)
of inflammatory biomarkers in the two cohorts presented in this study are rather similar to the ones we previously reported from patients recruited from the same ambulatory care facilities[25]. Thus, we be-lieve ourfinding applies to a general asthmatic population recruited in a secondary care centre.
We conclude that taking into account both an index of lung dis-tension and airway epithelial cell activation may help the clinician to predict the presence of bronchial hyperresponsiveness to methacholine in patients. Combining a lung function index with an airway in-flammatory biomarker is a suitable strategy to approach the existence of bronchial hyperresponsiveness.
CRediT authorship contribution statement
N. Bougard: Writing - original draft, Visualization, Writing - review & editing. H. Nekoee: Methodology, Formal analysis, Validation. F. Schleich: Investigation. F. Guissard: Resources, Data curation. V. Paulus: Resources, Data curation. AF Donneau: Software, Supervision. R. Louis: Conceptualization, Validation, Project administration, Supervision.
Acknowledgment
We acknowledge the financial support of a federal government grant EOS (excellence of science), Belgium (30565447).
Table 5.3
Outputs of ROC curve for two full andfinal models (Cohort 2).
AUC Threshold Sensitivity Specificity VPP VPN P-value Accuracy
Allfive Variables 0.771 0.364 0.689 0.781 84.3% 59.6% < 0.001 0.752
FeNO RV/TLC FEV1
0.769 0.363 0.689 0.771 84% 58.5% < 0.001 0.745
Table 5.4
Confusion Matrix (Prediction-accuracy output) (Cohort 2).
Real value
0 1
Predicted 0 74 14
Value 1 22 31
Accuracy: 0.745.
Fig. 4. Receiver-operating characteristic curve (ROC) for the validation cohort to determine the combination of RV/TLC, FeNO and FEV1 value which best identified a positive methacholine challenge test (MCT) with PC20M≤ 16 mg/ml. The optimum cut-off point was 0.363 (AUC 0.769, sensitivity 68.9%, specificity 77.1%, P < 0.001).
Fig. 5. Correlation between FeNO and PC20 methacholine in the cohort 1 (upper panel) and the cohort 2 (lower panel). Rsis the spearman coefficient of
References
[1] 2019 GINA Main Report [Internet]. Global Initiative for Asthma– GINA. [cited 2020 Jan 29]. Available from:https://ginasthma.org/gina-reports/.
[2] P. Nair, J.G. Martin, D.C. Cockcroft, M. Dolovich, C. Lemiere, L.-P. Boulet, et al., Airway hyperresponsiveness in asthma: measurement and clinical relevance, J. Allergy Clin. Immunol. Practice 5 (3) (2017) 649–659.e2.
[3] R. Louis, N. Bougard, F. Guissard, V. Paulus, M. Henket, F. Schleich,
Bronchodilation test with inhaled salbutamol versus bronchial methacholine chal-lenge to make an asthma diagnosis: do they provide the same information? J. Allergy Clin. Immunol. Pract. (2019) 18.
[4] S.D. Aaron, L.P. Boulet, H.K. Reddel, A.S. Gershon, Underdiagnosis and over-diagnosis of asthma, Am. J. Respir. Crit. Care Med. 198 (8) (2018) 1012–1020. [5] V. Quaedvlieg, J. Sele, M. Henket, R. Louis, Association between asthma control and
bronchial hyperresponsiveness and airways inflammation: a cross-sectional study in daily practice, Clin. Exp. Allergy 39 (12) (2009) 1822–1829.
[6] J.K. Sont, L.N. Willems, E.H. Bel, J.H. van Krieken, J.P. Vandenbroucke, P.J. Sterk, Clinical control and histopathologic outcome of asthma when using airway hy-perresponsiveness as an additional guide to long-term treatment. The AMPUL Study Group, Am. J. Respir. Crit. Care Med. 159 (4 Pt 1) (1999) 1043–1051. [7] American Thoracic Society, European Respiratory Society, ATS/ERS
recommenda-tions for standardized procedures for the online and offline measurement of exhaled lower respiratory nitric oxide and nasal nitric oxide, Am. J. Respir. Crit. Care Med 171 (8) (2005) 912–930.
[8] M.R. Miller, J. Hankinson, V. Brusasco, F. Burgos, R. Casaburi, A. Coates, et al., Standardisation of spirometry, Eur. Respir. J. 26 (2) (2005) 319–338. [9] R. Louis, J. Sele, M. Henket, D. Cataldo, J. Bettiol, L. Seiden, et al., Sputum
eosi-nophil count in a large population of patients with mild to moderate steroid-naive asthma: distribution and relationship with methacholine bronchial hyperrespon-siveness, Allergy 57 (10) (2002) 907–912.
[10] R. Louis, T. Bury, J.L. Corhay, M.F. Radermecker, Acute bronchial and hematologic effects following inhalation of a single dose of PAF. Comparison between asthmatics and normal subjects, Chest 106 (4) (1994) 1094–1099.
[11] P.H. Quanjer, G.J. Tammeling, J.E. Cotes, O.F. Pedersen, R. Peslin, J.C. Yernault, Lung volumes and forced ventilatoryflows. Work Group on Standardization of Respiratory Function Tests. European Community for Coal and Steel. Official po-sition of the European Respiratory Society, Rev. Mal. Respir. 11 (Suppl 3) (1994) 5–40.
[12] G. Laszlo, Standardisation of lung function testing: helpful guidance from the ATS/ ERS Task Force, Thorax 61 (9) (2006) 744–746.
[13] J. Stocks, S. Godfrey, C. Beardsmore, E. Bar-Yishay, R. Castile, ERS/ATS task force on standards for infant respiratory function testing. European Respiratory Society/ American Thoracic Society. Plethysmographic measurements of lung volume and airway resistance. ERS/ATS Task Force on Standards for Infant Respiratory Function Testing. European Respiratory Society/American Thoracic Society, Eur. Respir. J. 17 (2) (2001) 302–312.
[14] Z. Hantos, G. Galgóczy, B. Daróczy, K. Dombos, Computation of the equivalent airway resistance, RES 36 (2) (1978) 64–72.
[15] M.B. Stanbrook, K.R. Chapman, S. Kesten, Gas trapping as a predictor of positive methacholine challenge in patients with normal spirometry results, Chest 107 (4) (1995) 992–995.
[16] D.S. Postma, C. Brightling, S. Baldi, M. Van den Berge, L.M. Fabbri, A. Gagnatelli, et al., Exploring the relevance and extent of small airways dysfunction in asthma (ATLANTIS): baseline data from a prospective cohort study, Lancet Respir. Med. 7 (5) (2019) 402–416.
[17] F.N. Schleich, R. Asandei, M. Manise, J. Sele, L. Seidel, R. Louis, Is FENO50 useful diagnostic tool in suspected asthma? Int. J. Clin. Pract. 66 (2) (2012) 158–165. [18] S. Karrasch, K. Linde, G. Rücker, H. Sommer, M. Karsch-Völk, J. Kleijnen, et al.,
Accuracy of FENO for diagnosing asthma: a systematic review, Thorax 72 (2) (2017) 109–116.
[19] F.N. Schleich, L. Seidel, J. Sele, M. Manise, V. Quaedvlieg, A. Michils, et al., Exhaled nitric oxide thresholds associated with a sputum eosinophil count≥3% in a cohort of unselected patients with asthma, Thorax 65 (12) (2010) 1039–1044. [20] A. Haccuria, A. Michils, S. Michiels, A. Van Muylem, Exhaled nitric oxide: a
bio-marker integrating both lung function and airway inflammation changes, J. Allergy Clin. Immunol. 134 (3) (2014) 554–559.
[21] L.J. Dupont, F. Rochette, M.G. Demedts, G.M. Verleden, Exhaled nitric oxide cor-relates with airway hyperresponsiveness in steroid-naive patients with mild asthma, Am. J. Respir. Crit. Care Med. 157 (3 Pt 1) (1998) 894–898.
[22] M. Amelink, J.C. de Groot, S.B. de Nijs, R. Lutter, A.H. Zwinderman, P.J. Sterk, et al., Severe adult-onset asthma: a distinct phenotype, J. Allergy Clin. Immunol. 132 (2) (2013) 336–341.
[23] F. Schleich, G. Brusselle, R. Louis, O. Vandenplas, A. Michils, C. Pilette, et al., Heterogeneity of phenotypes in severe asthmatics. The Belgian Severe Asthma Registry (BSAR), Respir. Med. 108 (12) (2014) 1723–1732.
[24] J.V. Fahy, Type 2 inflammation in asthma–present in most, absent in many, Nat. Rev. Immunol. 15 (1) (2015) 57–65.
[25] F.N. Schleich, A. Chevremont, V. Paulus, M. Henket, M. Manise, L. Seidel, et al., Importance of concomitant local and systemic eosinophilia in uncontrolled asthma, Eur. Resp. J. 44 (1) (2014) 97–108.