Original Article
Study of Dioxide Carbon Concentration and Indoor Air Quality in Some Buildings in the Equatorial Region of Cameroon (Yaounde)
Modeste Kameni Nematchoua1 René Tchinda2 José A. Orosa3 *Gholamreza Roshan4 1- Environmental Energy Technologies Laboratory, University of Yaounde I, Cameroon.
2- LISIE, University Institute of Technology Fotso Victor, University of Dschang, Cameroon.
3- Department of Energy and M. P. Escuela Técnica Superior de N. y M, University of A Coruña, Paseo de Ronda 51, 15011 A Coruña, Spain.
4- Department of Geography, Golestan University, Gorgan, Iran.
*ghr.roshan@gu.ac.ir
Abstract
Background and purpose: Elevated CO2 rate in a building affect the health of occupant. This
document presents results of an experimental analysis conducted in 50 offices located in 12 buildings with different layer in Cameroon (Yaounde). This study took place in 2012, during the dry and the rainy seasons. The main goal is to show the influence of the building structure, the ventilation and the number of occupants on the CO2 concentration in buildings. The areas chosen were ventilated at 60%.
Materials and Methods:A questionnaire was distributed to occupants. The different values in terms of temperature, air speed, humidity, CO2 concentration and luminosity rate were measured simultaneously during working hours and without the occupants. The measurement took place while offices were naturally ventilated. Values obtained were analyzed and integrated.
Results: Painted buildings with glasses were more pollutant than those made with soil and
wood. A mechanically controlled area was more comfortable but more pollutant than a naturally ventilated area.
Conclusion: The CO2 concentration changes exponentially when the number of people in a
hall increased especially when there are smokers. For temperature ranged from 20.5°C to 28.8°C and the CO2 from 350ppm to 1450ppm, the average consumption of O2 by person varied between 0.0097cfm and 0.0162 cfm.
[Kameni Nematchoua M. Tchinda R. Orosa J. *Roshan Gh.Study of Dioxide Carbon Concentration and Indoor Air Quality in Some Buildings in the Equatorial Region of Cameroon (Yaounde). 2014;2(1): 1-15] http://jhs.mazums.ac.ir
Key words: CO2 Concentration, Indoor Air, Buildings, Equatorial Climate, Health
Study of Dioxide Carbon Concentration and Indoor Air Quality M. Nematchoua et al.
1. Introduction
Following the energetic crisis in the ninety nineties, buildings have been built with tighten envelops, counting on mechanic ventilation to reduce the energetic cost. Thanks to tighten envelops, a great part of the energy contribute to the ventilation (1). Buildings greatly contribute to emission of greenhouse gases in the atmosphere. More than 25% of emissions are generated by the architecture of the building, from the building structure, the maintenance, the heating, the lighting to the indoor fitting up. Consequences of climate change caused by green house gas in buildings resulted in an increase demand in sustainable buildings including a new strengthening of energetic efficiency of houses in different parts of the world (2). Human being produces carbon dioxide (CO2) according
to their normal metabolism. Consequently, CO2 concentrations in
buildings where people live are higher than the concentrations of outdoor air. The level of difference between indoor and outdoor concentration decreased as the ventilation rate of the building per occupant increased(3-4). In many buildings, the number of occupants and the ventilation were not stable, which did not allow to determine the exact CO2
rate. The epidemiologic research showed that the indoor CO2 concentrations were
useful to predict human health and the performance of the human body (5). In fact, a high level of CO2 can cause
headache and changes in breath rhythms in houses. Consequently, in order to keep a good quality of indoor air, the indoor CO2 concentration must be reduced to
certain level (inferior to 1000ppm)(5). CO2 is sometime used as a substitute to
examine the quality of indoor air and the ventilation efficiency. Research made by Seppanen et al (6) showed that occupants of offices of buildings which had a greater difference between the indoor and outdoor CO2 concentrations were
generally sick due to the pollution rate of their buildings. Batagoda and Jayasinghe (7) showed that it was possible to reduce the CO2 concentration by using material
with low emission in the new building; this will also allow reducing the energy cost consumed by the buildings. In the past, in sub-Saharan Africa, no building standard was respected. Nowadays, as Africa faces its population mostly young, the design of its building changes completely. Many builders ignore the influence of the building on health and productivity of the occupants. This study aims at showing the influence of occupants and the layer of building on the CO2 concentration. The adaptive
approach consisted on the distribution of a questionnaire and to take simultaneously the temperature, the CO2
rate, luminosity etc.
2. Materials and Methods
Field Study
2.1. Analysed cities
Cameroon is divided into three climatic zones: the Sudanese, the sudano-Sahelian and the equatorial regions. Cameroon is characterized by an equatorial climate with two main seasons of equal amplitudes. The study was conducted in the equatorial city of Yaounde. Yaounde is the Cameroon political capital and is located approximately at 300 km from the Atlantic coast and enjoys a sub- equatorial climate with four seasons; a large dry season from mid November to late March, a short raining season from April to mid June, a short dry season from mid June to mid August and a long raining season from mid August to mid November. Its altitude is between 600- 800 m. The Yaounde city was built on several hills and enjoys a picturesque setting and a relatively fresh climate respects the coast regions. The maximum temperature is ranged between 30 °C and
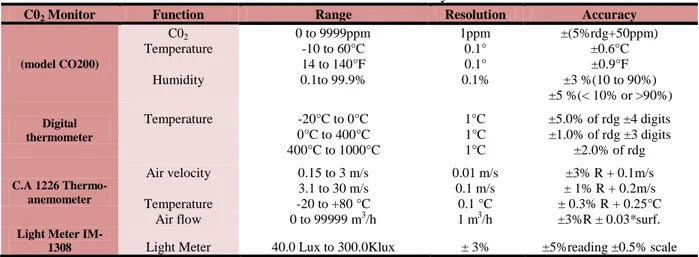
Table 1. Characteristics of the measurement system
Function Range Resolution Accuracy
C02 0 to 9999ppm 1ppm ±(5%rdg+50ppm) Temperature -10 to 60°C 0.1° ±0.6°C 14 to 140°F 0.1° ±0.9°F Humidity 0.1to 99.9% 0.1% ±3 %(10 to 90%) ±5 %(< 10% or >90%) Temperature -20°C to 0°C 1°C ±5.0% of rdg ±4 digits 0°C to 400°C 1°C ±1.0% of rdg ±3 digits 400°C to 1000°C 1°C ±2.0% of rdg Air velocity 0.15 to 3 m/s 0.01 m/s ±3% R + 0.1m/s 3.1 to 30 m/s 0.1 m/s ± 1% R + 0.2m/s Temperature -20 to +80 °C 0.1 °C ± 0.3% R + 0.25°C
Air flow 0 to 99999 m3/h 1 m3/h ±3%R ± 0.03*surf. Light Meter 40.0 Lux to 300.0Klux ± 3% ±5%reading ±0.5% scale
35 °C and the minimum is 15 °C. It unfolds geographically between 3°52' N latitude and 11°32' E longitude. The Yaounde population was about 2.5 Million inhabitants in 2011 due to the early 90s rural exodus which makes super populations with a growth rate estimated at 7 % per year. As a consequence of this fast exodus, several suburbs were created in the western and north parts of the Yaounde city.
2.2. Materials
In this study, indoor air speed, indoor relative humidity, CO2 concentration and indoor air temperature were measured by a thermo-anemometer (model C.A1226) and a CO2 Monitor (model CO200). On the other hand, outdoor temperature, wind speed and relative humidity were collected from the national weather station. All these equipments were calibrated before used to ensure reliability and accuracy. The calibrate equipments give to correct measures of physical parameters of environment. Finally, the sampling accuracy of each device is showed in Table1.
C02 Monitor (model CO200) Digital thermometer C.A 1226 Thermo- anemometer Light Meter IM-
1308
Study of Dioxide Carbon Concentration and Indoor Air Quality M. Nematchoua et al.
2.3. Methodology
The number of samples was 12 buildings humidity varies around 65 ± 30%, while with different layers and structures. This the wind speed rarely reaches 0.47 study took place during the dry and the m/s(13). These different characteristics rainy seasons. 50 offices were chosen in can be explained by the fact that the these buildings. Concerned by solar Yaounde city is built on seven hills.
radiation which influences the quality of indoor air, we choose buildings with the same orientation. The choice of buildings answers at several criteria, concerning the structure and the working of the buildings, as well as their environment. These are of buildings essentially occupied during work hours, it that facilitates the access during the investigation. But the essential criteria were the availability and the desire of people to participate in the investigation. This choice also rested on the inertia of the building. The offices chosen in the buildings have been selected in order to have the different orientations in facade as well as the different configurations of bureau (Individuals and collective). The indoor activity was sedentary. In all these buildings, large windows occupied more than half of the wall and were covered with curtains, preventing the solar radiation from entering inside. Doors were mostly made with wood. Oxygen rate consumed by person was given by the relation established by Persily (10).
2.3.1. Indoor air
It can be observed that, in Yaounde, indoor climate is favorable in terms of study and work. Particularly in the rainy season, the internal temperature decreases few times to 15 °C and it rarely reaches 31 °C in the dry season. The relative average
2.3.2. Field measurement of environmental parameters
The adaptive approach consisted on the distribution of a questionnaire and to take simultaneously physical measure was used. To analyze these effects, a sampling process with frequencies of 10-20 minutes was done during the working hours, particularly, from 8:00 a.m. to 17:00 a.m., and during the unoccupied period from 5:30 p.m to 6:00 a.m., in each season. Furthermore, measurement devices were installed at 7:00 a.m. in order to adapte them and the measurement itself started at 8:00 a.m. On the other hand, sampling devices were placed 1.1 m in height in accordance with the ASHRAE Standard 55 (8) and ISO 7730 (9) requirements. Furthermore, devices were placed far away from any heat source and as close as possible to employees to get the more realistic indices. Once obtained the temperature ,CO2 concentration and relative humidity conditions in each of buildings, the comparison of averages has been carried out by means of the analysis of the variance of a factor (one way Anova) using the statistical software SPSS for a level of significance of 0.05 and a Tukey post hoc to define the homogeneity of coating.
2.3. 3. Occupants written in English and French language, The internal activity is sedentary. In this which are the official languages of the study, we first of all varied the number of country. The language preferences of the occupant till 10 persons in each office by occupants were considered while imposing natural ventilation followed by distributing these questionnaires to them. natural ventilation in order to study the They were constructed in accordance with influence of occupants on the indoor CO2 ISO 7730 (9) and ISO 10551 standards concentration. After that, we studied these (12). From these questionnaires, clothing offices when occupants were out. The and metabolic rate were assessed and, at number of occupants was not predictable the same time, it was also possible to in buildings during working hours. Offices know the sex, age, weight and size of each studied were more visited during working occupant. Finally, like in previous research hours (from 8 am to 5pm). From 8 pm, the works, thanks to the questionnaires, it was areas studied were unoccupied. It was also possible to find out the thermal sensation, thermal preference and acceptance of the thermal environment in the occupied areas.
3. Results
In this study, workers have been subject to natural ventilation, then the artificial one. In the different offices, ages of individuals varied from 28 to 45 ans. All were considered as adults, their size varies from 1.55 to 1.82m and their weights from 62 to 102 kg. Activities in the buildings studied were sedentary (1 to 1.2 met) and the resistance for occupant clothes varied from 0.5 to 1.45clo with an average of 0.9clo for women and O.7clo for men. It has been proven that the type of ventilation, occupants and structure of the building had direct impacts on the CO2 rate in offices. Table2 gives some characteristics of physical measures and questionnaires.
forbidden to smoke during working hours and to enter the study hall with toxic tools. 2.3. 4. Buildings
The age of buildings studied varied from 5 to 35ans. There were two different types of buildings, those with local materials (wood, soil and stone) and imported materials (glass etc.) their heights varied from 3.8 to 4.4m and areas were ranged between 32 and 120m2. All openings were closed. Windows were made with glasses and varied between 0.63 and 1.2 m2. The windows were covered with curtains which did not allow solar radiation to enter the office.
2.3. 5. Subjective measurements
The questionnaires employed in this work were distributed before and in the afternoon. More of 1000 questionnaires were analyzed, these questionnaires were
Study of Dioxide Carbon Concentration and Indoor Air Quality M. Nematchoua et al.
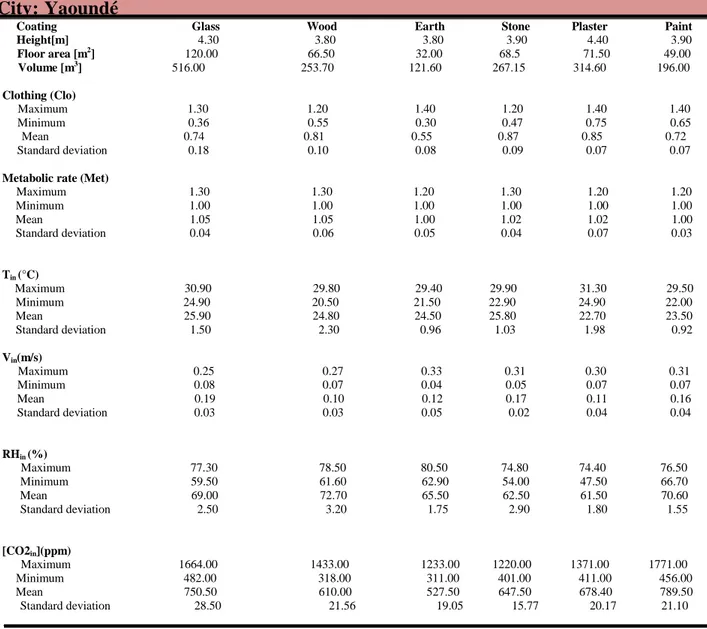
Table 2. Synthesis of measured data in Cities
City: Yaoundé
Coating Glass Wood Earth Stone Plaster Paint
Height[m] 4.30 3.80 3.80 3.90 4.40 3.90 Floor area [m2] 120.00 66.50 32.00 68.5 71.50 49.00 Volume [m3] 516.00 253.70 121.60 267.15 314.60 196.00 Clothing (Clo) Maximum 1.30 1.20 1.40 1.20 1.40 1.40 Minimum 0.36 0.55 0.30 0.47 0.75 0.65 Mean 0.74 0.81 0.55 0.87 0.85 0.72 Standard deviation 0.18 0.10 0.08 0.09 0.07 0.07
Metabolic rate (Met)
Maximum 1.30 1.30 1.20 1.30 1.20 1.20 Minimum 1.00 1.00 1.00 1.00 1.00 1.00 Mean 1.05 1.05 1.00 1.02 1.02 1.00 Standard deviation 0.04 0.06 0.05 0.04 0.07 0.03 Tin (°C) Maximum 30.90 29.80 29.40 29.90 31.30 29.50 Minimum 24.90 20.50 21.50 22.90 24.90 22.00 Mean 25.90 24.80 24.50 25.80 22.70 23.50 Standard deviation 1.50 2.30 0.96 1.03 1.98 0.92 Vin(m/s) Maximum 0.25 0.27 0.33 0.31 0.30 0.31 Minimum 0.08 0.07 0.04 0.05 0.07 0.07 Mean 0.19 0.10 0.12 0.17 0.11 0.16 Standard deviation 0.03 0.03 0.05 0.02 0.04 0.04 RHin (%) Maximum 77.30 78.50 80.50 74.80 74.40 76.50 Minimum 59.50 61.60 62.90 54.00 47.50 66.70 Mean 69.00 72.70 65.50 62.50 61.50 70.60 Standard deviation 2.50 3.20 1.75 2.90 1.80 1.55 [CO2in](ppm) Maximum 1664.00 1433.00 1233.00 1220.00 1371.00 1771.00 Minimum 482.00 318.00 311.00 401.00 411.00 456.00 Mean 750.50 610.00 527.50 647.50 678.40 789.50 Standard deviation 28.50 21.56 19.05 15.77 20.17 21.10
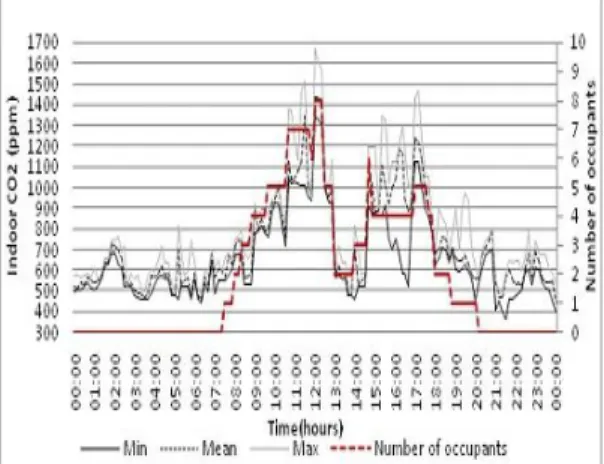
3.1. CO2 and influence of occupants
Figures 1 and 2 shows the CO2 evolution
according to the number of occupants in the natural and artificial ventilation. When offices were naturally ventilated, during unoccupied hours (from 0:00am to7:30am and from 6:00 pm to 0:00am), the CO2
concentration varied from 350 to 640 ppm, and from 8 :00am to 6 :00ppm, CO2
increased considerably from 350 to 1435ppm. It achieved a peak at 03:00pm. This increase in CO2 can be easily
explained by the fact that the different offices were occupied by workers during working hours. Their activities have an impact on the CO2 concentration.
When these offices were naturally phenomenon for everybody, during ventilated and employees enter breathing, absorbs oxygen and rejects progressively the hall of study from one to CO2. However, the variation of the CO2 6, now the resistance of their clothes from rate between individuals depends on the 0.6clo to 1.3clo, all subject to office and physical, psychological and health aspects. research, we noticed that the concentration Smokers and other people having chest of CO2 increased from 109 to 235ppm by infections produce a higher CO2 rate than
person. This variation not constant by healthy persons.(14-16) .Then in the same person can affect the health of each areas of study, when we move to occupant. When a group of 20 persons ventilation system, the different hall entered, we noticed that CO2 increased become more comfortable, but more
considerably so that it is difficult to pollutant (see figure2). During unoccupied determine the amount of CO2 brought by hours, the CO2 varied from 350 to 800
each person in these study halls. The ppm, whereas during working hours, when average obtained during working hours 8 people entered progressively, the was 513.5ppm, with a standard deviation maximum concentration obtained was of 29.5. Increase of CO2 in halls when 1670ppm.
occupants were in is a natural
Fig 1. Indoor CO2 concentration according to the number of occupants in natural ventilation
Fig 2. Indoor CO2 concentration function of number of occupants in air conditioned
Study of Dioxide Carbon Concentration and Indoor Air Quality M. Nematchoua et al.
This value is considerable compared to physical parameters measured. When the offices naturally ventilated. The average offices were subject to natural ventilation value obtained from (8:00 to 18:00) was during the different seasons, we noticed a 555,5ppm with a standard deviation of temperature ranged from 20.5°C to 25.4. The pollution rate by each occupant 28.8°C, the CO2 varied from 350ppm to
in these conditions became difficult to 1450ppm. The CO2 average obtained for
evaluate. The increase can be due to the these different values was 513ppm; this fact that the ventilation system used was corresponded to an average temperature of slightly pollutant because when using fluid 25.25°C. The standard deviation was 13.5 R22 (e.g. R32/125 (60/40), for CO2 C02 and 0.75 for temperature
R32/125/134a/290 (20/55/20/5), etc. ) and values. The humidity rate was not stable; it R502 (e.g. R32/125/143a (10/45/45), varied instantaneously according to hall R125/143a (45/55), etc. ), actually
forbidden by the international community, the CO2 concentration increases suddenly
according to ventilation system used when passing from a natural area to an artificial. 3.2. CO2 and Indoor Air Quality
In these offices naturally ventilated, the indoor climate was slightly acceptable but not acceptable in study and working conditions. During the dry season, temperature sometime achieved 31°C in the office. The consumption rate by individual greatly depended on the activity, the size and the weight of occupant. By applying all these elements to equations (1) to (2), we deduced that the average obtained in term of oxygen consumption by person was 0.0051L/s(0.01cfm), different values were ranged from 0.0046L/s to 0.0077L/s (0.0097cfm à0.0162cfm). These values were acceptable, compared to the range of oxygen absorption by person established in (10). From figures 3 to 5, we can see the CO2 variation according to some
studied and the season. The different humidity values varied from 42.0% to 83.5%. The standard deviation average was 318.5ppm and 1.75 respectively for CO2 values and relative humidity. The
correlation obtained between various humidity values was good (R=0.896). from different elements (temperature and relative humidity), we can certify that the quality of indoor air was not always comfortable or acceptable compared to ranges established by standard norms ASHRAE (8), for temperature ranged from 23°C to 26°C and humidity from 30% to 60% and in CIBSE (11), the comfort temperature was ranged between 22°C to 24 °C and humidity between 30 % and 60 %. The different ranges were established from works from the North America, Asia and Europe, sub-Saharan Africa which are to be explored. Figure 5 shows the different values of CO2 ranged
from 350 to 1600ppm according to the wind variation from 0.03m/s to 0.31m/s. the wind speed was unstable for it varied
according to seasons because of the building envelope got warm both with the various average values of wind obtained outdoor air contact and the global solar 0,08m/s and 0,11m/s respectively in dry radiation. The heat absorbed was partially and rainy seasons. Outdoor wind breaths stocked and propagated with hours by such as monsoon (soft and humid) and induction inside the building. During the harmatan (hot and dry wind) directly acted night, the outdoor air and the phenomenon on the indoor comfort. The indoor air was of heat transfer was inversed. The intensity till acceptable for workers used to their of these phenomenons of heat transfer working places but not for visitors. depends on the inertia and the heat Compared to the range established in ISO insulation. After the analysis of 7730 (9), which fixes the comfort air questionnaires, we deduced that 63.8% of speed inferior to 0.25m/s, it was possible workers found their place acceptable, to assert that these offices were not always while 53.5% of occupants found it neutral comfortable. For occupation densities of 5 during the two seasons. The different heat m2 by person, the air change rate varied preferences varied according to seasons. In from 1.1 to 1.9m3.h-1. The instability of the fact, during the rainy season, 63.5% indoor climate could be caused by the fact preferred an unchanged place while in the that during hot hours of the day, the dry season, 59.7% preferred a colder place.
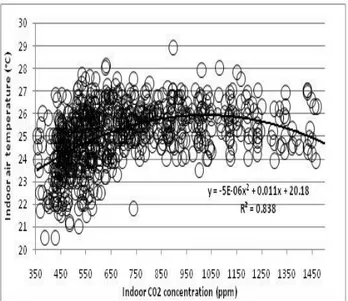
Fig 3. Variation of the air temperature in function of CO2 concentration
For temperature ranged between 20 and 30°C and CO2 from 350 to 1450 ppm, the
following correlation was obtained:
Ta = -5.e (-6)
CO2 2
+ 0.011CO2 + 20.18 , R² =0.84 (1).
Study of Dioxide Carbon Concentration and Indoor Air Quality M. Nematchoua et al.
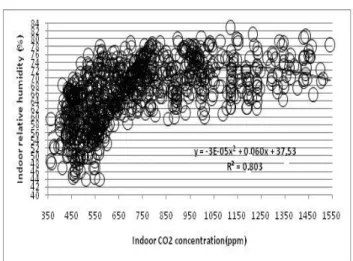
Fig 4. Variation of relative humidity according to CO2 concentration For relative humidity ranged between 40
and 85% and CO2 from 350 to 1550 ppm,
the following correlation was obtained:
Fig 5. Variation of air speed according to CO2 concentration
For air speed ranged between 0 and the different offices. During working O.35m/s and CO2 from 350 to 1650 ppm,
the following correlation was obtained:
Va = -3.e (-9)
CO2 2
+ 9.e(-6)CO2 + 0.144 , R² =0.6. (3)
It has been obtained a good correlation (R² =0.84) between air temperature and CO2,
between relative humidity and CO2 (R²
=0.81) , but also between air speed and CO2 .The luminosity varied according to
Hr= -3.e(-5)CO2 2
+ 0.06CO2 + 37.53, R² =0.81. (2)
hours, it varied from 77.5 to 242.6 lux. The average obtained during the two seasons in twelve buildings was 156 lux this remained insufficient compared to values prescribed by international norms which has to be superior to 350lux for office activities (14).This average is close to that obtained by Ogbonna(16).
3.3. CO2 and building structure
The structure of the building influences the CO2 concentration in buildings. In
figure 6 and 7, we observed the evolution of the CO2 during the dry season in
naturally ventilated buildings. For average values of CO2 of 400 to 850ppm, the
average obtained in the different types of building with natural ventilation was 441,5ppm, with a standard ventilation of 12.5 and significant value of 0.45. As soon as the ventilation started for CO2 average
values from 350 to 980ppm, the average obtained was 519.6ppm with a standard deviation of 19.8 and significant value of 0.66 in different offices. The CO2 average
rate when passing from a naturally ventilated to an artificially ventilated area, varied from 482.5 to 551.5ppm (standard deviation(SD) of 12.6), in buildings with
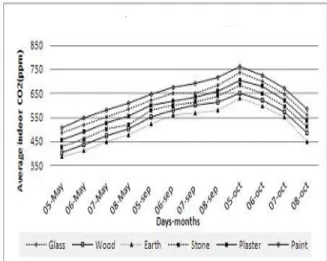
Fig 6. Type of office & CO2 Concentration during dry season in Natural ventilation (NV)
glasses; from 97.5 to 484ppm(SD=17.6), in buildings with wood; from 377.5 to 461ppm(SD=4.9), in buildings with soil; from 422,5 to 509.5ppm(SD=10.4), in buildings with stones; from 455 to 534ppm(SD=7.8), in buildings with plasters and from 513.5 to 578ppm(SD=8.6), in painted buildings. From these results, we could conclude that the concentration of CO2 was not stable, it
varied according to building. Among the six types of offices studied, CO2 rate was
higher in painted buildings, followed by buildings with glasses. This CO2 rate was
lower in buildings with soil and wood. These values confirm the results found by Ogbonna and Harris(16). The different variations explain the influence of building materials on the CO2 concentration
(14-15).
Study of Dioxide Carbon Concentration and Indoor Air Quality M. Nematchoua et al.
Fig. 7 Type of office & CO2 Concentration during dry season in Air Conditioned (AC)
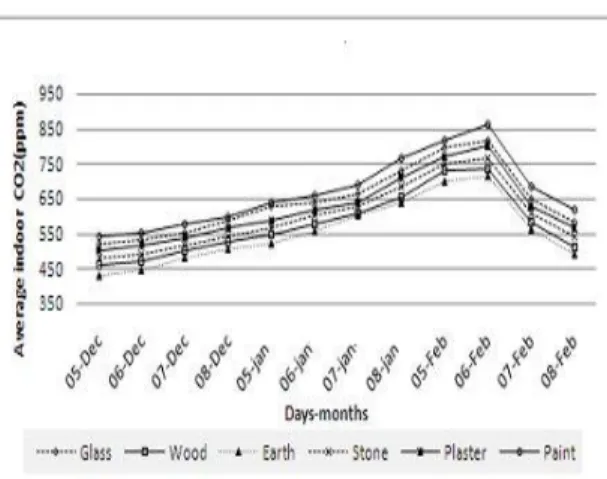
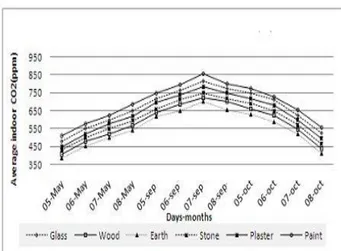
In rainy season (see figure figure8 and 9), painted offices. From these results, we average obtained are ranged from 370 to could conclude that the CO2 average 750ppm(SD=13.9) and from 360 to concentration was higher in offices with 850ppm(SD=19.3), respectively in natural wood and plaster and lower in painted and ventilated area. Passing from one area buildings. When the outdoor CO2 to another, we noticed an increase of concentration was analyzed, we found that 20.1212 ppm(for a significant value(S.V) of these figures were grouped according to 0.17) in buildings with glasses ; of significant value of 0.97 with an average 22.5015ppm(S.V=0.63) in building with value of 850ppm and a standard deviation wood; of 20.2301ppm(S.V=0.35) in of 13.6. Moreover, buildings showed an buildings with soil; of 21.3319 average indoor CO2 of 730.5ppm and a ppm(S.V=0.48) in building with stone; of standard deviation of 17.5 for a standard 22.5760ppm(S.V=0.78) in buildings with significance 0.59.
plaster and of 12.5071ppm(S.V=0.09) in
Fig 8. Type of office & CO2 Concentration during rainy season in Natural ventilation (NV)
Fig 9. Type of office & CO2 Concentration during rainy season in Air Conditioned (AC)
Figure 10 shows the indoor and outdoor concentration was regularly superior to the CO2 evolution. The different CO2 values indoor concentration. The more offices were varied from 350ppm to 1650ppm with an visited, the more indoor concentration was average of 1100ppm for outdoor CO2 and considerable compared to the outdoor 995ppm for indoor CO2. The outdoor CO2 concentration.
Fig 10. Outdoor and indoor CO2
4. Discussion
The CO2 indoor concentration was very different compared to the outdoor concentration because of indoor activity of inhabitants and of the air conditioned. In general, the indoor air quality depends on its rate of pollution, its moisture level, and the quality of ventilation. However,
depending on their effects, the indices that characterize indoor air quality can be classified into two categories (17): medical and odour indices. According to The World Health report 2002, indoor air quality is responsible for 2.7 % of the global burden of disease (15).
Study of Dioxide Carbon Concentration and Indoor Air Quality M. Nematchoua et al.
The more comfortable buildings were very is less pollutant than an artificially control often more pollutant. The higher level of area. For oxygen consumption average of CO2 in painted offices and office with 0.01cfm by person, the different values glasses could be explained by the fact that were ranged from 0.0097cfm to 0.0162cfm. the imported materials were made with the The increase in CO2 concentration was characteristics of the home country, when higher in naturally ventilated area. This the materials were imported, they have been concentration increased from 109 to affected by the climate of its new area and 235ppm by person according to their sometime produced toxic and pollutant working place and their activities. The smells (13). Generally, when the outdoor human body been delicate, the indoor CO2 temperature was inferior to the skin concentration was useful to predict temperature (34 to 35°C), ventilation individual health and their performance. procured a feeling of thermal comfort. To
make the maximum profit of the natural ventilation in sub-Saharan areas, buildings must be oriented perpendicular to the dominant winds and have large openings. This results is not surprising, it confirms the work of Jannot (18), in sub-Saharan areas. In this research, an experimental analysis was made in 12 buildings of different layers and with many offices, during two seasons. Results showed that the ventilation of an area, the structure of the buildings and occupants could impact the pollution rate of that area. Results from measuring instruments were not always on the same length with subjective answer of occupants, this is why it has been proven that areas commonly found acceptable were more often very pollutant. Occupants used to their offices hardly found their offices pollutant. We concluded that a natural ventilated area
Painted buildings and buildings with glasses were more pollutant whereas those with soil were less pollutant. Passing from a natural area to an air-conditioned area, the CO2 average rate increased from 20ppm to 100ppm according to the types of buildings. Architects and designers aware of this must encourage local material as far as building is concerned. Simple and non pollutant ventilation equipments such as fan- humidifier must be used to reduce the CO2 concentration in halls.
Acknowledgments
The authors are grateful to the administration and all staff of studied buildings for having provided us with measuring devices. They also thank all those near and far who participated in the preparation of this work during the field study.
References
1.Lu XS, Estimation of indoor moisture generation rate from measurement in Buildings. Building and Environment 2003; 38(5):665- 675.
2.Chuck W, F Yu, Jeong Tai Kim. Low-Carbon Housings and Indoor Air Quality,SHB2012-6th international symposium on sustainable healthy buildings , Korea 27 February 2012;391(412). 3. ASTM, Standard guide for using indoor carbon dioxide concentrations to evaluate indoor air quality and ventilation.
4.Persily AK, Evaluating building IAQ and ventilation with indoor carbon dioxide. ASHRAE Transactions,1997; 103(2): 193-204. 5. ASHRAE. Ventilation for acceptable indoor air quality. ANSI/ASHRAE Standard 62-2001; 10(20).
6. Seppanen O A, Fisk W J, Mendell, MJ. Association of ventilation rates and CO2
concentrations with health and other human responses in commercial and institutional buildings. Indoor Air 9, 1999; 226-252.
7.Batagoda JH, Jayasinghe C. Effect of building ventilation on indoor environment. International Conference on Sustainable Built Environment (ICSBE-2010) Kandy, 2010;13-14.
8.ASHRAE-55,Thermal environmental conditions for human occupancy, Atlanta, ASHRAE,2004; 1(10).
9.ISO 7730 Standard. Ergonomics of the thermal environment analytical determination and interpretation of thermal comfort using calculation of the PMV and PPD indices and
local thermal comfort criteria, London, UK,2005.
10. Persily AK, Ventilation, carbone dioxide and ASHRAE Standard 62-1993. ASHRAE Journal 1993; 35(7):40-44.
11.CIBSE. 1999. "Environmental design, CIBSE Guide A", the chartered Institution of Building Services Engineers, London.
12.UNI EN ISO 10551. Ergonomia degli ambienti termici – valutazione dell’influenza dell’ambiente termico mediante scale di giudizio soggettivo; Gennaio 2002.
13. Modeste K, René T, José AO. Thermal comfort and energy consumption in modern versus traditional buildings in Cameroon: A questionnaire-based statistical study. Applied Energy 2014;114 : 687–699.
14. Malchaire J, Critères optimaux de ventilation, d’éclairage et de conditions thermiques de l’habitat dans le contexte des économies d’énergie. Organisation Mondiale de la Santé –Bureau Régional de l’Europe, Copenhague, ICP/BSM 002, Novembre 1992. 15. The World Health Organisation, 2002
Report.
16.Ogbonna A.C., Harris,D.J. Thermal comfort in sub-Saharan Africa:Field study report in Jos- Nigeria.Applied Energy 85 (2008):1–11.
17. Bailly A, Clerc-Renaud M, Rutman E, Ternant C. Traitement de l’air et climatisation: Généralités. Techniques de l’Ingénieur, traité Génie Énergétique, Doc. BE 9 270.
18. Jannot Y., DjiakoT, Economie d’Energie et confort thermique dans l’habitat en zone tropical, juin 1993 ,166 (173):23-44.