University of Liege, Belgium Faculty of Applied Sciences GIGA-Cardiovascular Sciences Thermodynamics of Irreversible Processes
Tight Glycaemic Control
Model-based methods to answer critical questions about
this controversial therapy
By Sophie Penning Biomedical Engineer
Supervised by Thomas Desaive
A thesis submitted in fulfilment of the requirements for the degree of Doctor of Philosophy in Engineering Sciences
II
The present dissertation has been evaluated by the jury members:
Dr. T. Desaive, supervisor, University of Liege, Liege, Belgium Pr. R. Sepulchre, co-supervisor, University of Liege, Liege, Belgium Pr. J.G. Chase, University of Canterbury, Christchurch, New Zealand Pr. P.C. Dauby, University of Liege, Liege, Belgium Pr. B. Lambermont, University Hospital of Liege, Liege, Belgium Pr. J.-C. Preiser, Erasme Hospital, Brussels, Belgium Pr. D. Ernst, University of Liege, Liege Belgium
Cover picture: © 2013 Microsoft Corporation
The research described in the present dissertation was financially supported by the National Funds for Scientific Research (Belgium) and the Fonds Léon Fredericq (Belgium).
III
Abstract
Critically ill patients often present high and variable glycaemic levels, and low insulin sensitivity, all associated with worsened patient outcome. Glycaemic control aims to reduce and stabilise glycaemic levels minimising hypoglycaemic risk. Model-based protocols can provide a safe, effective way to manage inter- and intra- patient variability and allow customised and patient-specific glycaemic control approach. Developing safe and effective model-based protocols that fit within practical clinical workflow is thus today’s great challenge. This thesis develops answers to three key questions related to glycaemic control implementation in intensive care units.
What do intensive care clinicians want in glycaemic control?
This research shows that there is a real need for computerised protocols and emerging interest for model-based protocols with prediction capability. Whatever the protocol type, glycaemic control protocols should be designed to meet intensive care staff expectations. The four main protocol elements expected are safety, efficiency, ease-of-use and adaptive control. All these elements with published clinical studies related to a glycaemic control protocol help to enhance trust in glycaemic control. The opportunity to realise pilot clinical trials in their own intensive care unit also enhances clinician trust.
What is the best glycaemic target to achieve during glycaemic control?
This research provides insight on two primary issues that impede glycaemic control implementation in intensive care units. First, the “cumulative time in band” metric is defined to assess glycaemic control performance in real time. The single metric encapsulates the need to achieve control of both glycaemic level and variability, as well as linking the level of achievement to patient outcome over each day of stay. Second, this research shows that increased cumulative time in an intermediate
IV
glycaemic band (4.0-7.0 mmol/L) is associated with higher odds of living if hypoglycaemia is avoided. This finding suggests that effective glycaemic control positively influences patient outcome, regardless of how this control is achieved.
How to achieve safe and effective glycaemic control?
This thesis focuses on the implementation of the STAR framework in intensive care units at the Centre Hospitalier Universitaire in Liege, Belgium. STAR is a model-based glycaemic control framework accounting for evolving physiological patient condition. STAR enables a glycaemic control that fits clinical practice and meets clinician requirements, as it can be customised for clinically specified glycaemic targets, control approaches, and clinical resources. Virtual trials are used to develop and optimise the STAR framework and then clinical trials are performed to assess STAR performance in real, clinical conditions.
The first implementation of the STAR framework is associated with safe, effective glycaemic control, but with increased clinical workload. This first pilot trial also shows a high level of insulin sensitivity variability in this Belgian group of primarily cardiovascular patients compared to medical intensive care patients. Based on these issues, the STAR framework is improved to enhance its performance and usability in a real, clinical environment.
The second implementation of the STAR framework successfully reduces clinical workload, while maintaining control quality and safety. However, this second pilot trial highlights a “lack of trust” in the protocol recommendations and showed that nurses were reluctant to insulin rate changes. The main objective of the third STAR implementation is thus to improve nurse compliance to protocol recommendations, while maintaining glycaemic control efficiency and safety. An analysis is then performed to understand why nursing staff do not follow GC protocol recommendations in the medical ICU where the next pilot trial will be performed. Results show that nurses are not compliant with a protocol that does not account for patient variability. This finding suggests that STAR that accounts for this variability could enhance glycaemic control performance. Virtual results show that this enhanced STAR framework should provide safe, effective glycaemic control, at acceptable workload.
Finally, this thesis presents the interest of implementing glycaemic control in association with hyper-insulinemia euglycaemia therapy to safely optimise insulin and glucose dosing. More data and subsequent studies are required to more accurately determine whether the STAR approach has to be adapted for patients receiving high insulin doses, and to deeply study insulin clearance processes during the hyper-insulinemia euglycaemia therapy.
V
Résumé
Les patients hospitalisés dans les unités de soins intensifs présentent souvent des niveaux de glycémie élevés et variables, ainsi qu’une faible sensibilité à l’insuline, qui sont associés à une issue clinique plus défavorable. Le contrôle glycémique vise à réduire et stabiliser les niveaux glycémiques, tout en minimisant le risque d’hypoglycémie. Les protocoles de contrôle basés sur des modèles offrent un moyen sûr et efficace de gérer la variabilité inter- et intra- patient et permettent un contrôle glycémique adaptable et spécifique à chaque patient. Le développement de ce type de protocoles est actuellement un défi important. Cette thèse apporte des réponses à trois grandes questions relatives à l’application du contrôle glycémique en milieu hospitalier.
Que souhaitent les médecins des soins intensifs ?
Cette thèse met en évidence le besoin de protocoles informatisés et l’intérêt grandissant pour les protocoles basés sur des modèles et utilisant des prédictions. Tout protocole de contrôle glycémique devrait être conçu afin de rencontrer les attentes du personnel clinique. Les quatre éléments souhaités sont la sécurité, l’efficacité, la facilité d’utilisation et l’adaptabilité. Tous ces éléments, ainsi que la publication d’études cliniques relatives à l’application d’un protocole, augmentent la confiance des médecins dans un protocole de contrôle glycémique. Cette confiance est également accrue par la possibilité de réaliser un essai clinique pour tester le protocole en milieu hospitalier.
Quelle est le niveau glycémique optimal à atteindre durant le contrôle glycémique ?
Tout d’abord, une nouvelle mesure est définie pour évaluer la performance du contrôle glycémique en temps réel : le temps cumulé dans une bande glycémique donnée. Cette mesure permet, à elle seule, d’évaluer les niveaux glycémiques et leur variabilité, ainsi que l’issue clinique des patients. Ensuite, cette recherche montre qu’une augmentation du temps cumulé passé dans la bande
VI
glycémique 4.0-7.0 mmol/L est associée à de meilleures chances de survie si le risque d’hypoglycémie est minimisé. Ce résultat suggère qu’un contrôle glycémique efficace est bénéfique pour l’issue clinique des patients, indépendamment de la manière dont le contrôle est réalisé.
Comment arriver à un contrôle glycémique sûr et efficace ?
Cette thèse se concentre sur l’application de la méthode de contrôle glycémique STAR dans des unités de soins intensifs du Centre Hospitalier Universitaire de Liège (Belgique). La méthode STAR, basée sur des modèles et utilisant des prédictions, prend en compte l’évolution de la condition clinique du patient. Cette méthode permet un contrôle glycémique en adéquation avec la pratique clinique locale et qui rencontre les attentes des médecins. Le développement et l’optimisation de la méthode STAR sont réalisés avec des essais virtuels. Ensuite, des essais cliniques permettent d’évaluer la performance de cette méthode en situation réelle.
La première application de STAR est associée à un contrôle glycémique sûr et efficace mais à une charge de travail importante. Ce premier essai clinique met également en évidence une variabilité importante de la sensibilité à l’insuline des patients belges hospitalisés suite à une opération cardiovasculaire. La méthode STAR est alors améliorée pour la rendre plus performante et plus aisément applicable en milieu clinique.
La deuxième application de STAR réduit avec succès la charge de travail du personnel, tout en maintenant la qualité et la sécurité du contrôle glycémique. Cependant, cet essai clinique montre un manque de confiance du personnel infirmier par rapport aux recommandations du protocole. L’objectif de la troisième application de STAR est donc d’augmenter la compliance du personnel infirmier en garantissant un contrôle glycémique efficace et sûr. Une analyse de compliance est alors réalisée dans l’unité de soins intensifs dans laquelle aura lieu le prochain essai clinique. Cette analyse montre que les recommandations d’un protocole ne sont pas toujours suivies si ce dernier ne permet pas de gérer efficacement la variabilité des patients. STAR, qui prend en compte cette variabilité, pourrait donc permettre un contrôle plus efficace. Les essais virtuels confirment que STAR permettrait un contrôle glycémique sûr et efficace, avec une charge de travail acceptable. Enfin, cette thèse présente l’intérêt d’appliquer le contrôle glycémique en association avec la thérapie du clamp euglycémique hyperinsulinique pour optimiser les dosages d’insuline et de nutrition. Davantage de données et d’études sont nécessaires pour déterminer avec précision si la méthode de contrôle STAR doit être adaptée pour les patients recevant des doses importantes d’insuline, ainsi que pour étudier plus en profondeur les processus d’élimination de l’insuline durant le clamp euglycémique hyperinsulinique.
VII
Acknowledgements
First, I would like to thank my supervisor, Thomas Desaive, for believing in my research project. Throughout my thesis, he shared his scientific experience and introduced me to the scientific and medical fields related to my research. His scientific collaboration with the Professor Geoff Chase gave me the unique opportunity to work with a research group that is considered as expert in my research topic, and to improve my knowledge.
I would also like to thank Geoff Chase for his scientific insight on my research, his constructive criticism, his involvement in my research whatever the time of the day or the night, and his welcoming of me to his department in New-Zealand.
Many thanks to Chris Pretty for his advice and the time he spent reviewing my drafts throughout my thesis. He helped me in dealing with practical aspects of my stay abroad and was a great guide, inside and outside the university environment. His welcoming and kindness made my stay in New Zealand more enjoyable.
I also gratefully thank Pierre Dauby for giving me the opportunity of supervising his students and for his continued enthusiasm.
I would like to thank Hugues Maréchal, Jean-Charles Preiser, Paul Massion and Bernard Lambermont from the University Hospital of Liege and Erasme Hospital of Brussels for believing in my project and giving me the unique opportunity of working in a real, clinical environment. Many thanks to my colleagues at the University of Liege who all contributed to create a pleasant working environment. In particular, I would like to thank Alexandra Lucas who gave me her support at the beginning of my research and shared her daily happiness with me. I would like to thank Sabine and Sarah, who became my friends during our working hours. I thank them for making my office a friendship environment. I thank them for all their personal advice, for sharing their life with me during all these months and for encouraging me throughout my research, especially when I was abroad.
VIII
I would like to thank Clémentine François, Capucine Lardinois and Charlotte De Bien for their outstanding support and their friendship all the way through my time at university.
Finally, I thank all my family for their encouragement and support and most importantly, I thank Antoine Pironet for his understanding, and for making my experience abroad an amazing time and an enriching experience.
IX
Table of contents
Abstract ... III Résumé ... V Acknowledgements ... VII Table of contents ... IX List of figures ... XV List of tables ... XVII List of abbreviations ... XIXChapter 1. Introduction ... 1
Chapter 2. Background... 3
2.1. Physiology of the glucose-insulin system ... 3
2.1.1. Metabolic processes ... 4
2.1.2. Hyperglycaemia - Insulin action ... 6
2.1.3. Hypoglycaemia - Glucagon (and epinephrine) action ... 7
2.2. Stress-induced hyperglycaemia and insulin sensitivity in critically ill patients ... 7
2.2.1. Critical illness ... 8
2.2.2. Treatment ... 12
2.2.3. Nutrition ... 12
2.3. Glycaemic control in intensive care units... 12
2.4. Model-based glycaemic control protocols ... 14
X
2.5.1. Model 1 ... 16
2.5.2. Model 2 ... 18
2.5.3. Model 3 ... 19
2.5.4. Insulin sensitivity ... 20
2.5.5. Stochastic model of insulin sensitivity variability ... 21
2.6. STAR, a model-based glycaemic control approach ... 22
2.7. Virtual trials ... 25
2.7.1. Identification of insulin sensitivity ... 26
2.7.2. Simulation ... 26
2.7.3. Data analysis ... 27
2.8. Clinical trials ... 29
2.9. Summary ... 30
Chapter 3. What do clinicians want in glycaemic control? ... 31
3.1. Introduction ... 31
3.2. Method ... 32
3.3. Results ... 33
3.3.1. Characteristics of responding ICUs ... 33
3.3.2. Glycaemic control in ICU ... 34
3.3.3. ICU clinician expectations and opinions about glycaemic control ... 35
3.3.4. Processes related to GC implementation in ICUs ... 36
3.4. Discussion ... 37
3.5. Summary ... 40
Chapter 4. What is the best glycaemic target to achieve during glycaemic control? ... 43
4.1. State of the art ... 44
4.2. Glycaemic target band: performance metric and level ... 45
4.2.1. Introduction ... 45
4.2.2. Method ... 45
4.2.3. Results ... 48
4.2.4. Discussion ... 48
XI 4.3.1. Introduction ... 52 4.3.2. Method ... 52 4.3.3. Results ... 56 4.3.4. Discussion... 59 4.4. Summary ... 61
Chapter 5. How to achieve glycaemic control in intensive care unit settings? First pilot trial 63 5.1. Introduction ... 63
5.2. Virtual trials ... 64
5.2.1. Patient cohort ... 64
5.2.2. STAR protocol framework ... 65
5.2.3. STAR-Liege 1 protocol ... 66 5.2.4. Results ... 68 5.3. Clinical trials ... 69 5.3.1. Patients ... 70 5.3.2. GC performance ... 71 5.3.3. Prediction performance ... 75 5.3.4. Nurse compliance ... 75 5.3.5. Discussion... 76 5.4. Summary ... 78
Chapter 6. How to resolve the issues of the glycaemic control clinical implementation? Enhanced glycaemic control approach ... 81
6.1. Improvement of the stochastic model ... 82
6.1.1. Introduction ... 82
6.1.2. Method ... 82
6.1.3. Results ... 83
6.1.4. Discussion... 84
6.2. Improvement of the STAR framework ... 86
6.2.1. Reduction of measurement frequency ... 86
6.2.2. Improvement of the targeting method ... 86
6.3. Enhancement of insulin kinetic modelling ... 87
6.4. New enhanced STAR protocol framework ... 87
6.5. Summary ... 89
Chapter 7. How to improve glycaemic control implementation in intensive care settings? Second pilot trial ... 91
XII 7.1. Introduction ... 91 7.2. Virtual trials ... 92 7.2.1. Patient cohort ... 92 7.2.2. STAR-Liege 2 protocol ... 92 7.2.3. Results ... 92 7.3. Clinical trials ... 93 7.3.1. Patients ... 94 7.3.2. Change in SL2 protocol ... 95 7.3.3. GC performance ... 95 7.3.4. Nurse compliance ... 99 7.3.5. Discussion ... 99 7.4. Summary ... 102
Chapter 8. Why do nursing staff not follow glycaemic control protocol recommendations? 103 8.1. Patient cohort: medical ICU cohort ... 103
8.2. Clinical protocol ... 104
8.3. Compliance analysis ... 106
8.3.1. Specific rule 1: patient variability ... 106
8.3.2. Specific rule 2: stop in nutrition ... 108
8.3.3. General rules ... 108
8.4. Summary ... 114
Chapter 9. How to ensure good nursing compliance, and safe and effective glycaemic control? Third pilot trial ... 115
9.1. Virtual trials ... 116
9.1.1. Patient cohorts ... 116
9.1.2. STAR protocol framework ... 116
9.1.3. STAR-Liege 3 protocol ... 118
9.1.4. Results ... 119
9.2. Clinical trials ... 122
9.3. Summary ... 123
Chapter 10. Extreme case glycaemic control: Hyper-Insulinemia Euglycaemia Therapy ... 125
XIII
10.1.1. Consequences of cardiogenic shock ... 125
10.1.2. Insulin beneficial effects ... 126
10.2. HIET clinical protocol ... 128
10.3. Implementation of GC with HIET ... 129
10.4. HIET patient cohort ... 130
10.5. Assessment of model for HIET patients ... 131
10.5.1. Method ... 131
10.5.2. Results ... 131
10.5.3. Discussion... 133
10.6. Summary ... 135
Chapter 11. Conclusion and future work ... 137
Appendix 1. Questionnaire ... 143 Part 1 ... 143 Part 2 ... 143 Part 3 ... 143 Part 4 ... 144 Part 5 ... 144 References ... 147 Executive summary ... 2
XV
List of figures
Figure 2-1: Simplified representation of glucose metabolism. ... 5
Figure 2-2: Glycolysis and pyruvic acid uses. ... 5
Figure 2-3: Insulin-mediated glucose uptake mechanism. ... 9
Figure 2-4: Self-sustainment of stress-induced hyperglycaemia during critical illness. ... 11
Figure 2-5: Self-sustainment of stress-induced hyperglycaemia due to reduced insulin sensitivity. ... 11
Figure 2-6: Multi-compartment model of insulin and glucose kinetics and dynamics. ... 17
Figure 2-7: Schematic illustration of the stochastic model of the insulin sensitivity variability. ... 22
Figure 2-8: STAR GC system approach. ... 23
Figure 2-9: Virtual trial process. ... 25
Figure 2-10: Process of insulin sensitivity identification. ... 26
Figure 2-11: Simulation process. ... 27
Figure 2-12: Clinical trial process. ... 29
Figure 3-1: Per-country repartition of survey respondents. ... 34
Figure 3-2: Selection criterion for GC systems. ... 37
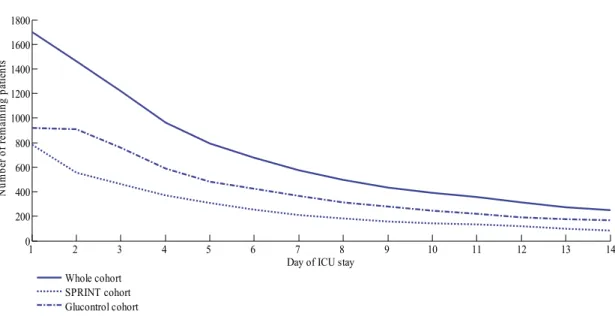
Figure 4-1: Number of remaining patients over days of ICU stay. ... 46
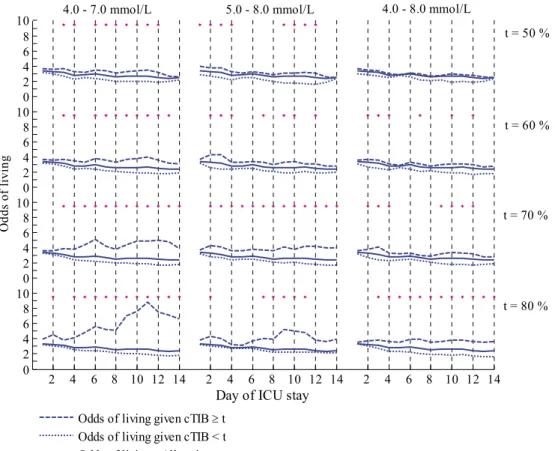
Figure 4-2: OL for each glycaemic band and threshold value during ICU stay. ... 49
Figure 4-3: OR for each glycaemic band and threshold value during ICU stay. ... 50
Figure 4-4: Patient process selection details... 54
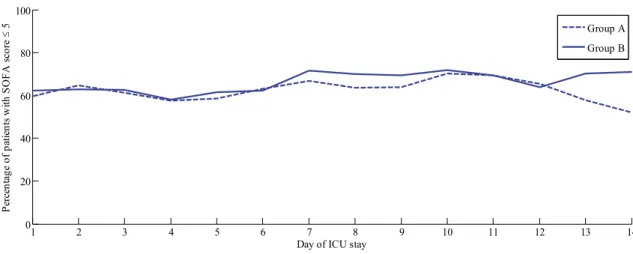
Figure 4-5: Proportion of patients with SOFA score ≤ 5 over time in Groups A and B. ... 57
Figure 4-6: Left: Conditional probability of SOFA score and cTIB; Right: Probability of cTIB ≥ 50 % for each patient group... 58
Figure 4-7: Joint probabilities of SOFA score and cTIB. ... 58
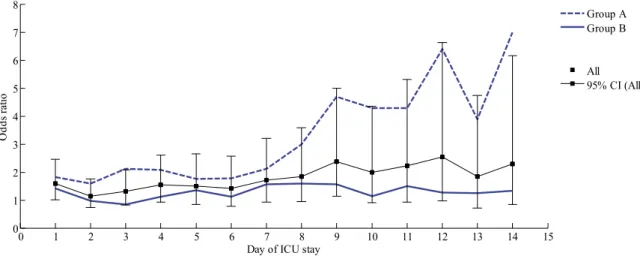
Figure 4-8: OR over the first 14 days of ICU stay for cTIB ≥ 50 %. ... 59
XVI
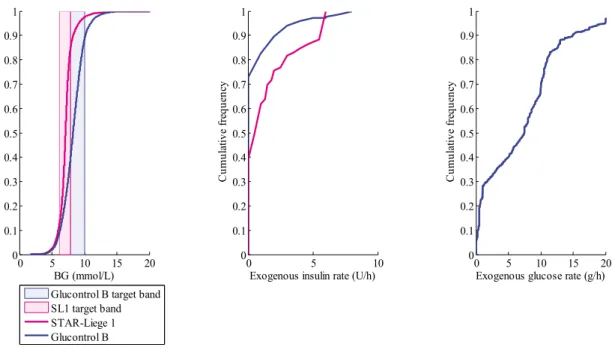
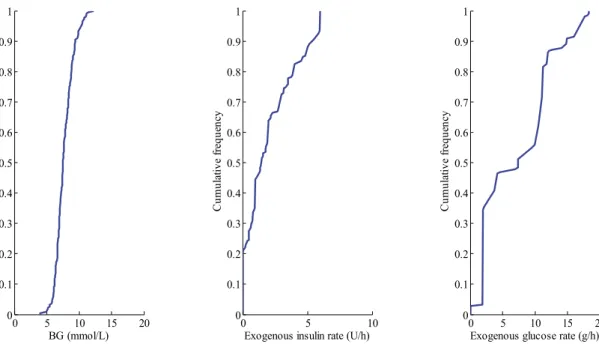
Figure 5-2: CDFs of BG levels (left panel), exogenous insulin rate (middle panel) and exogenous glucose rate (right panel), defined for the whole cohort, for the SL1 virtual trial. ... 70 Figure 5-3: Median (dashed line), 25-75 % (dark blue area) and 5-95 % (light blue area) intervals for per-patient BG CDFs defined on whole cohort, where the pink area is the target band. ... 72 Figure 5-4: CDFs of BG levels (left panel), exogenous insulin rate (middle panel) and exogenous glucose rate (right panel), defined for the whole cohort, for the SL1 clinical trial. ... 72 Figure 5-5: STAR trial progression for Patient 3 in terms of BG levels (top) and model-based insulin sensitivity (bottom). ... 77 Figure 5-6: STAR trial progression for Patient 6 in terms of insulin rates with a constant nutritional administration rate. ... 78 Figure 6-1: STAR protocol framework for its second implementation at CHU of Liege. ... 89 Figure 7-1: CDFs of BG levels (left panel), exogenous insulin rate (middle panel) and exogenous glucose rate (right panel), defined for the whole cohort, for the SL2 virtual trial. ... 94 Figure 7-2: CDFs for BG levels (left panel), exogenous insulin rates (middle panel) and exogenous glucose rate (right panel), defined for the whole cohort, for the SL2 clinical trial. ... 97 Figure 7-3: CDF for BG levels for the 24-hour pre-trial, during trial and post-trial for SL2 clinical trial. ... 98 Figure 8-1: Quantification of deviations in insulin rate. ... 109 Figure 9-1: CDFs for BG levels (left panel), exogenous insulin rates (middle panel) and exogenous glucose rate (right panel), defined for the whole cohort, for the SL3 virtual trial. ... 121 Figure 10-1: Effects of insulin. ... 126 Figure 10-2: Evolution of plasma insulin concentration during HIET, simulated and measured assays. ... 132 Figure 10-3: Evolution of plasma insulin concentration during HIET – Comparison with simulated and measured values, and steady state values. ... 134
XVII
List of tables
Table 2-1: Effects of counter-regulatory hormones and cytokines on the genesis of stress-induced
hyperglycaemia and the decrease in insulin sensitivity. ... 10
Table 2-2: Parameter values for Model 1. ... 17
Table 2-3: Parameter values for Model 2 and Model 3. ... 19
Table 3-1: Characteristics of responding ICUs and respondents... 34
Table 3-2: Characteristics of current GC practice. ... 35
Table 3-3: Characteristics of current and desired protocol adjustment during GC. ... 36
Table 3-4: Characteristics of current and desired protocols for GC. ... 36
Table 3-5: Analysis of processes related to GC implementation in ICUs. ... 37
Table 4-1: SPRINT and Glucontrol cohort characteristics. ... 46
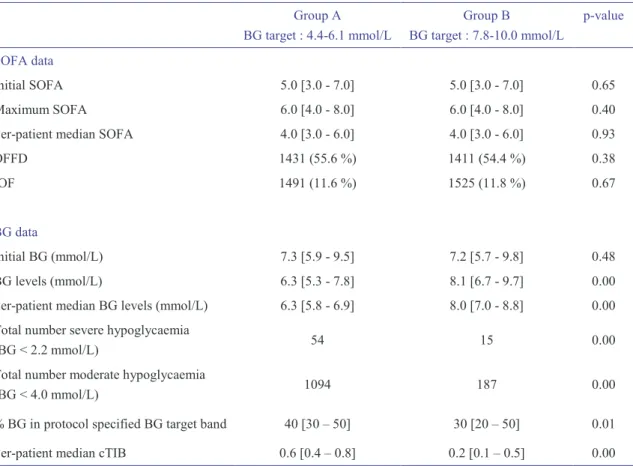
Table 4-2: Joint probabilities to link severity of organ failure and glycaemic outcome. ... 54
Table 4-3: Characteristics of the 704 remaining patients. ... 55
Table 4-4: Characterisation of SOFA and BG data for all included patients. ... 56
Table 4-5: Number of patients over ICU stay in Group A and Group B, and assessment of Fisher Exact test comparison of proportions with SOFA ≤ 5. ... 57
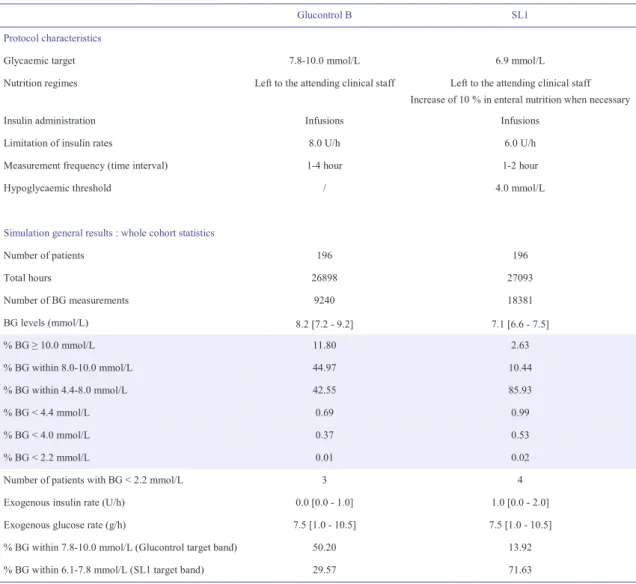
Table 5-1: Glucontrol virtual cohort characteristics. ... 65
Table 5-2: Virtual trials results for the first implementation of STAR in a Belgian ICU. ... 69
Table 5-3: Clinical details of included patients for the first implementation of STAR in Liege. .. 71
Table 5-4: Clinical trial results for the first implementation of STAR in Liege (whole cohort statistics). ... 73
Table 5-5: Clinical trial results for the first implementation of STAR in Liege (per-patient statistics). ... 74
Table 5-6: Prediction performance. ... 75
Table 6-1: New stochastic model definitions. ... 83
XVIII
Table 6-3: Re-simulated clinical trial results for the improvement of the stochastic model (whole
cohort statistics). ... 85
Table 6-4: p-values to compare distribution of BG levels, insulin and nutrition rates between clinical trial results and re-simulated clinical trial results using new SM 5. ... 86
Table 7-1: Virtual trial results for the second implementation of STAR in Liege. ... 93
Table 7-2: Clinical details of included patients for the second implementation of STAR in Liege. ... 95
Table 7-3: Clinical trial results for the second implementation of STAR in Liege. ... 96
Table 7-4: Clinical trial results for the second implementation of STAR in Liege (per-patient statistics). ... 97
Table 7-5: Details where nurses overrode STAR recommendations during the second implementation of STAR in Liege. ... 100
Table 8-1: Medical ICU cohort characteristics. ... 104
Table 8-2: Clinical protocol used in the medical ICU at the University Hospital of Liege. ... 105
Table 8-3: Compliance to the specific GC protocol rule related to patient variability management. ... 107
Table 8-4: Compliance to the specific GC protocol rule related to the management of stop in nutrition. ... 108
Table 8-5: Compliance to GC protocol general rules, for BG < 150 mg/dL. ... 110
Table 8-6: Compliance to GC protocol general rules, for BG ≥ 150 mg/dL. ... 111
Table 9-1: Virtual trial results for the third implementation of STAR in Liege. ... 120
Table 9-2: Whole cohort statistics for the third implementation of STAR in Liege, on the Glucontrol cohort. ... 122
XIX
List of abbreviations
AACE American association of clinical endocrinologists
ADA American diabetes association
APACHE Acute physiology and chronic health evaluation
ATP Adenosine triphosphate
BG Blood glucose
CCB Calcium channel blocker
CDF Cumulative density function
CHU Centre hospitalier universitaire
cTIB Cumulative time in band
CVS Cardiovascular surgery
FFA Free fatty acids
GC Glycaemic control
ICU Intensive care unit
IIT Intensive insulin therapy
IL-1 Interleukin-1
IOF Individual organ (component) failures
IQR Interquartile range
OFFD Organ failure free days
OL Odds of living
OR Odds ratio
SAPS Simplified acute physiology score
SL1 STAR-Liege 1
SL2 STAR-Liege 2
SL3 STAR-Liege 3
SOFA Sequential organ failure assessment
STAR Stochastic targeted
1
Chapter 1. Introduction
Critically ill patients often present stress-induced hyperglycaemia and low insulin sensitivity, both associated with worsened patient outcome. Glycaemic control (GC) aims to reduce and stabilise blood glucose (BG) levels taking into account inter-patient variability, evolving physiological patient condition (intra-patient variability) and minimising hypoglycaemic risk. GC has been shown to improve patient outcome. But, in clinical practice, evolving patient condition, fear of hypoglycaemia and increased nursing staff workload impede safe, effective GC implementation. Safe and effective clinical protocols are thus required to provide beneficial GC.
Model-based protocols allow customised and patient-specific GC approach, and have been shown to be able to provide tight GC for critically ill patients. Such protocols tend to provide a safe and effective way to manage inter- and intra- patient variability. They can thus provide safe, effective control to improve patient outcome and quality of care, while reducing cost. Developing safe and effective model-based protocols that fit within practical clinical workflow is thus today’s great challenge.
The successful development and adoption of GC system in intensive care unit (ICU) settings can only be achieved if care is taken with regard to certain features. In particular, a GC system should: 1) meet ICU clinician expectations; 2) stabilise glycaemia in a glycaemic band associated with improved patient outcome; and 3) provide a demonstrated safe and effective way to control patient glycaemia.
The main objective of this thesis is thus to provide answers to three key questions associated with the successful development and adoption of a GC approach:
What do ICU clinicians want in GC? What is the best glycaemic target to achieve during GC? How to achieve safe and effective GC?
2
Chapter 2 provides an overview of the glucose-insulin system, describes the particular situation of critically ill patients and explains how GC can improve patient outcome. It also describes a validated model of the glucose-insulin system and presents the model-based GC STAR approach used in this thesis. This chapter also explains the virtual trial approach and the process of clinical trials. Chapter 3 identifies ICU clinicians expectations related to GC in ICU settings. This chapter provides key factors to help GC adoption by ICU staff and to ensure successful GC implementation. Chapter 4 concerns the definition of an optimal glycaemic level to achieve during GC to improve patient outcome. It also provides the definition of a metric to assess GC performance in real-time. Chapter 5 to Chapter 9 present GC protocols whose in silico and in vivo implementation should help to determine how an effective GC control should be performed and demonstrate the efficiency, safety and performance of the STAR GC approach.
Chapter 10 presents a specific application of GC to manage intravenous insulin and glucose infusion during hyper-insulinemia euglycaemia therapy (HIET).
3
Chapter 2. Background
This chapter first provides a physiological overview of the glucose-insulin regulatory system. Second, it describes the particular situation of critically ill patients and explains how GC can improve patient outcome. Its third focus is the mathematical modelling of the regulatory system of glucose and insulin. In this research, three different clinically validated models have been used and they are detailed in this chapter. The main parameter of all these models is insulin sensitivity. This parameter varies significantly over time and is patient-specific. Its role and the method used to account for this inter- and intra- patient variability are explained. The combination of a model of the glucose-insulin regulatory system and a stochastic model of insulin sensitivity variability leads to a new adaptive, safe and patient-specific GC system named STAR (Stochastic TARgeted). This chapter also presents the overall model-based GC STAR approach used in this thesis. Finally, virtual and clinical trial processes using this model-based approach are described.
2.1. Physiology of the glucose-insulin system
Glucose is an important source of energy for vital organs and is the primary fuel source used throughout the body. In particular, the central nervous system only uses glucose as fuel. Glycaemia is the concentration of glucose in the blood, i.e. the BG level, and is a physiological variable resulting from the balance between exogenous input, endogenous production, and the use of glucose for energy. To ensure relatively constant energy supply for the central nervous system, BG levels are tightly regulated. The regulatory system is mainly based on the opposing action of two pancreatic hormones released from cells in the islets of Langerhans in the pancreas: insulin, secreted by beta cells and glucagon, secreted by alpha cells (Guyton and Hall, 2000; Tortora and Grabowski, 1994). Insulin and glucagon trigger metabolic processes to maintain normoglycaemia (normal BG levels). More precisely, BG levels are reduced by insulin action and increased by glucagon action
4
(Guyton and Hall, 2000). Other hormones, such as glucocorticoids, epinephrine and growth hormone, also influence glycaemia (Tortora and Grabowski, 1994).
In healthy patients, normal fasting BG levels are between 4.4 mmol/L and 6.1 mmol/L (Tortora and Grabowski, 1994). High BG levels are termed as moderate (6.1-10.0 mmol/L) and severe (above 10.0 mmol/L) hyperglycaemia. In contrast, hypoglycaemia refers to low BG levels. Moderate hypoglycaemia occurs when BG < 3.3 mmol/L and severe hypoglycaemia when BG < 2.2 mmol/L. However, for critically ill patients, these definitions for normoglycaemia and hyperglycaemia are still under debate (Mackenzie et al., 2005; Marik and Raghavan, 2004; Moghissi et al., 2009; Wiener et al., 2008). An expert consensus (Moghissi et al., 2009) states that GC has to be started when BG > 10.0 mmol/L. Marik and Raghavan (2004) suggest the initiation of an insulin infusion in patients with a BG above 8.3 mmol/L.
2.1.1. Metabolic processes
The glycaemic regulatory system includes several metabolic processes that occur mainly in four organs: the liver, the muscles, the adipose tissues and the kidneys (Figure 2-1). Glucose metabolic processes can be categorised into glucose catabolic and anabolic processes.
Glucose catabolism refers to glucose degradation, and more widely to glucose use and storage. Glucose catabolism is based on three main processes that are promoted by insulin action: glycolysis, glycogenesis and lipogenesis.
1. Glycolysis is the transformation of glucose into adenosine triphosphate (ATP) and pyruvic acid (Figure 2-2). This process occurs in all body cells and is the first step of cellular respiration, which produces ATP to supply energy to cells. Without oxygen, pyruvic acid is transformed into lactic acid that can stay in cells or can be transported to the liver via the bloodstream, where it is retransformed into pyruvic acid. When oxygen is present in the cell, pyruvic acid is used to produce large amounts of ATP, which corresponds to the second step of cellular respiration.
2. Glycogenesis refers to the transformation of glucose into glycogen. This transformation enables glucose storage as glycogen in hepatic (25 %) and muscular (75 %) cells.
3. Lipogenesis is the transformation of excess glucose into fats or lipids. When glycogen storage sites are full, hepatic and adipose cells convert glucose into fatty acids. Fats can be used with glycerol in the synthesis of triglycerides, which are then stored in adipose tissues.
5
Figure 2-1: Simplified representation of glucose metabolism.
Main processes shown are: (1) glycolysis; (2) glycogenesis; (3) lipogenesis; (4) glycogenolysis; (5) gluconeogenesis. Dashed arrows refer to inter-organ transport of substrates via bloodstream.
Figure 2-2: Glycolysis and pyruvic acid uses.
Blood glucose
Glucose Pyruvic acid Lactic acid
(1) (5) Amino acids Glycerol (5) (5) (1)
Glucose Pyruvic acid Lactic acid
Glycerol
Fat Triglycerides
(3)
Glucose Pyruvic acid Lactic acid
Glycogen (2) (4)
(1)
Amino acids Bloodstream Adipose tissues
Kidneys
Muscles
Liver
Glucose Pyruvic acid Lactic acid
Glycogen (2) (4) Fat (3) (1) (5) Glycerol Amino acids (5) (5)
Glucose 2 pyruvic acids
With oxygen
Without oxygen
ATP (Krebs cycle) Lactic acid 2 NAD+ 2 NADH,H+
6
Glucose anabolism refers to endogenous glucose production via glycogenolysis or/and gluconeogenesis using other substrates. These processes are mainly promoted by glucagon, but also by counter-regulatory hormones and inflammatory mediators that also have anti-insulin effects.
4. Glycogenolysis refers to glucose synthesis from glycogen. This process uses glycogen stored in the liver and muscles to supply energy. In the liver, the glucose produced is released into the bloodstream and can be used by cells for glycolysis. In the muscle cells, as the enzyme releasing glucose into the bloodstream is not in muscle cells, the glucose produced is used directly by these cells in glycolysis and is transformed into pyruvic acid. The pyruvic acid then either stays in the muscle cells and goes through the second cellular respiration step, or it goes to the liver where it is converted into glucose during gluconeogenesis. Muscular glycogen is thus an indirect source of BG.
5. During gluconeogenesis, BG can be produced from four different substrates: pyruvic acid, lactic acid (converted into pyruvic acid), glycerol from lipolysis in adipose tissues, and amino acids from proteolysis in muscles. Lipolysis and proteolysis are also promoted by counter-regulatory hormones, increasing substrate supply for the gluconeogenesis. This process occurs in the kidneys and liver, especially when stored glycogen resources are exhausted.
These five processes promote BG balance, or homeostasis, as well as glucose use for energy. Glucose anabolism, in particular, can lead to reduced muscle mass if glycogen stores are exhausted or low. This derangement can occur frequently in critical illness due to the counter-regulatory action of the stress response in these patients.
2.1.2. Hyperglycaemia - Insulin action
A rise in BG levels is detected by pancreatic beta cells that release insulin. This hormone acts in the liver, adipose tissues and muscles, causing glucose to be transported from bloodstream into cells, where insulin then stimulates glycolysis, glycogenesis and lipogenesis. Insulin action results in increased glucose use and storage as glycogen or fats. Moreover, insulin inhibits glycogenolysis in the liver and muscles, and hepatic gluconeogenesis, which thus suppresses endogenous glucose production. Overall, insulin reduces BG levels. However, this action is modulated by insulin sensitivity. Insulin sensitivity quantifies the whole body response to insulin. The lower the insulin sensitivity, the lower the impact of insulin on glycaemia, all else equal. In the literature, the term “insulin resistance” is often used, which implies that insulin action is reduced with increased insulin resistance, equivalent to the reciprocal reduced insulin sensitivity.
7
2.1.3. Hypoglycaemia - Glucagon (and epinephrine) action
Hypoglycaemia is detected by pancreatic alpha cells that release glucagon, which has an anti-insulin effect. Glucagon stimulates glycogenolysis in liver and muscles and hepatic gluconeogenesis freeing glucose to raise BG levels, as the liver is the only organ able to release glucose into the bloodstream. Glycogenolysis and gluconeogenesis allows glucose production from stored glycogen and from pyruvic acid, lactic acid, amino acids and glycerol, respectively. This muscular and hepatic cellular glucose production reduces the need for BG to produce energy and thus limits the decrease of BG levels. Moreover, liver cells can also release endogenously produced glucose into bloodstream, increasing BG levels, while muscular cells cannot. But, muscular glycogenolysis products (pyruvic and lactic acids) and proteolysis products (amino acids) can be transported to the liver to be used in gluconeogenesis. Thus, glycogen from muscle cells is an indirect source of BG. When BG levels are low, epinephrine is also secreted. This hormone further promotes glycogenolysis and gluconeogenesis, and thus raises BG levels. However, the action of epinephrine can be neglected in comparison with glucagon action, as it is much less significant.
2.2. Stress-induced hyperglycaemia and insulin sensitivity in
critically ill patients
Critically ill patients often present stress-induced hyperglycaemia and low insulin sensitivity (Chase et al., 2011b; Langouche et al., 2007; Lin et al., 2008; McCowen et al., 2001; Pretty et al., 2012). Recent studies have shown that high BG levels and variability are each associated with an increased risk of infectious complications, worsened patient outcomes and increased mortality (Bagshaw et al., 2009; Egi et al., 2006; Krinsley, 2003; McCowen et al., 2001).
Stress-induced hyperglycaemia can be seen as a manifestation of stress response and be defined as a transient hyperglycaemia resolving spontaneously after dissipation of acute illness (Dungan et al., 2009; McCowen et al., 2001). The stress-induced hyperglycaemia is a result of reduced insulin sensitivity and increased glucose appearance. Insulin sensitivity refers to the cell's insulin response that characterises the cell’s ability for insulin-mediated glucose uptake. Reduced insulin sensitivity is frequent in critically ill patients (Pretty et al., 2012) and is defined by impaired insulin-mediated glucose uptake into insulin-sensitive tissues (tissues that require insulin to take up glucose, i.e. liver, muscle and adipose tissues) (McCowen et al., 2001). Three main factors influence the development and extent of the decrease in insulin sensitivity and the resulting hyperglycaemia in critically ill patients: the stress associated with critical illness, the treatment and the nutrition (Dungan et al., 2009; Pretty et al., 2011).
8
2.2.1. Critical illness
Critical illness is characterised by stress and inflammatory responses that both induce rise in BG levels, due to decreased insulin sensitivity and increased glucose appearance. Stress can be caused by severe infection, trauma or surgery (Tortora and Grabowski, 1994).
Stress response
The stress response comprises two major phenomena: the excessive release of counter-regulatory hormones and the overproduction of cytokines (Esposito et al., 2003; McCowen et al., 2001). Counter-regulatory hormones, such as glucagon, glucocorticoids (mainly cortisol), catecholamines (epinephrine and norepinephrine) and growth hormone have anti-insulin effects, promote glycogenolysis, lipolysis and proteolysis, and thus increase gluconeogenesis by increasing gluconeogenic substrate production (Weber-Carstsens, 2010). This dynamic state leads to a rise in endogenous glucose production when it would normally be suppressed.
Additionally, in insulin-sensitive tissues, counter-regulatory hormones impair the insulin-mediated glucose uptake mechanisms described in Figure 2-3. More precisely, glucocorticoids inhibits the translocation of the GLUT-4 transporter (Marik and Raghavan, 2004). Epinephrine inhibits insulin secretion, insulin binding to its receptor, tyrosine kinase activity and translocation of the GLUT-4 transporter (Marik and Raghavan, 2004). Epinephrine also increases the levels of free fatty acids (FFA), notably by promoting lipolysis, that inhibit the insulin signalling pathway (McCowen et al., 2001). Finally, growth hormone inhibits the insulin signalling pathway by reducing the abundance of insulin receptors and impairing their activation through phosphorylation (McCowen et al., 2001). The impairment of insulin signalling pathway leads to reduced insulin sensitivity, particularly in peripheral tissues.
Stress also leads to the overproduction of cytokines, such as tumour necrosis factor-α (TNF-α) and interleukin-1 (IL-1) (Marik and Raghavan, 2004; McCowen et al., 2001). TNF-α stimulates glucagon production, promotes gluconeogenesis and reduces activation of insulin receptors (Dungan et al., 2009; Marik and Raghavan, 2004) and thus enhances the negative and hyperglycaemic impacts of the stress response. In particular, IL-1 and TNF-α inhibit post-receptor insulin signalling pathway (Dungan et al., 2009) and insulin release, an effect that appears to be concentration, and thus level-of-stress-response, dependent (Marik and Raghavan, 2004).
Thus, during critical illness, counter-regulatory hormone release and cytokine overproduction result in increased endogenous glucose production and impairment of the insulin signalling pathway, reducing glucose uptake in insulin-sensitive tissues (Table 2-1). This behaviour leads to a rise in
9
BG levels (hyperglycaemia). However, an early increase in whole-body non-insulin-mediated glucose uptake can also occur due to cytokine-mediated upregulation, defined as increased synthesis, concentration or activity, of another glucose transporter, GLUT-1 (Dungan et al., 2009; Marik and Raghavan, 2004). Therefore, much of the clearance of glucose during critical illness is by tissues that do not depend on insulin (McCowen et al., 2001), but which also cannot match the glucose produced or that given as nutritional support.
Insulin binds to its cell-surface receptor that becomes phosphorylated (P) and induces the activation of an intrinsic tyrosine kinase. This leads to phosphorylation of a cascade of insulin receptor substrates and this signalling pathway leads to the translocation of intracellular vesicles containing the GLUT-4 glucose transporter to the plasma membrane. In short, insulin stimulates its signalling pathway which leads to glucose uptake into the cell where it is metabolised (Marik and Raghavan, 2004; McCowen et al., 2001).
Figure 2-3: Insulin-mediated glucose uptake mechanism.
Inflammatory response
Hyperglycaemia has a pro-inflammatory effect that is normally restrained by the anti-inflammatory effect of insulin secreted in response to that stimulus (Esposito et al., 2003). During critical illness, stress-induced hyperglycaemia and reduced insulin sensitivity result in increased pro-inflammatory mediators. The inflammatory response induces reduced immune-system ability, which in turn further promotes stress, and results eventually in multisystem organ dysfunction, organ failure and ultimately death (Marik and Raghavan, 2004). There is thus an unstable feedback loop comprising stress, inflammation, and hyperglycaemia that can result in a spiralling cascade of negative effects.
Plasma membrane P P Insulin receptor Tyrosine kinase P GLUT-4 vesicle Translocation GLUT-4 Insulin receptor substrates
10
Table 2-1: Effects of counter-regulatory hormones and cytokines on the genesis of stress-induced hyperglycaemia and the decrease in insulin sensitivity.
Counter-regulatory
hormones and cytokines Effects on the genesis of stress-induced hyperglycaemia and the decrease in insulin sensitivity
Glucagon Increased glycogenolysis and gluconeogenesis
Glucocorticoids Increased lipolysis and thus gluconeogenesis via substrate supply Inhibition of GLUT-4 transporter translocation
Epinephrine Increased glycogenolysis and gluconeogenesis
Inhibition of insulin secretion, insulin-receptor binding, tyrosine kinase activity and GLUT-4 transporter translocation
Increased FFA levels, and thus inhibition of insulin signalling pathway
Norepinephrine Increased glycogenolysis, gluconeogenesis and lipolysis (and thus glycerol supply for gluconeogenesis)
Growth hormones Increased lipolysis and thus gluconeogenesis via substrate supply Inhibition of insulin signalling pathway
Reduction of insulin receptor abundance and activation
TNF-α Increased glucagon production and gluconeogenesis
Inhibition of post-receptor insulin signalling pathway and insulin release
IL-1 Inhibition of post-receptor insulin signalling pathway and insulin release
Self-sustainment of stress-induced hyperglycaemia
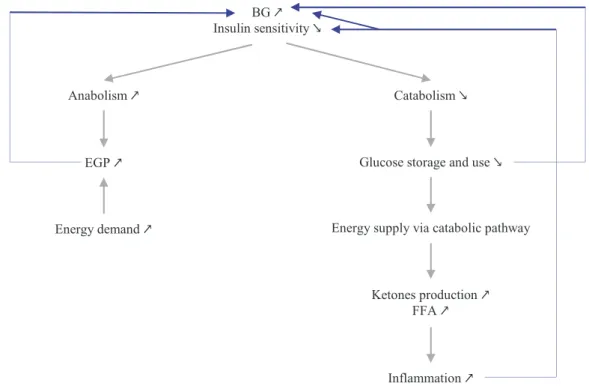
The major problem about stress-induced hyperglycaemia is its self-sustainment, where hyperglycaemia leads to further hyperglycaemia (Dungan et al., 2009). First, high BG levels induce increased cytokine release (Esposito et al., 2003). Then, stress is increased by hyperglycaemia. Next, high BG levels increase proteolysis (McCowen et al., 2001), and thus increase gluconeogenic substrates. Additionally, inflammation is sustained by the pro-inflammatory action of hyperglycaemia that is increased by inflammation. Moreover, FFA levels that are increased with stress response exacerbate inflammation (Esposito et al., 2003). Figure 2-4 summarises all the positive feedback pathways.
In addition, the fact that hyperglycaemia is associated with reduced insulin sensitivity also induces a self-sustaining dynamic within stress-induced hyperglycaemia (Figure 2-5). More precisely, reduction of insulin action has two main effects: glucose production (anabolism) is increased while glucose use and storage (catabolism) are decreased. As insulin fails to suppress glycogenolysis and gluconeogenesis (Dungan et al., 2009; McCowen et al., 2001) and as energetic demand raises, endogenous glucose production is increased, leading to increased BG levels. Then, as insulin-mediated uptake is impaired, glucose storage and use are reduced, leading to reduced glucose catabolic pathway. Hence, energy has to be produced by catabolic pathway from fats during β-oxidation. However, this process leads to production of ketones and FFA, which are toxic when in excess, and can lead to increased inflammation.
11
Figure 2-4: Self-sustainment of stress-induced hyperglycaemia during critical illness. Blue arrows show all the positive feedback loops involved in the self-sustainment.
Figure 2-5: Self-sustainment of stress-induced hyperglycaemia due to reduced insulin sensitivity. Blue arrows show all the positive feedback loops involved in the self-sustainment.
Critical illness
Stress response Inflammatory response
Counter-regulatory hormone release ↗ Cytokine production ↗
EGP ↗ FFA ↗
Insulin-mediated glucose uptake ↘
BG ↗ Insulin sensitivity ↘
Stress-induced hyperglycaemia
Immune-system ability ↘
Organ dysfunction and failure ↗
BG ↗ Insulin sensitivity ↘
Anabolism ↗ Catabolism ↘
EGP ↗
Energy demand ↗
Glucose storage and use ↘
Ketones production ↗ FFA ↗
Energy supply via catabolic pathway
12
Despite hyperinsulinemia, or high insulin levels in response to high BG levels, reduced insulin sensitivity leads to ongoing, or unsuppressed glucose production in the face of hyperglycaemia. This hyperglycaemia is mainly caused by increased and unsuppressed hepatic glucose production, more than impaired tissue glucose extraction (McCowen et al., 2001).
2.2.2. Treatment
Stress-induced hyperglycaemia can be exacerbated by therapeutic interventions (Dungan et al., 2009; McCowen et al., 2001). Many drugs administrated to critically ill patients have to be diluted in glucose solutions (Paw and Park, 2006). Drug delivery is thus associated with exogenous glucose input for critically ill patients, and can lead to increased BG levels. Moreover, therapeutic interventions may often also include glucocorticoid therapy or catecholamine infusions. As shown in Table 2-1, glucocorticoids and catecholamines (epinephrine, norepinephrine) are both associated with increased endogenous glucose production and reduced insulin sensitivity. However, the 10-20 % variation in insulin sensitivity resulting from glucocorticoid administration has been shown to produce no significant BG level variation (Pretty et al., 2011), largely because insulin sensitivity levels are already relatively very low.
2.2.3. Nutrition
During their ICU stay, critically ill patients often receive parenteral (intravenous) or enteral (oral via feeding tube) nutrition. Nutrition is an exogenous glucose supply and directly impacts BG levels. Changes or interruptions in nutrition are frequent in intensive care and result in further changes in BG levels, and thus impact on observed glycaemic variability. Rises in nutrition directly lead to higher BG levels. Hence, excessive exogenous glucose administration (overfeeding) worsens hyperglycaemia and outcomes (Krishnan et al., 2003). Moreover, overfeeding can also increase infectious complications that are associated with increased inflammation (Dungan et al., 2009; McCowen et al., 2001). As shown in Figure 2-4 and Figure 2-5, increased inflammation enhances self-sustainment of stress-induced hyperglycaemia. Hence, nutrition is an exogenous and iatrogenic source of hyperglycaemia and glycaemic variability.
2.3. Glycaemic control in intensive care units
Hyperglycaemia has deleterious effect on immune system function (McCowen et al., 2001; Weekers et al., 2003) and can be considered as a risk factor for developing complications, such as
13
infection and organ failure, two main causes of death in ICUs. Moreover, high BG levels have been associated with a worse prognosis for patients suffering stroke (McCowen et al., 2001). Critically ill patients without known diabetes and with hyperglycaemia face worse outcome and higher mortality than patients with pre-existing diabetes (Dungan et al., 2009). In addition, high variability in BG levels is associated with mortality in critically ill patients, independently of mean BG levels (Dungan et al., 2009; Egi et al., 2006).
Treatment of hyperglycaemia during critical illness is thus fundamental to improve survival. Exogenous insulin delivered as infusion or bolus seems to be the typical choice to reduce BG levels (Esposito et al., 2003; McCowen et al., 2001). Indeed, as endogenous glucose production is increased and insulin sensitivity is reduced, increased endogenous pancreatic insulin release is not sufficient to reduce BG levels and so supplementary exogenous insulin is necessary. As insulin has anti-inflammatory effects, normalisation of glycaemia and inflammation will reduce or eliminate the self-sustaining actions of hyperglycaemia and stress (Dungan et al., 2009). GC aims to reduce and stabilise BG levels taking into account inter-patient variability, evolving physiological patient conditions (intra-patient variability) and minimising hypoglycaemia (Suhaimi et al., 2010). GC is also associated with reduced surgical wound infection for post cardiac-surgery patients (Saad et al., 2008), kidney protection (Vanhorebeek et al., 2008) and reduced need for prolonged mechanical ventilation (Berends et al., 2008).
For some cohorts of critically ill patients, GC has been shown to improve patient outcomes and reduce infectious complications (Chase et al., 2008b; Krinsley, 2004; Marik and Raghavan, 2004; McCowen et al., 2001; Van den Berghe et al., 2001). But, other studies failed to reproduce this beneficial impact of GC (Brunkhorst et al., 2008; Finfer et al., 2009; Preiser et al., 2009). These discouraging results can be partly explained by higher patient-type heterogeneity and lower GC quality compared with the first studies (Chase et al., 2008b; Krinsley, 2004; Van den Berghe et al., 2001). The remaining issue is that most protocols fail to account for inter- and intra- patient variability (Chase et al., 2011b).
In addition to medical benefits of GC, GC implementation improves critical care quality and reduces associated cost (Krinsley and Jones, 2006; Van den Berghe et al., 2006b). Moerer et al. (2007) have shown an association between total per-patient cost in ICU, and the severity of illness and the length of stay. GC is associated with reduced patient length of stay in ICU (Van den Berghe et al., 2001), and thus also with reduced total per-patient cost (Krinsley and Jones, 2006; Van den Berghe et al., 2006b). All these findings support the medical and financial interest in GC.
GC is associated with clinical protocols that specify insulin and/or nutrition rates to administer to critically ill patients and BG measurement frequency during control (Chase et al., 2007; Chase et al., 2006). This last point is important for correct clinical implementation of GC. Clinical protocols
14
ensure GC based on accurate and safe decisions. Dungan et al. (2009)suggested that GC has to be individualised for different hospital patient populations whereas Chase et al. (2011b) noted it should be per-patient, or patient-specific. Moreover, as clinical practice about treatment and nutrition is ICU-dependent, clinical protocols should also be hospital-specific to fit in clinical workflow. In clinical practice, several factors impede effective and safe GC implementation. The three main factors are evolving critically ill patient condition, fear of hypoglycaemia and increased nursing staff workload (Carayon and Gurses, 2005; Chase et al., 2008a; Chase et al., 2011b; Mackenzie et al., 2005). Evolving patient condition implies metabolic changes leading to insulin sensitivity variability, and thus requiring continuous insulin/nutrition rate adjustment during control (Chase et al., 2011b; Pretty et al., 2012). Hypoglycaemia is the main risk associated with GC. As hypoglycaemia in critically ill patients is associated with increased mortality (Bagshaw et al., 2009; Egi et al., 2010; Krinsley and Keegan, 2010), GC implementation in ICU is associated with nurse anxiety about hypoglycaemic risk (Mitchell et al., 2006). Moreover, GC implementation requires more frequent BG measurements to account for inter- and intra- patient variability, which can lead to increased nursing staff workload, resulting in nursing staff reluctance to GC implementation (Carayon and Gurses, 2005; Chase et al., 2008a; Mackenzie et al., 2005; Van Herpe, 2008). Consequently, GC implementation requires safe, effective clinical protocols. These protocols should also be easy-to-use in real-time to facilitate nursing staff work.
2.4. Model-based glycaemic control protocols
GC is currently implemented in one form or another in many ICUs (Eslami et al., 2010). GC protocols can be divided into three categories: flowchart-based protocols, formula-based protocols or model-based protocols (Vogelzang et al., 2008).
Flowchart-based protocols use empirical rules to determine insulin dosing and measurement frequency, based on clinical practice. Flowchart-based protocols are widely used as there are easy-to-use and simple-to-understand. However, their efficiency is quite limited as rules do not depend on patient cohort, length of ICU stay, severity of illness, and patient nutrition input and medication (Lonergan et al., 2006b; Van Herpe, 2008). Most flowchart-based protocols are paper documents, but computerised versions are emerging.
Formula-based protocols use empirical formulae to calculate insulin dosing. Measurement frequency is often determined using flowchart-based rules. Employed formulae are often associated with a lack of rigor, precision and, as with flowchart-based protocols, formula-based protocols do not account for evolving patient condition. Protocols using complex formulae are often
15
computerised to ensure beneficial implementation and facilitate nursing staff work (Eslami et al., 2010). Formula-based protocols allow insulin dosing at any time, which also explains their wider use. Glucommander (Davidson et al., 2005; Davidson et al., 2008) and Glucostabilizer (Juneja et al., 2007; Juneja et al., 2009) are the most well-known formula-based GC protocols.
Model-based protocols are the most sophisticated control approach. Modelling of glucose-insulin system helps to accurately predict BG levels, and thus enables the determination of the best insulin/nutrition dosing to achieve a desired BG level for coming periods (Chase et al., 2007; Chase et al., 2006; Vogelzang et al., 2008). This approach allows customised and patient-specific GC, but requires protocols to be computerised. Studies have shown that model-based protocols are able to provide accurate GC for critically ill patients (Amrein et al., 2012; Evans et al., 2011; Fisk et al., 2012b; Pachler et al., 2008; Penning et al., 2012a; Penning et al., 2012b; Pielmeier et al., 2010a; Pielmeier et al., 2012; Van Herpe et al., 2013). However, only one (STAR) has both reduced hypoglycaemia and been implemented in regular clinical practice (Evans et al., 2011; Fisk et al., 2012b). STAR was based on an earlier computerised model-derived protocol (SPRINT) that was the only one to successfully reduce mortality and hypoglycaemia (Chase et al., 2008b).
2.5. Modelling of the glucose-insulin system
In this thesis, the goal is the application of glucose-insulin system models for safe and effective real-time GC at the bedside of critically ill patients. Such models must therefore account for the three main following features. First, models have to accurately describe insulin and glucose kinetics and dynamics. Second, they have to account for inter- and intra- patient variability. Third, model parameters have to be easily identifiable in real-time in an ICU setting, at patient bedside using readily available data.
Over the last few years, many models have been developed to capture patient response to glucose and insulin inputs for GC in ICU (Chase et al., 2011b; Chase et al., 2006; Hovorka et al., 2002; Pielmeier et al., 2010b; Van Herpe et al., 2006). In all these models, the main parameter that evolves with evolving patient condition and is patient-specific (Lin et al., 2006) is the insulin sensitivity. Safe and effective GC requires accurate real-time identification of insulin sensitivity at the patient bedside (Chase et al., 2011b). Other parameters are often defined from the literature and based on population values. It should be noted that models developed for GC are typically based on a simplified glucose regulatory system and cannot directly account for environmental factors that could impact on insulin sensitivity and glycaemia, such as stress (Uchida et al., 2012), exercise (Borghouts and Keizer, 2000), temperature (Berglund et al., 2012) or sleep (Bosy-Westphal et al., 2008; Donga et al., 2010). Hence, models related to GC make a compromise between physiological
16
reality, parameter identifiability and definition, and clinical implementation (Chase et al., 2006; Le Compte, 2009).
This section presents three clinically validated models of the glucose-insulin system that are used throughout the rest of this thesis. It also provides further details about the insulin sensitivity parameter used in these models. Finally, it presents the stochastic model used to manage intra-patient variability in this parameter.
2.5.1. Model 1
The first model of the glucose-insulin system is composed of two sub-models: a three-compartment model describing glucose kinetics and dynamics, and a two-compartment model representing insulin kinetics and dynamics. These compartment models are derived from minimal models proposed by Bergman et al. (1985) that have been adapted for critically ill patient by Doran et al. (2004) and extended to better capture transient dynamics by Chase et al. (2005). The overall model is illustrated in Figure 2-6 and is based on Chase et al. (2010b), where all model parameters are defined in Table 2-2. This model has been clinically validated (Chase et al., 2010b; Suhaimi et al., 2010) and is defined: = − − 1 + + min , + − + (2-1) = − 1 + + + exp− (2-2) = − + (2-3) = − + (2-4) = − min , + (2-5)
Equation (2-1) models BG kinetics and insulin dynamics, where is the BG concentration (mmol/L). Decreases in BG result from endogenous glucose clearance from plasma, insulin action modulated by insulin sensitivity (L/(mU/min)) (Section 2.1.2), and from non-insulin mediated glucose uptake by the central nervous system. Glucose appearance in the blood results from nutrition, endogenous glucose production and parenteral nutrition (mmol/min).
Insulin kinetics are modelled by Equations (2-2) and (2-3). Equation (2-2) describes the evolution of plasma insulin concentration (mU/L). decreases with plasma insulin clearance, which includes hepatic and renal losses as well as transcapillary insulin diffusion, and increases with exogenous insulin input (mU/min). The last term models inhibition of endogenous insulin secretion in response to a significant exogenous insulin input (3.0-4.0 U/h) (Liljenquist et al., 1978).
17
Figure 2-6: Multi-compartment model of insulin and glucose kinetics and dynamics.
Table 2-2: Parameter values for Model 1.
Parameter Value Unit Meaning
1/65 L/mU Michaelis-Menten constant for the saturation of insulin-dependent
glucose clearance
1.7 10-3 L/mU Michaelis-Menten constant for the saturation of plasma insulin
clearance
0.3 mmol/min Non-insulin mediated glucose uptake by the central nervous system
-ln(0.5)/20 min-1 Glucose transfer rate from stomach to gut
-ln(0.5)/100 min-1 Glucose transfer rate from gut to bloodstream
1.16 mmol/min Endogenous glucose production
3 mU/(L min) Endogenous pancreatic insulin secretion
-ln(0.5)/35 min-1 Effective life of insulin in the system
0.05 min/mU Factor accounting for the inhibition of endogenous insulin secretion
in response to a significant exogenous insulin input
0.16 min-1 Constant first order decay rate for insulin from plasma
0.006 min-1 Endogenous glucose clearance rate
6.11 mmol/min Maximum disposal rate from gut
13.3 L BG distribution volume
3.15 L Plasma insulin distribution volume
U refers to 1 unit of insulin (1/22 mg).
Equation (2-3) represents the kinetics of insulin concentration in the interstitial space (mU/L). Its transport is modelled as irreversible coming from plasma and disappearing in the system. This equation reflects insulin accumulation dynamics and accounts for insulin action delays due notably to insulin transfer from plasma to cells.
, 1 + 1 1 +
18
Equations (2-4) and (2-5) describe the kinetics of glucose concentration in the stomach,
(mmol), and the gut, (mmol), respectively. They rely on enteral nutrition input,
(mmol/min), and glucose transfer from the stomach to the gut and from the gut to the bloodstream.
2.5.2. Model 2
The second model of the glucose regulatory system is similar to the model described in Section 2.5.1, except for the insulin kinetics. This model is associated with extensive insulin kinetics modelling. Equations (2-2) and (2-3) are changed to Equations (2-7) and (2-8), respectively. Equations (2-1), (2-4) and (2-5) are rewritten as Equations (2-6), (2-9) and (2-10) for clarity. Parameter values related to Model 2 are summarised in Table 2-3. Model 2 is thus defined:
= − − 1 + + min , + − + (2-6) = − − 1 + − − + + 1 − (2-7) = − − 1 + (2-8) = − + (2-9) = − min , + (2-10) where endogenous insulin production is defined:
= max 16.67,
14
1 + 0.0147 − 41 (2-11)
In this second model, plasma insulin clearance is explained by three different clearance processes (Figure 2-6). The first process is the kidney clearance that is proportional to plasma insulin concentration. The second process is the liver clearance, which is a saturated process. And the third process is the insulin diffusion between plasma and interstitial space.
Equation (2-7) also accounts for endogenous insulin production (mU/min), defined in Equation (2-11), where only the fraction not extracted by first pass hepatic extraction contributes to plasma insulin level increase. The endogenous insulin secretion is also not suppressed by exogenous insulin delivery reflecting recent results in critically ill patients. Equation (2-8) models the receptor mediated, saturated process of interstitial insulin degradation. This model has also been clinically validated (Lin et al., 2011).
19
Table 2-3: Parameter values for Model 2 and Model 3.
Parameter Value Unit Meaning
1/65 L/mU Michaelis-Menten constant for the saturation of insulin-dependent
glucose clearance
1.7 10-3 L/mU Michaelis-Menten constant for the saturation of plasma insulin
clearance
0.3 mmol/min Non-insulin mediated glucose uptake by the central nervous system
-ln(0.5)/20 min-1 Glucose transfer rate from stomach to gut
-ln(0.5)/100 min-1 Glucose transfer rate from gut to bloodstream
1.16 mmol/min Endogenous glucose production
0.0075 min-1 Interstitial insulin degradation base rate
0.0075 min-1 Insulin diffusion rate between plasma and interstitial space
0.0542 min-1 Kidney clearance rate of plasma insulin
0.1578 min-1 Liver clearance base rate of plasma insulin
0.006 min-1 Endogenous glucose clearance rate
6.11 mmol/min Maximum disposal rate from gut
13.3 L BG distribution volume
4 L Plasma insulin distribution volume
0.67 / Fraction of first-pass liver extraction of insulin
2.5.3. Model 3
Recent research showed that endogenous insulin secretion in function of BG significantly differs between non-diabetic and diabetic patients (Pretty, 2012). Type II diabetic patients present impaired, lower insulin secretion in response to hyperglycaemia. The previous model of the glucose-insulin system has thus been enhanced to account for a patient’s diabetic status. More precisely, Model 3 is equivalent to Model 2 (Section 2.5.2), but with a more accurate modelling for endogenous insulin production as function of BG and diabetes status. Equation (2-11) is replaced by Equations (2-12) to (2-14), as a function of the patient’s diabetes status.
For non-diabetic patients: =
16.7 mU/min if ≤ 4.5 mmol/L
14.9 − 49.9 mU/min if 4.47 < ≤ 21.25 mmol/L 266.7 mU/min if > 21.25 mmol/L
(2-12)
where is the current patient BG level. For patients with type I diabetes: