O
pen
A
rchive
T
OULOUSE
A
rchive
O
uverte (
OATAO
)
OATAO is an open access repository that collects the work of Toulouse researchers and
makes it freely available over the web where possible.
This is an author-deposited version published in :
http://oatao.univ-toulouse.fr/
Eprints ID : 10596
To cite this version : Chabrat, Elodie and Rouilly, Antoine and Evon,
Philippe and Longieras, Antoine and Rigal, Luc Relevance of lab-scale
conical twin-screw extruder for thermoplastic STARCH/PLA blends
rheology study. (2010) In: PPS-26 Polymer Processing Society 24th
Annual Meeting, 04 July 2010 - 08 July 2010 (Banff, Canada)
Any correspondance concerning this service should be sent to the repository
administrator:
staff-oatao@listes-diff.inp-toulouse.fr
RELEVANCE OF LAB-SCALE
CONICAL TWIN-SCREW EXTRUDER FOR
THERMOPLASTIC STARCH/PLA BLENDS RHEOLOGY STUDY
E. Chabrat123*, A. Rouilly12, P. Evon12, A. Longieras3 and L. Rigal12 1. Université de Toulouse, INPT, LCA (Laboratoire de Chimie Agro-industrielle), ENSIACET, 4 Allée Emile Monso, 31432 Toulouse Cedex 4, France - *elodie.chabrat@ensiacet.fr
2. INRA, LCA (Laboratoire de Chimie Agro-industrielle)
3. Vegeplast, Parc des Pyrénées, 2 rue de Troumouse, 65420 IBOS, France -*ec@vegeplast.com
During the last decade, thermoplastic starch (TPS) has been studied more and more, alone and in blends. One key property of TPS is its viscosity. A lab-scale conical twin-screw extruder has been used to process polymers or blends of polymers at a small scale (7 cm3), and to measure their viscosity by pressure loss in a backflow channel. TPS has been tested at different temperatures (100-180°C) and for a 100-900s-1 shear rate range. One surprising result is the viscosity evolution of starch/glycerol blends (supposed to have become TPS before the rheology measurements) with temperature. An increase is observed between 120 and 140°C and then it decreases between 140 and 160°C. Therefore plasticization may happen only from 140°C. Blends of TPS with PLA and with different additives have also been studied. The additives are introduced in a second time, ten minutes after the TPS/PLA blend recirculation. Their influence on the blend viscosity is instantaneous. A viscosity increase after the additive introduction can be a clue for an improvement of the blend compatibilisation, as observed with CMC. Thanks to this micro-compounder, viscosity and behaviour of polymers can be evaluated easily even for TPS which needs shear to flow. Moreover, the solidified sample collected in the backflow channel at the end of the experiment can be used to test different properties like mechanical or thermal (DMTA, DSC) ones. Using this kind of lab-scale extruder represents then a good opportunity for preview screening studies.
Introduction
During the last decade, thermoplastic starch (TPS) has been studied more and more, alone (Stepto, 2009) and in blends (Ke and Sun, 2001). Indeed, starch is a renewable and biodegradable resource which can be transformed into a thermoplastic material by using plasticizers, shear and temperature. This product is very promising, in spite of its sensibility to water and its poor mechanical properties. It is well-known that starch plasticization can be realised in a twin screw extruder (Martin et al. 2003). Twin-screw extruders range widely from lab-scale (g/min) to industrial-scale (Tons/min).
Among the smallest twin-screw extruders, one can find the Thermo-Haake Minilab (Thermo Scientific, Haake, Germany). As this instrument contains co-rotating twin screws, it can represent the performance of a co-rotating extruder (industrial scale) (Moghaddam et al. 2009). The Minilab operates at speeds between 10 and 360 rpm, corresponding to shear rates between 35s-1 and 1248s-1 in the geometry controlled back flow channel and its heating capacity and maximum temperature are 800W and 450°C respectively. The Minilab has a maximum feed capacity of 7 cm3. The backflow (recirculating) channel in the Minilab allows its use as a mixing reactor with controlled
recirculation rather than direct extrusion through the die. In addition to melt processing operations, the Minilab can also be used as a rheometer by using a pair of pressure transducers in the backflow channel. An approximate value for the melt viscosity is calculated automatically by the Minilab software using the pressure loss between these two sensors.
This apparatus can thus be used to study new blends or new products. After a screening at small scale, the interesting blends can be processed on an industrial twin-screw extruder with new parameters like temperature profile (and not just one temperature), choice of the screw configuration…
In this study, starch has first been plasticized with glycerol. Variable factors were the temperature, the screw speed (shear rate) and the glycerin rate. Then, thermoplastic starch has been blended with a biodegradable polyester, the polylactic acid (PLA). This blend already studied in several previous works is not miscible and needs to be compatibilized. The last part of this work describes a method to visualize the additive impact on the viscosity.
Experimental Materials
Wheat starch was supplied by Gers Farine (France). Starch plasticizer was glycerol (purity 99%) supplied by Gaches Chimie (France). The PLA (Ingeo 3251D was supplied by Natureworks (USA).
The three tested additives were CMC (carboxymethylcellulose), which is a Blanose 7M grade (Aqualon), succinic acid (Sigma-Aldrich) and xanthan gum (IMCD).
TPS fabrication
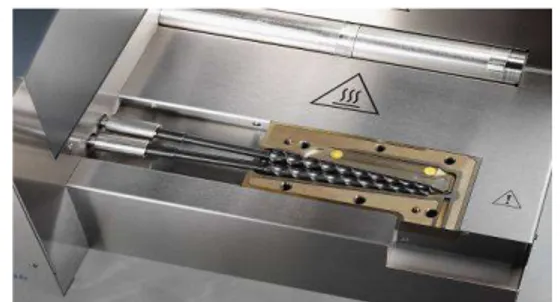
Starch was hand-blended with glycerol and then introduced in a lab-scale twin-screw extruder, the Minilab (Thermo Scientific Haake, Germany) (Figure 1).
Figure 1 Configuration of the Minilab with the twin screws and the pressure transducers
In our case, the experiments were performed at 120-160°C and screw speeds between 50 and 250rpm. The sample was processed in the Minilab in recirculating mode for 8 minutes (stabilization time) before measuring the viscosity for 20 minutes, i.e. 28 minutes of recirculation. To study the influence of glycerol rate, temperature and shear rate, a design of experiment (DOE) was made as described in Table 1.
Table 1 - Design of experiment for the starch plasticization Experiment number Temperature (°C) Screw speed (rpm) Glycerol content (%) 1 160 150 30 2 120 150 30 3 150 237 30 4 130 63 30 5 150 63 30 6 130 237 30 7 150 179 34.1 8 130 121 25.9 9 150 121 25.9 10 140 208 25.9 11 130 179 34.1 12 140 92 34.1 13 140 150 30 14 140 150 30 15 140 150 30 Characterization
Viscosity was directly measured with the lab-scale extruder thanks to its pressure transducers. It was calculated as described in Equation 1 and measured every minute for 20 minutes. Finally, these viscosities were averaged. The average is the product viscosity given in the results part.
Equation 1 Viscosity formula
.
γ
τ
η
=
WithP
l
h
∆
×
∆
=
)
2
(
τ
andn
wh
7 2 .10
.
8
)
6
(
×
−=
γ
Viscosity (Pa.s) : ηShear stress (Pa) : τ and shear rate (s-1) :
γ
.
Depth of the flow channel : h = 1.5mm Width of the flow channel : w = 10mm Distance between the transducers : ∆l = 64mm Pressure drop (Pa) : ∆P
Screw speed (s-1) : n
Extruded samples were collected from the backflow channel for analytical purposes. All experiments were performed in triplicates. These samples were 70mm long, 8mm large and 1mm thick. They were conditioned at 25°C and 60%HR for stabilization for one week prior to testing.
The tensile testing was carried out at a rate of 5mm/min according to ASTM D638.
Dynamic mechanical analyses (DMA) of the samples were performed with a Tritec 2000 DMA (Triton Technology, UK) over the temperature range -100 to 200°C with a scanning rate of 2°C/min. The amplitude and frequency were maintained constant at 25µm and 1 and 10Hz, respectively.
Thermal study was also performed on a Pyris 1 differential scanning calorimeter (DSC) (Perkin-Elmer). The measurement cells were purged with dry nitrogen. The temperature was calibrated by use of indium (Tf = 156.6°C). The pans used for this study
were airtight steel capsules with an 0-ring. They withstand high pressure (40bar) and are therefore well adapted for studying weakly hydrated biopolymers at high temperatures. The sample weighed approximately 20mg. The measurements were taken during the first scan, at 20°C/min between 40 and 200°C.
2min 5min 1min 30s
Results and Discussion Recirculation in the Minilab
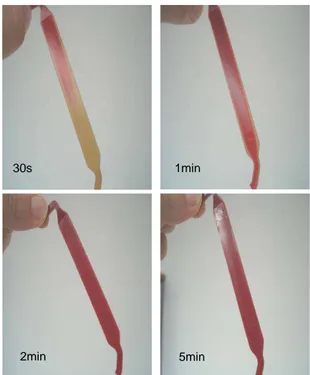
To ensure that the matter correctly recirculates in the lab-scale extruder, the following experiment was made: A starch/glycerol blend was introduced in the lab-scale extruder at 140°C with a screw speed of 150rpm. After 5 minutes, a small quantity of a dye (erythrosine) was introduced (t=0s) and the experiment was stopped after 30s, 1min, 2min and 5min.
The color of the sample in the backflow channel is representative of the circulation of the matter. On Figure 2, one can find the photographs of the 4 samples (4 different times of experiment). After 30s (top-left), the dye has only reached the middle of the channel. After one minute, the dye has colored almost all the backflow channel except for the extreme sides. After 2 minutes, the whole backflow channel is colored, the dye had circulated everywhere in the channel. After 5 minutes, the sample is darker, meaning that the dye had already circulated several times in the backflow channel. Hence, the matter does effectively recirculate in the lab-scale extruder.
Plasticization of starch
DOE results are represented on figures 3 to 5 (response surface). The temperature has only a small effect on the viscosity comparing to glycerol rate and screw speed. A screw speed increase (i.e. shear rate increase) leads to a decrease of the viscosity whatever the temperature and the glycerol rate, which is consistent with the shear-thinning behavior of TPS. A glycerol rate increase also leads to a viscosity decrease whatever the temperature or the screw speed.
Figure 3 Viscosity as a function of the screw speed (vit) and the temperature (T), glycerol rate = 30%
Figure 4 Viscosity as a function of the screw speed (vit) and the glycerol rate (tx), T fixed = 140°C
Figure 5 Viscosity as a function of the temperature (T) and the glycerol rate (tx), screw speed fixed = 150rpm Figure 2 Samples with different residence time of
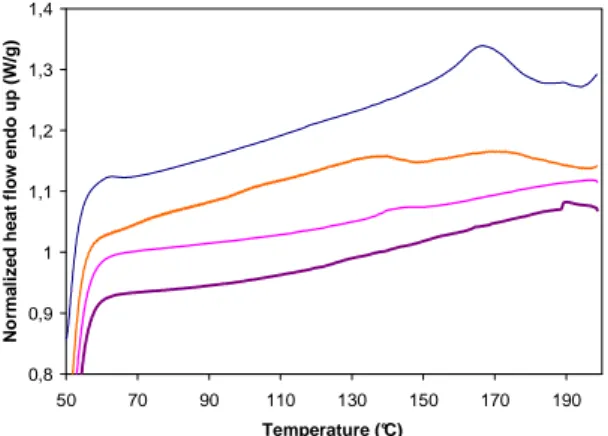
Even if the temperature has a small effect on the viscosity, at high screw speed a viscosity maximum is observed around 140°C as represented on Figure 6. This viscosity maximum could be explained by a transformation happening at 140°C. After 140°C, the viscosity decreases with the temperature which is a classical behaviour for a thermoplastic. Following this hypothesis, this means that before 140°C, the destructuration (and/or plasticization) of starch may not be complete. This idea was confirmed with thermal analysis (Figure 7). On the DSC graph, a peak is observed around 170-180°C for native starch. For a manual blend of starch and glycerol, this peak is divided into two peaks, around 175°C and around 140°C. This second peak was still observed after extrusion at 120°C, whereas it disappeared after extrusion at 140°C. This peak may be representative of the native structure and disappears totally after complete destructuration (and/or plasticization). Van Soest et al. (1996) have already studied the melting of potato starch with low and high amounts of glycerol and have observed similar behavior.
0 20 40 60 80 100 120 140 160 180 200 90 100 110 120 130 140 150 160 Temperature (°C) V is co si ty (P a. s)
Figure 6 Viscosity of a starch/glycerol blend (75/25) at 622s-1 (175rpm) for different temperatures
0,8 0,9 1 1,1 1,2 1,3 1,4 50 70 90 110 130 150 170 190 Temperature (°C) N o rm a li z e d h e a t fl o w e n d o u p ( W /g )
Figure 7 Thermal properties of starch and its blends with glycerol (from top to bottom : a-native starch, b-starch + glycerol non extruded, c-b-starch + glycerol
extruded at 120°C, 175rpm for 7min, d-starch + glycerol extruded at 140°C, 50rpm for 20min)
Blending with PLA
Blends of thermoplastic starch and PLA were also made in the lab-scale extruder (Figure 8). At 140°C, TPS and PLA viscosities intersected at 500s-1, meaning that at lower shear rates, PLA is more viscous than thermoplastic starch and reversely at higher shear rates. This is interesting because it means that at 500s-1, the two products have the same viscosity, which is a perfect condition for blending. What is also interesting on this graph is the blend viscosities. Whatever the proportions, it is always lower than the viscosity of the two components. This result can be an indication of a bad blend compatibility where the two phases repel each other and the blend is more fluid. Opposingly, when a blend is homogeneous, the viscosity of the blend is higher than the viscosity of the components because of interactions between the two phases.
50 100 150 200 250 300 350 400 100 300 500 700 900 Shear rate (s-1) V is c o s it y ( P a .s )
Figure 8 Flow curves for different TPS/PLA blends at 140°C – ( : TPS, * : PLA, other curves : blends
TPS/PLA from 95/5 to 50/50)
Method to study additives influence
Here is presented a simple method to study the additive influence on a blend. In each experiment, the beginning was the same. Starch, glycerol and PLA were extruded for 18min (8min of stabilization and 10min of measure). After these 18min, the additive was introduced in the extruder and the viscosity was measured for 10min (Figure 9).
80 100 120 140 160 180 200 0 5 10 15 20 25 Time (min) V is c o s it y ( P a .s )
Figure 9 Evolution of the viscosity with the introduction of an addtive at mid-experiment (continuous curve : no additive, point curve : CMC,
dash curve : xanthan gum and point & dash curve : succinic acid)
The continuous line is the reference curve (without mid-experiment add). Some additives lower the viscosity (succinic acid - dash and point curve), one can imagine maybe a lack of affinity between the components or a degradation of some of them (acidic degradation). Some additives have no influence on the viscosity (xanthan gum - dash curve). These additives have maybe no influence on the blend. The other additives increase the viscosity (CMC - point curve). The increase can be simply explained by a thickening effect of some products or by a compatibilisation of the blend. A viscosity increase of the blend can be a clue for a blend compatibilisation improvement.
Conclusions
Starch plasticization, starch blending with PLA and even with compatibilizers was possible in the lab-scale extruder. Moreover, instantaneous viscosity measurements provided useful information about the matter state in the extruder.
Acknowledgements
We would like to thank Maria Konstantakopoulou for her help for the experiments and the French Environment and Energy Management Agency (ADEME) for financial help.
References
Ke, T. & Sun, X., “Effects of moisture content and heat treatment on the physical properties of starch and poly(lactic acid) blends”, Journal of Applied Polymer
Science, 81(12), 3069-3082 (2001)
Martin, O., Averous, L. & Della Valle, G., “In-line determination of plasticized wheat starch viscoelastic behavior: impact of processing”, Carbohydrate
Polymers, 53(2), 169-182 (2003)
Moghaddam, L., Martin, D., Halley, P. & Fredericks, P., “Vibrational spectroscopic studies of laboratory scale polymer melt processing: Application to a thermoplastic polyurethane nanocomposite”,
Vibrational Spectroscopy, 51, 86-92 (2009)
Stepto, R.,. “Thermoplastic Starch”, Macromolecular
Symposia, 279(1), 163-168 (2009)
Van Soest, J.J.G., Bezemer, R.C., de Wit, D. & Vliegenthart, J.F.G., “Influence of glycerol on the melting of potato starch”, Industrial Crops and


