comm en t re v ie w s re ports de p o si te d r e se a rch refer e e d re sear ch interacti o ns inf o rmation
Genomic analysis reveals that Pseudomonas aeruginosa virulence is
combinatorial
Daniel G Lee
*†‡
, Jonathan M Urbach
*†
, Gang Wu
*†
, Nicole T Liberati
*†
,
Rhonda L Feinbaum
*†
, Sachiko Miyata
*†
, Lenard T Diggins
§
, Jianxin He
¶¥
,
Maude Saucier
¶¥#
, Eric Déziel
¶¥**
, Lisa Friedman
¶††
, Li Li
‡‡
,
George Grills
‡‡§§
, Kate Montgomery
‡‡
, Raju Kucherlapati
‡‡
,
Laurence G Rahme
¶¥
and Frederick M Ausubel
*†
Addresses: *Department of Molecular Biology, Massachusetts General Hospital, Cambridge Street, Boston, Massachusetts, 02114, USA. †Department of Genetics, Harvard Medical School, Avenue Louis Pasteur, Boston, Massachusetts, 02115, USA. ‡Current address: Microbia, Inc., Bent Street, Cambridge, Massachusetts, 02141, USA. §Envivo Pharmaceuticals, Inc., Arsenal Street, Watertown, Massachusetts, 02472, USA. ¶Department of Microbiology and Molecular Genetics, Harvard Medical School, Longwood Avenue, Boston, Massachusetts, 02115. USA. ¥Department of Surgery, Massachusetts General Hospital, Fruit Street, Boston, Massachusetts, 02114, USA. #Current address: Université de Montréal, Station Centre-ville, Montréal, H3C 3J7, Canada. **Current address: INRS-Institut Armand-Frappier, boul. des Prairies, Laval, Quebec, H7V 1B7, Canada. ††Current address: Cubist Pharmaceuticals, Inc., Hayden Avenue, Lexington, Massachusetts, 02421, USA. ‡‡Harvard Medical School - Partners Healthcare Center for Genetics and Genomics, Landsdowne Street, Cambridge, Massachusetts, 02139, USA. §§Current address: Core Facilities, Cornell University, Thurston Avenue, Ithaca, New York, 14850, USA.
Correspondence: Frederick M Ausubel. Email: [email protected]
© 2006 Lee et al.; licensee BioMed Central Ltd
This is an open access article distributed under the terms of the Creative Commons Attribution License (http://creativecommons.org/licenses/by/2.0), which permits unrestricted use, distribution, and reproduction in any medium, provided the original work is properly cited.
Pseudomonas aeruginosa virulence
<p>Sequencing of a highly virulent strain of <it>Pseudomonas aeruginosa </it>and comparison to a previously sequenced, less patho-genic, strain, together with experimental testing in a <it>C. elegans model</it>, suggests that <it>Pseudomonas </it>virulence is multi-factorial and combinatorial.</p>
Abstract
Background: Pseudomonas aeruginosa is a ubiquitous environmental bacterium and an important opportunistic human pathogen. Generally, the acquisition of genes in the form of pathogenicity islands distinguishes pathogenic isolates from nonpathogens. We therefore sequenced a highly virulent strain of P. aeruginosa, PA14, and compared it with a previously sequenced (and less pathogenic) strain, PAO1, to identify novel virulence genes.
Results: The PA14 and PAO1 genomes are remarkably similar, although PA14 has a slightly larger genome (6.5 megabses [Mb]) than does PAO1 (6.3 Mb). We identified 58 PA14 gene clusters that are absent in PAO1 to determine which of these genes, if any, contribute to its enhanced virulence in a Caenorhabditis elegans pathogenicity model. First, we tested 18 additional diverse strains in the C. elegans model and observed a wide range of pathogenic potential; however, genotyping these strains using a custom microarray showed that the presence of PA14 genes that are absent in PAO1 did not correlate with the virulence of these strains. Second, we utilized a full-genome nonredundant mutant library of PA14 to identify five genes (absent in PAO1) required for C. elegans killing. Surprisingly, although these five genes are present in many other P. aeruginosa strains, they do not correlate with virulence in C. elegans.
Conclusion: Genes required for pathogenicity in one strain of P. aeruginosa are neither required for nor predictive of virulence in other strains. We therefore propose that virulence in this organism is both multifactorial and combinatorial, the result of a pool of pathogenicity-related genes that interact in various combinations in different genetic backgrounds.
Published: 12 October 2006
Genome Biology 2006, 7:R90 (doi:10.1186/gb-2006-7-10-r90)
Received: 28 July 2006 Revised: 25 September 2006 Accepted: 12 October 2006 The electronic version of this article is the complete one and can be
Background
The potential virulence of bacterial pathogens is significantly modulated by the presence of pathogenicity islands [1,2], which are clusters of one or more virulence-related genes that are often acquired by horizontal gene transfer. The introduc-tion of these virulence islands can allow a previously nonvir-ulent isolate to infect a particular host. Commonly, this switch to a simpler and more stable environment within a host (as opposed to the more complex outside environment) is fol-lowed by gene loss and genome reduction that improve the ability of the pathogen to survive in the host but also restrict the range of hosts available to the bacterium [3,4]. In con-trast, free-living bacteria that dominate in complex environ-ments (such as soil) tend to have genomes that continue to acquire DNA and undergo expansion rather than reduction. Pseudomonas aeruginosa, a ubiquitous Gram-negative soil organism, is an important opportunistic human pathogen that infects injured, burned, immunodeficient, and immuno-compromised patients, and causes persistent respiratory infections in individuals suffering from cystic fibrosis (CF) [5,6]. The genome sequence of the widely studied P. aerugi-nosa strain PAO1 (originally a wound isolate) revealed that it possesses a large number of genes that are involved in regula-tion, catabolism, transport, and efflux of organic compounds, as well as several putative chemotaxis systems [7], all of which potentially contribute to the remarkable ability of this bacte-rium to adapt to a wide range of environmental niches. Different P. aeruginosa isolates share a remarkable amount of similarity in their genomes. When DNA derived from sev-eral P. aeruginosa strains was hybridized to a PAO1 microar-ray, between 89% and 98% of the PAO1 sequences were detected [8,9]. Whole-genome shotgun sequencing of two CF isolates and one environmental strain revealed that, aside from this apparent highly conserved core set of P. aeruginosa genes, differences were largely due to strain-specific islands of genes, consisting either of genes with similar or related function but divergent DNA sequences (such as genes for bio-synthesis of the O-antigen component of lipopolysaccharide, genes for flagellar biosynthesis, or alternate forms of genes for the bacteriocidal pyocins) or genes that are entirely absent in some strains [10].
Despite the overall genome similarity among diverse P. aeru-ginosa strains, differences in complex phenotypes such as pathogenicity can be striking. For example, the clinical isolate PA14 is significantly more virulent than PAO1 in a wide range of hosts, including mice, the nematode Caenorhabditis ele-gans, the insect Galleria mellonella, and the plant Arabidop-sis thaliana [11-13]. PA14 genes required for full virulence include genes common to many if not all P. aeruginosa strains, including global transcriptional regulators such as gacA; genes that are involved in pathogenesis-related proc-esses such as motility, quorum sensing, and phenazine bio-synthesis; and genes that encode secreted cellulytic factors
elastase [12-18]. On the other hand, novel PA14 genes that are absent in PAO1 (and potentially absent in other isolates) have also been identified as being required for pathogenicity in model hosts and mice [11,15,17,18], and at least some of these genes appear to reside on large pathogenicity islands [19]. Taken together, these studies suggest that PA14 pathogenicity is multifactorial, requiring the cumulative (and potentially coordinated) action of multiple virulence factors, some of which are components of the basic core genome, whereas oth-ers are located on classically defined virulence islands. The experiments described in this paper were designed to test the hypothesis that the enhanced virulence of PA14 compared with PAO1 is mostly a consequence of recognizable patho-genicity (virulence) islands that are present in PA14 but absent in PAO1. To expand our tools for dissecting P. aerugi-nosa virulence and to test the hypothesis that strain differ-ences in virulence are due to the acquisition of strain-specific genes, we sequenced the PA14 genome and performed a func-tional analysis of genes that are present in PA14 but absent in PAO1 to assess their contribution to pathogenicity.
Results and discussion
PA14 genome sequence
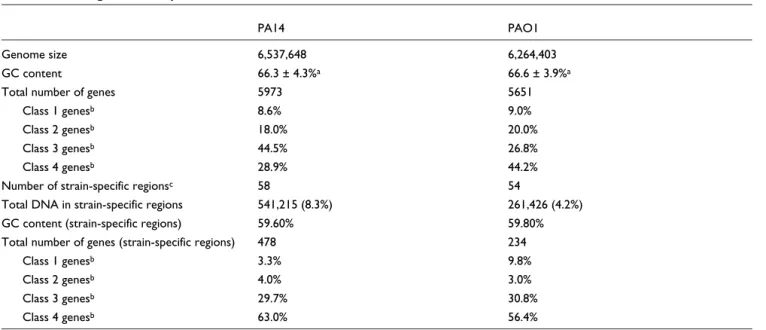
To identify all of the putative pathogenicity islands that dis-tinguish PA14 from PAO1, we sequenced the PA14 genome and found that it contains a slightly larger chromosome (6.5 megabases [Mb] versus 6.3 Mb for PAO1; genome sequence and annotations are available at the Ausubel lab PA14 sequencing website [20] and have also been deposited in GenBank [GenBank: CP000438]). Consistent with previous observations that overall strain similarity is high, we found that approximately 91.7% of the PA14 genome is present in PAO1, and that 95.8% of the PAO1 genome is present in PA14 (Table 1).
The PA14 and PAO1 genomes are largely colinear with the exception of one major rearrangement that has previously been described: an inversion between two of four dispersed copies of a large ribosomal RNA cluster (Figure 1[7]). We used long-range polymerase chain reaction (PCR) spanning the rRNA clusters to verify the inversion in the sequenced PA14 and PAO1 genomes; PCR products predicted to be indicative of one orientation or the other were only generated when either PAO1 or PA14 DNA was used as the template (Figure 2a,b). When 18 diverse P. aeruginosa strains were subjected to this same PCR analysis, all 18 of these isolates were the same or resembled PA14 genome structure with respect to the large inversion, whereas none of the 18 strains had or resem-bled the PAO1 genome structure (data not shown). Of note, additional PAO1 clones (distinct from the isolate that was sequenced) also appear to contain the same inversion found in PA14 [7].
comm en t re v ie w s re ports refer e e d re sear ch de p o si te d r e se a rch interacti o ns inf o rmation
We also compared the GC skews of the PA14 and PAO1 genomes. GC skew is defined as the value of [G-C]/[G+C] where G and C represent the local base frequencies of G and C, respectively. In prokaryotic genomes there is a bias toward G over C on the leading strand of DNA synthesis [3]. There-fore, when measured at regular intervals along the chromo-some (1 kilobase [kb] segments) GC skew tends to have a positive value on the leading strand of DNA synthesis and a negative value on the lagging strand, resulting in polarity changes at the origin and terminus of replication. The puta-tive position of the replicaputa-tive terminus is therefore opera-tionally defined as the peak of the cumulative GC skew and it typically resides opposite the origin of replication in bacterial genomes [3]. For PA14, the peak GC skew was indeed mapped opposite the replication origin (at 49.2% of the genome; Fig-ure 2a,c). In contrast, the position of the terminus in the sequenced PAO1 chromosome is shifted relative to the origin (at 38.8% of the genome). These observations argue that the PA14 chromosome with respect to this large inversion is more representative of the canonical or ancestral P. aeruginosa genome than that of the sequenced PAO1 isolate. This inter-pretation that is further supported by the finding that the inversion in the sequenced strain occurred sometime after 1990 (a PAO1 cosmid library originally described in that year was shown not to contain the inversion [21]). However, the physiologic consequences of such an inversion and asymmet-ric replication cycle are not clear.
PA14 gene annotation
We annotated the PA14 genome and identified 5973 pre-dicted open reading frames (ORFs; 322 more than in PAO1; Table 1). Summaries of all predicted PA14 genes and their dis-tribution among different functional categories are presented in Additional data files 2 and 3, respectively. We performed a reciprocal NCBI-BLAST (basic local alignment search tool) search of each gene in either PA14 or PAO1 against the total collection of genes in the other strain (specifically, each PA14 gene was BLASTed against the complete set of PAO1 genes, and vice versa). The position of each best BLAST hit was plot-ted (with the PA14 genomic location on the x-axis, and the PAO1 coordinate on the y-axis; Figure 3), confirming that the two genomes are largely colinear, with the exception of the large inversion described above. Individual PA14 genes that had no counterpart in PAO1 are shown as individual (green) data points on the x-axis, and PAO1 genes absent in PA14 are represented as (pink) data points on the y-axis. Large clusters of these strain-specific genes often correlated with regions of the respective genomes in which the local GC content was lower than that of the total genome (Figure 3).
Using a combination of raw sequence and ORF-based global alignments of the two genomes, we compiled a list of gene clusters present in one strain but absent in the other (58 PA14 regions absent in PAO1 containing 478 genes, and 54 PAO1 regions absent in PA14 containing 234 genes; Table 1 and
Table 1
PA14 and PAO1 genome comparisons
PA14 PAO1
Genome size 6,537,648 6,264,403
GC content 66.3 ± 4.3%a 66.6 ± 3.9%a
Total number of genes 5973 5651
Class 1 genesb 8.6% 9.0%
Class 2 genesb 18.0% 20.0%
Class 3 genesb 44.5% 26.8%
Class 4 genesb 28.9% 44.2%
Number of strain-specific regionsc 58 54
Total DNA in strain-specific regions 541,215 (8.3%) 261,426 (4.2%)
GC content (strain-specific regions) 59.60% 59.80%
Total number of genes (strain-specific regions) 478 234
Class 1 genesb 3.3% 9.8%
Class 2 genesb 4.0% 3.0%
Class 3 genesb 29.7% 30.8%
Class 4 genesb 63.0% 56.4%
aStandard deviation was calculated using a sliding 1 kb window (see Additional data file 1). bClasses 1-4 refer to the confidence rating assigned to the predicted gene function, as previously described [7,22]. Class 1 genes are those whose function has been experimentally validated in P. aeruginosa. Class 2 genes are highly similar to genes whose functions have been validated in another organism. Class 3 genes have hypothesized functions based on limited similarity to other genes or structural/functional domains. Class 4 genes are open reading frames (ORFs) of unknown function. c Strain-specific regions with at least one ORF.
Additional data file 4). We refer to these as PA14-specific or PAO1-specific regions for the purposes of this discussion
(rec-ognizing that these genes may be present in other isolates of P. aeruginosa and are not strictly strain specific). Many of
Circular map of the PA14 genome
Figure 1
Circular map of the PA14 genome. The outermost circle represents the chromosomal location: major and minor ticks represent 500 and 100 kb increments, respectively. The origin and presumptive terminus of replication are indicated by green and red arrows, respectively. The locations and orientations of predicted genes are shown by rectangles in the next pair of circles; genes on the outer circle are transcribed on the plus strand and genes on the inner circle are transcribed on the minus strand. The genes are color-coded according to functional categories (see below). Blue arrow heads indicated the locations and relative orientations of four ribosomal RNA gene clusters; the published PAO1 sequence contains an inversion (gray arrow) with respect to PA14 resulting from a presumptive recombination event between two of the rRNA clusters. The innermost circle represents the GC content as calculated for non-overlapping 1 kb windows of the plus strand. A linear map and full annotations of each gene (including color codes for functional categories) are available at the Ausubel lab PA14 sequencing website [20] and the full sequence and annotations have been deposited in GenBank (GenBank: CP000438).
1M
4M
In
version
3M
2M
5M
6M
0
PA14
6,537,648 bp
comm en t re v ie w s re ports refer e e d re sear ch de p o si te d r e se a rch interacti o ns inf o rmation
these gene clusters have hallmarks of horizontally acquired DNA, including direct repeats, insertion sequences, tRNA genes at their boundaries (data not shown), and/or anoma-lous GC contents (PA14-specific clusters have an average GC content of 59.6%, which is more than one standard deviation below the whole genome average of 66.3%; Table 1). These strain-specific regions contain a high proportion of genes of unknown function as compared with the whole genome. Each PA14 (and PAO1) annotation has a confidence score associated with the described gene function [7,22]. A class 1 designation refers to genes whose functions have been experimentally validated in P. aeruginosa, class 2 genes are highly similar to genes whose functions have been validated in other organisms, class 3 genes have hypothesized functions based on limited similarity to other genes or structural/tional domains, and class 4 genes are ORFs of unknown func-tion. For the PA14-specific regions, 63% of the predicted ORFs have no known function, whereas only 28.9% of genes in the whole genome have class 4 annotations (Table 1). Therefore, gene identity alone could not indicate whether vir-ulence-related genes were enriched in PA14-specific regions. Conservation of PA14-specific genes and their putative role in virulence
If a PA14 strain-specific region were functioning as a canoni-cal pathogenicity island, then it should be more prevalent among other pathogenic isolates (and less prevalent among avirulent isolates). To test this hypothesis we needed to estab-lish an objective measure of pathogenicity to compare differ-ent P. aeruginosa strains as well as to develop a high throughput method for determining the genomic content of the different strains. We used a model host infection system (the nematode Caenorhabditis elegans) to rank order the vir-ulence of 18 diverse P. aeruginosa strains, using PA14 and PAO1 as reference strains. The 18 P. aeruginosa strains included 13 clinical isolates from a variety of infection types (CF lung infections, urinary tract infections, ocular infections, and blood isolates), one laboratory strain, and four environ-mental isolates. This same set of strains had been used in a previous study of P. aeruginosa strain diversity [9]. We used a custom microarray-based system (described below) to determine relatedness of the 20 (18 plus PAO1 and PA14) P. aeruginosa strains.
In the C. elegans model pathogenicity system [13], an age-synchronized population of nematodes is fed the pathogen to be tested (instead of Escherichia coli, its traditional labora-tory food source) and the longevity of the nematodes is deter-mined. As shown previously, the longevity of C. elegans feeding on a particular P. aeruginosa strain correlates with virulence of the strain in mice [13,15,18]. The set of P. aerugi-nosa strains tested exhibited a full range of virulence pheno-types, including both the upper and lower limits that the assay system is capable of measuring (Figure 4a). PA14 (dark blue diamonds, second curve from the left) is extremely
effi-cient at killing nematodes, whereas the less pathogenic PAO1 is intermediate (pink squares), killing more slowly than PA14 but more quickly than E. coli (negative control; yellow squares, second curve from the right).
The observation that PAO1 is more virulent than many other tested strains suggests that it has not become attenuated because of extensive passaging in the laboratory; rather, its virulence is probably that of a moderately pathogenic strain, with other strains more representative of truly 'avirulent' iso-lates. When comparing strains derived from the same type of infection, there was no consistent clustering with respect to their phenotype in C. elegans. For example, both the most and the least virulent strains tested were isolates from CF infections. Similarly, the five urinary tract infection strains exhibited a wide range of virulent to avirulent phenotypes. Importantly, two closely related environmental isolates (MSH3 and MSH10) were the fourth and fifth most virulent strains tested, indicating that nonclinically isolated strains can also have the potential to be infectious.
To test the hypothesis that the virulence of the 20 P. aerugi-nosa strains correlates with the presence of particular viru-lence islands, we performed a microarray-based analysis of the genomic content (a process described as genomotyping [23]) of the P. aeruginosa strains. We arrayed 285 synthetic oligonucleotides (70 mers) corresponding to PA14 genes that are absent in PAO1 and 130 oligonucleotides corresponding to PAO1 genes that are absent in PA14, along with additional sequences serving as positive and negative controls (see Materials and methods, below, and Additional data files 5 and 6). We first used the array data to generate a hierarchic clus-tering dendrogram showing the relatedness of the 20 P. aer-uginosa strains (Figure 4b). Next, we used the C. elegans virulence data in Figure 4a to rank order the 20 strains and then examine the microarray data to determine whether the presence or absence of PA14-specific (or PAO1-specific) genes correlated with virulence (also see Table 2 and Additional data file 6). Strains were ordered from the most virulent (rank order 1) to the least virulent (rank order 20), with strains that had equivalent virulence assigned a tied rank. When the viru-lence rank order of each strain was superimposed on the den-drogram describing the relatedness of each strain based on genomic content (Figure 4b), no strong correlation was observed with the relative virulence of each strain in C. ele-gans. There are small clusters of similarly avirulent or viru-lent strains; for example, strains 6077, U2504, JJ692, S54485, and X13273 grouped together and possess similar virulence rankings (10, 6, 12, 10, and 10, respectively). How-ever, these small clusters were occasionally punctuated by exceptions: a cluster of weakly virulent or avirulent strains (CF5, E2, PAK and CF27, with rank orders of 20, 17, 13, and 18, respectively) also includes strain UDL, which is the third most pathogenic strain tested.
Figure 2 (see legend on previous page)
PAO1
A
B
C
D
E
F
G
H
I
K
L
J
1
2
5
6
6,264,403 MB
38.8%
F
PA14
A
B
J
I
H
G
E
D
K
L
C
3
4
5
6
6,537,648MB
49.2%
(a)
PA14
PAO1
- 60 - 40 - 20 0 20 40 60 80 100 0 1 2 3 4 5 6 7Cumulative GC skew
Chromosomal position ( Mbp)
(c)
(b)
1
2
3
4
5
6
1
2
3
4
5
6
10 kb 6 kb 4 kb 3 kb 8 kb 5 kbcomm en t re v ie w s re ports refer e e d re sear ch de p o si te d r e se a rch interacti o ns inf o rmation
In a previous study, Wolfgang and coworkers [9] used Affymetrix GeneChips to survey these same 18 strains (with the exception of PA14) for the presence or absence of PAO1 genes and found no obvious pattern that would correlate genomic content with disease (or the type of infection from which the isolate was derived). Similarly, examination of the distribution of PA14-specific genes among the tested isolates did not reveal any obvious clustering of genomic content with respect to the source of the strain (see dendrogram in Figure 4b).
Identification of PA14-specific virulence genes and their conservation in other strains
The experiments described above showed that there was no correlation between the PA14-specific sequences in general and virulence in the C. elegans killing assay. We therefore performed a functional analysis of PA14-specific ORFs, iden-tifying genes that were specifically required for pathogenicity and subsequently assessing their distribution among the other strains. Our laboratory has constructed a genome-wide, nonredundant transposon insertion mutant library in PA14 [24,25]. Using this library, we conducted a screen for mutants in PA14-specific genes that had reduced virulence in C. ele-gans. Nine genes were identified, which fell into six distinct clusters (Table 3). Three of these clusters are present in all of the other 19 P. aeruginosa strains but contain highly diver-gent sequences, including the O-antigen biosynthetic cluster (region PA14R38) and two groups of type 4 fimbrial biogen-esis genes (regions PA14R77 and PA14R79). Oligonucleotides corresponding to the PA14-version of the O-antigen biosyn-thesis genes were included on the array and demonstrated that none of the other strains contain the PA14-versions of these genes; the genes for the two fimbrial synthesis clusters were not included on the array (because the sequences were not sufficiently divergent to meet our criteria for oligonucle-otide design as outlined in Additional data file 1).
The remaining three clusters contain genes that are absent in PAO1. As indicated in Table 3, these three clusters contain
five virulence genes, including one gene with putative tran-scriptional regulator activity and four ORFs of unknown func-tion. Figure 4c summarizes the array data for these three regions. Each of the 20 strains tested are represented in col-umns arranged from left to right in order of decreasing path-ogenicity (see Table 2 for rank order of virulence). The PA14 genes tested (shown in rows) are described as present (blue), absent (yellow), or indeterminate (red, indicating that the hybridization intensity was intermediate and a present or absent call could not be made with confidence; see Additional data file 1 for further details). The positions of the genes that result in an avirulent phenotype when mutated in PA14 are indicated on the right (also see Table 3). If a cluster of genes was required for or predictive of virulence in nematodes then we would expect to see a bias for present (blue) calls toward the left and absent (yellow) calls toward the right.
For these five virulence genes (and their associated three clus-ters), Spearman's rank correlation coefficients (relating their presence, absence, or indeterminate status with the virulence of the strain) were found to vary dramatically. The best corre-lation was found for two genes in region PA14R41 (correcorre-lation coefficients of 0.63). This is a cluster of eight genes known as the clone C-specific region common to clone C isolates (mem-bers of a clone family associated with CF infections [26]). Intermediate to no correlations were observed for the remaining two regions, namely PA14R78 and PAR09, which had correlation coefficients of 0.44 and 0.02, respectively. Of note, PA14R78 is a previously described pathogenicity island (PAPI-1) shown to contain genes required for pathogenicity in plants and mammals [19], although the two mutations in genes of unknown function that we identified in this cluster (PA14_59010 and PA14_59070; positions 6 and 7 in Figure 4c) were not among those previously examined. Regardless of the magnitude of the correlation, each virulence gene had exceptions to the expected trend, being present in attenuated strains and/or absent in virulent strains. Taken together, the functionally defined PA14 genes required for C. elegans
kill-Chromosomal rearrangement in PAO1 repositions the replication terminus relative to the origin
Figure 2 (see following page)
Chromosomal rearrangement in PAO1 repositions the replication terminus relative to the origin. (a) Schematic of PAO1 and PA14 chromosomes. The region with the same orientation in both strains is shown with a thick red line; a thin blue line represents the inverted region. Arrows represent the positions and orientations of the four ribosomal RNA clusters. PCR products designed with unique sequences flanking each rRNA cluster are indicated by numbers next to each arrow. PCR products 1 and 2 (purple numbers) are diagnostic for the PAO1 chromosome structure; PCR products 3 and 4 (black numbers) are diagnostic for the PA14 chromosome structure. The position of the presumptive terminus of replication in each strain is indicated by an orange triangle marked with the corresponding position along the chromosome (expressed as the percentage of the whole chromosome, starting from the origin of replication and moving in a clockwise direction). (b) Diagnostic long-range PCR spanning each ribosomal RNA repeat demonstrates the inversion in PAO1. PCR products corresponding to the numbers indicated in panel a were generated using genomic DNA from PAO1 (left panel) or PA14 (right panel). PCR products 1 and 2 were obtained only when using PAO1 genomic DNA (the weak background band for product 1 seen using PA14 as a template was also observed for 18 additional P. aeruginosa strains tested). PCR products 3 and 4 were obtained only when using PA14 genomic DNA. PCR products 5 and 6 were obtained from both strains. (c) GC skew analysis was performed using 1 kb windows, and the cumulative GC skew is shown on the y-axis as a function of chromosomal location (x-axis) for PA14 (black line) and PAO1 (purple line). The position of the peak indicates the likely position of the terminus of replication. For PA14 the peak is centered in the middle of the chromosome (at 49.2% of the genome, between coordinates 3,219,001 and 3,220,000), whereas the peak for PAO1 is offset with respect to the origin of replication as a result of the inversion (occurring at 38.8% of the genome, between coordinates 2,428,001 and 2,429,000). PCR, polymerase chain reaction.
ing are neither required for nor necessarily predictive of another strain's ability to be pathogenic.
Conclusion
In this study we combined a traditional comparative genomic analysis with functional analyses, including genomotyping of other isolates, use of a genome-wide mutant library, and a model host infection system amenable to high-throughput
screens, to ascertain the relationship between genomic con-tent and virulence. We have found that PA14 and PAO1 are remarkably similar in total content and are largely colinear (with the exception of a previously described inversion). Because PA14 is significantly more virulent than PAO1 in most hosts, and previous studies have identified PA14 patho-genicity genes in regions that are absent in PAO1, we extended these observations to examine all of the PA14-spe-cific genes for potential contributions to virulence. We began
ORF-by-ORF alignments of PA14 and PAO1
Figure 3
ORF-by-ORF alignments of PA14 and PAO1. Each predicted ORF in PA14 was compared using BLAST with all annotated PAO1 ORFs, and the best match was indicated as a single data point with the chromosomal locations of the match in each genome. Reciprocal BLAST searches were also performed (using individual PAO1 ORFs against the complete set of PA14 ORFs). Matches in the forward direction are indicated by red diamonds, and matches in the reverse orientation are indicated by blue diamonds. Genes that fall outside of the diagonals (non-colinear genes) are a combination of translocations and gene pairs in which a true ortholog is missing in one strain but a similar gene exists elsewhere in its genome and the two genes have been selected as reciprocal best BLAST matches. Genes in one genome that fail to have a BLAST match counterpart in the other genome are represented on the x-axis for PA14-specific genes (green diamonds) and on the y-axis for PAO1-specific genes (pink diamonds). The GC contents for each genome are represented next to the two axes using a light-blue graph; the positions that correspond to GC contents of 30%, 50%, and 70% are indicated. BLAST, basic local alignment search tool; ORF, open reading frame.
Forward matches Reverse matches PA14 specific PAO1 specific 0 1000000 2000000 3000000 4000000 5000000 6000000 0 0.3 0.5 0.7 1000000 2000000 3000000 4000000 5000000 6000000 0.3 0.5 0.7
PA14
PA
O
1
comm en t re v ie w s re ports refer e e d re sear ch de p o si te d r e se a rch interacti o ns inf o rmation
by examining 18 additional diverse isolates to assess the con-servation of PA14-specific genes in other strains and whether they correlated with pathogenicity. In general, there was no obvious relationship between the presence of PA14-specific or PAO1-specific genes in other isolates and their virulence in C. elegans or the source of the strain. A specific examination of genes in these PA14-specific regions that were experimentally shown to contribute to virulence also failed to show a strong correlation between the presence of these genes and the path-ogenicity of other isolates.
Our results amend the general view of pathogenicity islands, in which the acquisition of an island leads to the addition of gene products whose contribution to virulence is apparent based on the known function of the virulence gene and does not depend (necessarily) on genes outside of the island. For example, an island may contain a complete complement of genes required for the synthesis of secreted toxins, adhesins,
invasion systems, iron uptake systems, or secretion systems (such as the type III and type IV systems) [1,2]. In these 'clas-sic' cases, the presence or absence of individual pathogenicity islands correlates directly with a given gene product or proc-ess known to be required for virulence (and, therefore, with overall virulence). P. aeruginosa strains contain genes that fall into this category; for example, the presence of a patho-genicity island containing the type III secretion effector ExoU (present on PA14 region PA14R72) makes strains more cyto-toxic to mammalian cells [27] and is required for pathogenic-ity in Galleria and the amoeba Dictyostelium discoideum [16,28]. However, we have also identified PA14 pathogenic-ity-related genes whose presence or absence does not corre-late directly with degree of virulence, suggesting that these genes do not function autonomously to affect virulence. Our genomic analysis of PA14 virulence has demonstrated that pathogenicity in this organism is both multifactorial and combinatorial. Within a given isolate, virulence is multifacto-rial in that several factors combine to result in an overall vir-ulence phenotype. Additionally, when comparing different strains, virulence is combinatorial in that pathogenicity fac-tors may behave differently and that distinct combinations or
Figure 4 (a) PA14 PAO1 PAK (lab) CF5 (CF) CF18 (CF) E2 (env) JJ692 (UTI) S35004 (blood) U2504 (UTI) UDL (UTI) 62 (env)
OP50 (E. coli)
S54485 (UTI) X13273 (blood) 6077 (occular) MSH3 (env) MSH10 (env) CF127 (CF) X24509 (UTI)19660 (occular) 0.0 0.2 0.4 0.6 0.8 1.0 0 50 100 150 200 250 300 350 Fr ac ti o n C. E le g a n s s u rviving
Hours p ost infection
(b)
Virulence: 2 5 5 1 7 16 11 3 20 17 13 18 10 6 12 10 10 16 19 16 Source:
burn env env CF env UTI wound UTI
CF env lab CF eye UTI UTI UTI blood CF blood eye
Strain:
PA14 MSH3 MSH10 CF18 62 X24509 PAO1 UDL CF5 E2 PAK CF27 6077 U2504 JJ692 S54485 X13273 CF127 S35004 19660
(c) 1 2 3 4 5 6 7 8 9 10 11 12 13 1415 16171819 20 6 6(0.44)(0.44) 7 7(0.44)(0.44) R78 R78 1 1(0.02)(0.02) R09 R09 4,5 4,5(0.63)(0.63) R41 R41
Poor correlation between PA14-pathogenicity genes and virulence in other strains
Figure 4
Poor correlation between PA14-pathogenicity genes and virulence in other strains. (a) C. elegans survival curves in the presence of 19 P. aeruginosa strains and OP50 (an E. coli control). The names of each strain tested are sorted according to the rank order of virulence, from most virulent at the top to the least virulent at the bottom, as determined by examining the time required to kill 50% of the nematodes. Black brackets indicate strains with indistinguishable virulence. Strain names are followed by the strain source and color-coded by strain source, as shown in panel b. Strain CF27 is not shown in this dataset; however, a similar experiment places its rank order virulence between strains E2 and S36004 (indicated by a black arrow). The same relative rank orders were obtained in two additional experiments. (b) Dendrogram representing the relatedness of 20 P. aeruginosa strains based on the presence or absence of genes as assayed by genomic DNA hybridizations to a custom microarray. Hierarchical clustering analysis was performed using the city-block distance metric. The name of each strain is shown, along with the source of the strain (UTI, urinary tract infection; CF, cystic fibrosis respiratory infection; env, environmental isolate), and the rank order virulence of each strain as determined in panel a (1, most virulent; 20, least virulent). Strains with indistinguishable virulence were given a tied rank order (also see Table 2). (c) Presence or absence of PA14 virulence genes in additional isolates. Data for each strain tested is presented in columns. Strains are arranged in order from left to right in order of decreasing virulence, in the same order as shown in panel a; column headers refer to the 20 strain numbers used in Table 2. Columns with no gaps between them represent groups of strains with indistinguishable virulence (strains 4 and 5; strains 8, 9 and 10; and strains 14, 15 and 16). Genes assayed are represented as rows, with adjacent rows representing ORFs present within a given gene cluster (PA14 region names shown on the left are abbreviated to remove the 'PA14' prefix). Each gene is described as present (blue), absent (yellow), or indeterminate (red). The positions of mutations resulting in reduced virulence in PA14 are indicated by lines to the right; numbers in black refer to entries in Table 3, and red numbers in parenthesis indicate the Spearman's rank correlation coefficients between presence or absence of the gene in other strains and their rank order virulence ratings.
groupings of these determinants may result in comparable virulence phenotypes.
What might account for the apparent complexity of PA14-specific virulence factors with respect to their conservation and role in other strains? First, it is clear that our analysis of genomic content in other strains is only an initial step in addressing similarities or differences in gene function among isolates; the apparent absence of a gene cannot exclude the existence of a functionally similar gene with significant sequence divergence, and the apparent presence of a gene cannot determine whether a gene is expressed. Transcrip-tional profiling of strain-specific genes (particularly in the presence of a putative host) will be a critical next step in clar-ifying the genes that contribute to virulence. Additional sequence information from other strains will be required to determine whether other functionally similar genes exist or whether orthologous genes are likely to be fully functional (intact ORFs with no polymorphisms that might alter protein function). Second, given the multifactorial and combinatorial nature of P. aeruginosa virulence, a full understanding of pathogenicity will require elucidation of how strain-specific genes (potentially responsible for differences in severity of disease among isolates) interact with core genome genes required for a base level of virulence. Our laboratory is cur-rently extending the screen for PA14 mutants attenuated in C.
elegans killing beyond the PA14-specific genes to include the entire genome (Liberati NT, Feinbaum RL, Ausubel FM, unpublished observations). Third, an important future direc-tion will be to determine how generalizable our observadirec-tions are in other model hosts. We are currently conducting pilot experiments to assess the viability of screening both the set of 20 P. aeruginosa strains and the PA14 mutant library in insects and plants to determine whether the presence or absence of identified PA14 virulence genes in other isolates correlates with their overall pathogenicity. A thorough under-standing of networks of genes that are necessary for virulence in many or the majority of P. aeruginosa isolates (as opposed to genes that contribute to pathogenicity only in a subset of strains in which they are present) will be crucial for the design of effective therapeutics to combat the wide variety of human infections observed in clinical settings.
The evolution of virulence for a dedicated human pathogen generally involves the acquisition of discrete virulence func-tions required for specific interacfunc-tions with the host, followed by gene loss related to specialization and potential restriction to the new environmental niche. In contrast, ubiquitous envi-ronmental micro-organisms continuously encounter dra-matic changes in their ecosystem and the maintenance of genome complexity is preferable to optimization for a single niche. For environmental pathogenic fungi such as
Crypto-Relative virulence of P. aeruginosa strains in C. elegans
Strain numbera Strain name Strain sourceb Rank order of virulence in C. elegansc
1 CF18 CF 1 2 PA14 burn 2 3 UDL UTI 3 4 MSH3 Environmental 5 5 MSH10 Environmental 5 6 U2504 UTI 6 7 62 Environmental 7 8 6077 Ocular 10 9 S54485 UTI 10 10 X13273 Blood 10 11 PAO1 Wound 11 12 JJ692 UTI 12 13 PAK Laboratory 13 14 19660 Ocular 16 15 X24509 UTI 16 16 CF127 CF 16 17 E2 Environmental 17 18 CF27 CF 18d 19 S35004 Blood 19 20 CF5 CF 20
aThis strain number corresponds to the order in which strains are listed in Figure 4c (microarray) from left to right. bReferences for each strain are listed in the report by Wolfgang and coworkers [9]. cIdentical rank orders are shown for two or more strains with indistinguishable virulence. dStrain CF27 is not included in Figure 4a; its relative order is inferred based on other experiments. CF, cystic fibrosis; UTI, urinary tract infection.
comm en t re v ie w s re ports refer e e d re sear ch de p o si te d r e se a rch interacti o ns inf o rmation
coccus neoformans that do not require animal hosts for rep-lication or survival, the phenomenon of 'ready made' virulence has been described in which the selection and main-tenance of virulence factors occurs during infection of envi-ronmental predators such as nematodes and ameba [29-31]. We propose that this multi-host view of pathogenic evolution also applies to environmental bacteria such as P. aeruginosa that infects nematodes, insects, plants, and ameba in the lab-oratory and probably encounter a similar range of potential hosts in the wild. The recent discovery that C. elegans pre-exposed to PA14 can modify its olfactory preferences to avoid the pathogen, and that this 'learned' avoidance behavior does not occur with nonpathogenic mutants of PA14, suggests that an interaction between these two organisms is biologically relevant [32]. Therefore, selection for pathogenicity may occur constantly in the environment; indeed, among the 20 isolates surveyed in this study, two environmental strains (MSH3 and MSH10) were among the most virulent, demon-strating that pathogenic potential exists even in nonclinical isolates. Furthermore, as an environmental organism, P. aer-uginosa is not likely to undergo genome reduction associated with host restriction as in dedicated human pathogens. A notable exception is the case of CF infections, in which a clonal population remains isolated in a defined environment over a long period of time and tends not to spread to other patients. Indeed, a recent comparison of an early and late CF isolate from the same patient (at 6 months and 8 years of age) revealed an accumulation of multiple mutations leading to gene inactivation or loss, including a large 188 kb deletion [33]. When these mutated genes were examined in early and
late infections of 29 additional CF patients, most of the observed mutations arose relatively late in the infections. Our laboratory and others have previously shown that aspects of PA14 pathogenicity are conserved in model hosts and in mammalian hosts; PA14 virulence factors have been shown to be required for disease in both model hosts and mammals [13,14,16,17,19,28,34], and components of the host defense response are conserved in model hosts and humans [34-36]. Although these observations are critical in validating the use of simple, genetically tractable organisms as surrogate hosts to study human disease, perhaps the more appropriate per-spective is to view nematodes, insects, plants, and ameba as the relevant natural hosts in which the selection for and evo-lution of pathogenic traits occurs, and the ability to subse-quently infect humans is a secondary effect of these interactions.
Materials and methods
Shotgun genome sequencing
Shotgun sequencing of PA14 was performed using 65,800 plasmids containing 2-4 kb fragments of genomic PA14 DNA, resulting in over 10-fold coverage. Sequence reads were assembled using the Phred, Phrap, and Consed tools [37-39]. Details of finishing methods are described in Additional data file 1.
A long-range PCR-based method was used to assess whether particular P. aeruginosa genomes contain a PA14-like or a
Table 3
PA14-specific regions containing genes required for C. elegans killing
PA14 region ID Number of genes in region GC contenta
PA14 gene ID Previously assigned gene name
Gene function Correlation coefficient of gene with rank order of virulence
Position of gene in Figure 4c
PA14R09 14 58.5 PA14_03370b Unknown 0.02 1
PA14R38 12 46.4 PA14_23420b ORF_10 O-antigen
biosynthesis
2c
PA14_23430 ORF_11 O-antigen
biosynthesis
3c
PA14R41 8 66 PA14_27680b C118 Unknown 0.63 4
PA14_27700b C120 Putative
transcriptional regulator
0.63 5
PA14R77 3 53.9 PA14_58760 pilC Type 4 fimbrial
biogenesis
Not on oligo arrayc
PA14R78 112 59.7 PA14_59010b RL107 Unknown 0.44 6
PA14_59070 RL102 Unknown 0.44 7
PA14R79 2 54.9 PA14_60290b pilW Type 4 fimbrial
biogenesis
Not on oligo arrayc aGC content of the PA14 genome is 66.3 ± 4.3%. bThese mutants were grown on minimal media and all had wild-type growth curves. cThese gene clusters are present in all P. aeruginosa isolates, but the sequences are highly divergent. Oligos for the PA14-specific O-antigen cluster were included on the array, but none of the other strains contained the PA14-version of these genes. The two clusters involved in type 4 fimbrial biogenesis were not included on the array because the sequences were not sufficiently different to pass our criteria for oligo design (see Materials and methods).
most distant copies of a large ribosomal RNA cluster (Figures 1 and 2a,b; also see Stover and coworkers [7]). Primer pairs used to amplify two products specific for the PA14 chromo-somal arrangement are as follows: 807.LL_rev (CGAACT-GGAGGAAGTCTTCG) + 2-5'_2 (CGAGGCTTTCGTCTATCCAG), and 837.LL (AACTGGT-GGAGGGAGAAGGAT) + 803.RR.rev (TAGCCTTCAATTC-CACCTGG). Primer combinations used to amplify two PAO1-specific products are as follows: 807.LL_rev + 803.RR.rev, and 837.LL + 2-5'_2. These diagnostic primer pairs were also used to survey 18 additional strains (Table 2) to determine whether the PA14 or the PAO1 orientation was more repre-sentative of the ancestral P. aeruginosa chromosome. Of the 18 strains tested, none generated a PAO1-specific amplifica-tion product. Using the primers for the PA14 arrangement, seven of the 18 strains yielded products with both primer pairs, nine of 18 had a strong PCR product with one of the two primer pairs and a weak product with the second primer pair, and two of 18 exhibited a weak product with one primer pair and no product with the second.
Sequence analysis and gene annotation
In determining GC content for PA14 and PAO1, standard deviations were determined using a continuous sliding win-dow of 1 kb, and comparing the GC content for these regions with that of the whole genome. GC skew analysis was per-formed (using the formula GC skew = [n(G) - n(C)]/[n(G) + n(C)], where n [i] is the number of nucleotides, applied to 1 kb segments of each genome) to identify the peak cumulative GC skew as the likely position of the replication terminus [3]. Global alignments of the PA14 and PAO1 genomes were per-formed using the MUMmer 3.0 software package [40] to identify strain-specific regions. Automated ORF predictions were made using a combination of the BLAST and Glimmer2 algorithms [41,42]. Each predicted ORF was assigned a PA14 LocusName, beginning with 'PA14_' followed by five numer-als. ORFs were numbered starting with PA14_00010 (dnaA), increasing in increments of 10 to allow for future insertions of additional genes or functional RNAs. Further details of ORF prediction and annotation are provided in Additional data file 1.
Microarray genomotyping of P. aeruginosa strains 70-mer oligonucleotides for microarrays were designed as described previously [43] for 285 PA14-specific sequences, 130 PAO1-specific sequences, 11 genes common to both strains (to serve as positive controls), and additional genes and negative controls (see Additional data file 1). Chromo-somal DNA from PA14, PAO1 (the sequenced isolate), and 18 additional P. aeruginosa strains described previously [9] was digested with HaeIII and labeled with 3 or Cyanine-5 using the MICROMAX ASAP labeling kit (part #MPS544001KT; PerkinElmer, Wellesley, MA, USA). Labeled samples were combined in random pairs and hybrid-ized to the arrays. Observed intensities for replicate
hybridi-computed to determine the presence/absence of each gene based on a cut-off determined independently for each sample (see Additional data file 1). For each gene, a Spearman's rank correlation coefficient was calculated to describe the relation-ship between the spectrum of present/absent calls and the determined rank order virulence in C. elegans (see below). Heirarchical clustering analysis of strain relationships was performed using Cluster 3.0 [44] and Java Treeview [45]. All microarray data are included in Additional data files 5 and 6 and have also been deposited in ArrayExpress (ArrayExpress E-MEXP-824).
C. elegans pathogenicity assays
The 20 P. aeruginosa strains analyzed by genomotyping were cultured overnight in Luria broth (LB) and assayed in the C. elegans killing system as described previously [13], with the exception that assays were performed using fer-15(b26)ts;fem-1(hc17) temperature-sensitive sterile mutant nematodes. The assays were carried out at the restrictive tem-perature (25°C) to prevent progeny formation and to allow the experiments to continue long enough to examine less pathogenic strains (for which progeny would typically over-whelm the assay plate by the end of the experiment). Bacterial strains are rank ordered from most to least virulent based on
the position of the LT50 (the time at which 50% lethality was
observed) in Figure 4a. In cases in which the LT50 was
over-lapping, rank orders were represented as a tied value for the strains in question. Strain CF27 is not included in the data shown in Figure 4a; however, its rank order in a similar experiment places it between strains E2 and S35004. The rel-ative rank orders shown in Figure 4a are consistent with those observed in two additional experiments; although the
abso-lute LT50 values increased or decreased for given strains
between experiments, the relative rank orders remained con-sistent.
To screen for avirulent PA14 mutants, we utilized a nonre-dundant transposon insertion library [25]. All available mutants in PA14-specific genes (349 in total) were grown in 150 ml of LB media in 0.5 ml 96-well Masterblocks (part #786261; Greiner, Monroe, NC, USA). Cultures were agitated at 225 rpm and incubated for 16 hours at 37°C. A volume of 10 μl of each culture was spotted onto slow killing agar in 2 wells of a six-well plate [13,18], allowed to grow at 37°C for 24 hours, and left at room temperature for an additional 24 hours. Five L4 stage N2 nematodes were transferred manu-ally to each well, and the number and age of progeny were recorded after 4 days at 25°C. The 349 mutants in PA14-spe-cific genes were screened on two separate occasions, and any that were highly attenuated in either screen or were attenu-ated in both screens were re-examined in a secondary screen as described using wild-type N2 nematodes [13]. Six mutants were tested for growth in minimal (M63) media and all were found to have wild-type growth curves (Table 3). These
comm en t re v ie w s re ports refer e e d re sear ch de p o si te d r e se a rch interacti o ns inf o rmation
included four of the five mutants in PA14 genes completely absent in PAO1 (examined in Figure 4c).
Additional data files
The following additional data are available with the online version of this paper. Additional data file 1 is a document summarizing supplementary methods. Additional data file 2 is a table of PA14 gene annotations: the first worksheet con-tains the data, and the second worksheet concon-tains a detailed description of the contents of the table and serves as a legend for the first worksheet. Additional data file 3 is a table show-ing the percentage of PA14 and PAO1 genes correspondshow-ing to each of 28 functional categories (shown for both the whole genome and strain-specific genes as described in Additional data file 4): the first worksheet contains the data, and the sec-ond worksheet contains a detailed description of the contents of the table and serves as a legend for the first worksheet. Additional data file 4 is a table summarizing properties of PA14-specific and PAO1-specific regions: the first worksheet contains the data, and the second worksheet contains a detailed description of the contents of the table and serves as a legend for the first worksheet. Additional data file 5 is a table describing the properties of oligos found on the geno-typing microarray: the first worksheet contains the data, and the second worksheet contains a detailed description of the contents of the table and serves as a legend for the first work-sheet. Additional data file 6 is a table of the microarray geno-typing data for the 20 strains examined in this study (normalized average data and log2 ratio of normalized aver-ages): the first worksheet contains the data, and the second worksheet contains a detailed description of the contents of the table and serves as a legend for the first worksheet. Addi-tional data file 7 contains the coordinates of regions in PA14 or PAO1 that are common to four sequenced P. aeruginosa strains (PA14, PAO1, and two CF isolates: 2192 and C3719) and therefore comprise a putative P. aeruginosa core genome: the first worksheet contains the data, and the second worksheet contains a detailed description of the contents of the table and serves as a legend for the first worksheet.
Additional data file 1
Summary of supplementary methods Summary of supplementary methods. Click here for file
Additional data file 2 PA14 gene annotations
A table of PA14 gene annotations. Click here for file
Additional data file 3
The percentage of PA14 and PAO1 genes corresponding to each of 28 functional categories (shown for both the whole genome and strain-specific genes as described in Additional data file 4) The percentage of PA14 and PAO1 genes corresponding to each of 28 functional categories (shown for both the whole genome and strain-specific genes as described in Additional data file 4). Click here for file
Additional data file 4
Summary of properties of PA14-specific and PAO1-specific regions Summary of properties of PA14-specific and PAO1-specific regions. Click here for file
Additional data file 5
Properties of oligos found on the genotyping microarray Properties of oligos found on the genotyping microarray. Click here for file
Additional data file 6
Microarray genotyping data for the 20 strains examined in this study (normalized average data and log2 ratio of normalized aver-ages)
Microarray genotyping data for the 20 strains examined in this study (normalized average data and log2 ratio of normalized aver-ages).
Click here for file Additional data file 7
Coordinates of regions in PA14 or PAO1 that are common to four sequenced P. aeruginosa strains (PA14, PAO1, and two CF isolates: 2192 and C3719) and therefore comprise a putative P. aeruginosa core genome
Coordinates of regions in PA14 or PAO1 that are common to four sequenced P. aeruginosa strains (PA14, PAO1, and two CF isolates: 2192 and C3719) and therefore comprise a putative P. aeruginosa core genome.
Click here for file
Authors' contributions
DGL and FMA were responsible for strategic planning and managing the overall project. LL, GG, KM, and RK were responsible for overseeing the raw sequencing, finishing, and initial assembly of PA14. DGL, NTL, SM, JH, and MS contrib-uted to the raw sequencing effort. DGL performed manual edits to the assembly and additional finishing reactions. JMU and GW developed bioinformatic tools to analyze the sequence data. JMU, GW, and DGL performed the bulk of the bioinformatic analyses. DGL, JMU, LTD, NTL, JH, ED, and LF contributed to the manual annotation of PA14 genes. DGL designed the oligonucleotide array, performed the microarray experiments, and DGL and JMU analyzed the microarray
data. NTL and RF performed the C. elegans assays. DGL and FMA wrote the paper. All authors discussed the results and commented on the manuscript.
Acknowledgements
We thank J Decker, W Brown, K Osborn, A Perera, R Elliott, and L Gendal for technical assistance during the sequencing of PA14; R Jackson for sug-gestions on genomic DNA preparations for microarray analysis; N El Mas-sadi and J Frietas for suggestions on sample labelling, hybridizations, and scanning for microarray experiments; D Park for assistance with microar-ray data analysis; and E Mylonakis for discussions regarding the evolution of fungal pathogens. We especially acknowledge S Lory for encouragement and for many helpful discussions and suggestions. This work was funded by grants to FMA from the National Institutes of Health (Grant Numbers U01 HL66678 and R01 AI064332) and the Department of Energy (Grant Number DE-FG02-ER63445), a postdoctoral fellowship from the Jane Cof-fin Childs Memorial fund for Medical Research to DGL, and by support from the Harvard-Partners Center for Genetics and Genomics.
References
1. Hacker J, Blum-Oehler G, Muhldorfer I, Tschape H: Pathogenicity islands of virulent bacteria: structure, function and impact on microbial evolution. Mol Microbiol 1997, 23:1089-1097. 2. Oelschlaeger TA, Hacker J: Impact of pathogenicity islands in
bacterial diagnostics. Apmis 2004, 112:930-936.
3. Bentley SD, Parkhill J: Comparative genomic structure of prokaryotes. Annu Rev Genet 2004, 38:771-792.
4. Ochman H, Davalos LM: The nature and dynamics of bacterial genomes. Science 2006, 311:1730-1733.
5. Doring D: Chronic Pseudomonas aeruginosa lung infection in cystic fibrosis patients. In Pseudomonas aeruginosa as an opportun-istic pathogen New York: Plenum Press; 1993:245-273.
6. Wood RE: Pseudomonas: the compromised host. Hosp Pract 1976, 11:91-100.
7. Stover CK, Pham XQ, Erwin AL, Mizoguchi SD, Warrener P, Hickey MJ, Brinkman FS, Hufnagle WO, Kowalik DJ, Lagrou M, et al.: Com-plete genome sequence of Pseudomonas aeruginosa PA01, an opportunistic pathogen. Nature 2000, 406:959-964.
8. Ernst RK, D'Argenio DA, Ichikawa JK, Bangera MG, Selgrade S, Burns JL, Hiatt P, McCoy K, Brittnacher M, Kas A, et al.: Genome mosai-cism is conserved but not unique in Pseudomonas aeruginosa isolates from the airways of young children with cystic fibro-sis. Environ Microbiol 2003, 5:1341-1349.
9. Wolfgang MC, Kulasekara BR, Liang X, Boyd D, Wu K, Yang Q, Miy-ada CG, Lory S: Conservation of genome content and viru-lence determinants among clinical and environmental isolates of Pseudomonas aeruginosa. Proc Natl Acad Sci USA 2003, 100:8484-8489.
10. Spencer DH, Kas A, Smith EE, Raymond CK, Sims EH, Hastings M, Burns JL, Kaul R, Olson MV: Whole-genome sequence variation among multiple isolates of Pseudomonas aeruginosa. J Bacteriol 2003, 185:1316-1325.
11. Choi JY, Sifri CD, Goumnerov BC, Rahme LG, Ausubel FM, Calder-wood SB: Identification of virulence genes in a pathogenic strain of Pseudomonas aeruginosa by representational differ-ence analysis. J Bacteriol 2002, 184:952-961.
12. Rahme LG, Stevens EJ, Wolfort SF, Shao J, Tompkins RG, Ausubel FM: Common virulence factors for bacterial pathogenicity in plants and animals. Science 1995, 268:1899-1902.
13. Tan MW, Mahajan-Miklos S, Ausubel FM: Killing of Caenorhabditis elegans by Pseudomonas aeruginosa used to model mamma-lian bacterial pathogenesis. Proc Natl Acad Sci USA 1999, 96:715-720.
14. Jander G, Rahme LG, Ausubel FM: Positive correlation between virulence of Pseudomonas aeruginosa mutants in mice and insects. J Bacteriol 2000, 182:3843-3845.
15. Mahajan-Miklos S, Tan MW, Rahme LG, Ausubel FM: Molecular mechanisms of bacterial virulence elucidated using a Pseu-domonas aeruginosa-Caenorhabditis elegans pathogenesis model. Cell 1999, 96:47-56.
16. Miyata S, Casey M, Frank DW, Ausubel FM, Drenkard E: Use of the Galleria mellonella caterpillar as a model host to study the
nosa pathogenesis. Infect Immun 2003, 71:2404-2413.
17. Rahme LG, Tan MW, Le L, Wong SM, Tompkins RG, Calderwood SB, Ausubel FM: Use of model plant hosts to identify Pseudomonas aeruginosa virulence factors. Proc Natl Acad Sci USA 1997, 94:13245-13250.
18. Tan MW, Rahme LG, Sternberg JA, Tompkins RG, Ausubel FM: Pseu-domonas aeruginosa killing of Caenorhabditis elegans used to identify P. aeruginosa virulence factors. Proc Natl Acad Sci USA 1999, 96:2408-2413.
19. He J, Baldini RL, Deziel E, Saucier M, Zhang Q, Liberati NT, Lee D, Urbach J, Goodman HM, Rahme LG: The broad host range path-ogen Pseudomonas aeruginosa strain PA14 carries two patho-genicity islands harboring plant and animal virulence genes. Proc Natl Acad Sci USA 2004, 101:2530-2535.
20. PA14 Gene Annotations [http://ausubellab.mgh.harvard.edu/cgi-bin/pa14/annotation/start.cgi]
21. Huang B, Whitchurch CB, Croft L, Beatson SA, Mattick JS: A mini-mal tiling path cosmid library for functional analysis of the Pseudomonas aeruginosa PAO1 genome. Microb Comp Genomics 2000, 5:189-203.
22. Pseudomonas Genome Project and PseudoCAP [http:// www.pseudomonas.com/]
23. Kim CC, Joyce EA, Chan K, Falkow S: Improved analytical meth-ods for microarray-based genome-composition analysis. Genome Biol 2002, 3:RESEARCH0065.
24. PA14 Transposon Insertion Mutant Library [http://ausubel lab.mgh.harvard.edu/cgi-bin/pa14/home.cgi]
25. Liberati NT, Urbach JM, Miyata S, Lee DG, Drenkard E, Wu G, Vil-lanueva J, Wei T, Ausubel FM: An ordered, nonredundant library of Pseudomonas aeruginosa strain PA14 transposon insertion mutants. Proc Natl Acad Sci USA 2006, 103:2833-2838.
26. Romling U, Kader A, Sriramulu DD, Simm R, Kronvall G: World-wide distribution of Pseudomonas aeruginosa clone C strains in the aquatic environment and cystic fibrosis patients. Envi-ron Microbiol 2005, 7:1029-1038.
27. Sato H, Frank DW: ExoU is a potent intracellular phospholi-pase. Mol Microbiol 2004, 53:1279-1290.
28. Pukatzki S, Kessin RH, Mekalanos JJ: The human pathogen Pseu-domonas aeruginosa utilizes conserved virulence pathways to infect the social amoeba Dictyostelium discoideum. Proc Natl Acad Sci USA 2002, 99:3159-3164.
29. Casadevall A, Steenbergen JN, Nosanchuk JD: 'Ready made' viru-lence and 'dual use' viruviru-lence factors in pathogenic environ-mental fungi: the Cryptococcus neoformans paradigm. Curr Opin Microbiol 2003, 6:332-337.
30. Levitz SM: Does amoeboid reasoning explain the evolution and maintenance of virulence factors in Cryptococcus neofor-mans? Proc Natl Acad Sci USA 2001, 98:14760-14762.
31. Steenbergen JN, Casadevall A: The origin and maintenance of virulence for the human pathogenic fungus Cryptococcus neoformans. Microbes Infect 2003, 5:667-675.
32. Zhang Y, Lu H, Bargmann CI: Pathogenic bacteria induce aver-sive olfactory learning in Caenorhabditis elegans. Nature 2005, 438:179-184.
33. Smith EE, Buckley DG, Wu Z, Saenphimmachak C, Hoffman LR, D'Argenio DA, Miller SI, Ramsey BW, Speert DP, Moskowitz SM, et al.: From the cover: genetic adaptation by Pseudomonas aeru-ginosa to the airways of cystic fibrosis patients. Proc Natl Acad Sci USA 2006, 103:8487-8492.
34. Lau GW, Goumnerov BC, Walendziewicz CL, Hewitson J, Xiao W, Mahajan-Miklos S, Tompkins RG, Perkins LA, Rahme LG: The Dro-sophila melanogaster toll pathway participates in resistance to infection by the gram-negative human pathogen Pseu-domonas aeruginosa. Infect Immun 2003, 71:4059-4066.
35. Kim DH, Feinbaum R, Alloing G, Emerson FE, Garsin DA, Inoue H, Tanaka-Hino M, Hisamoto N, Matsumoto K, Tan MW, et al.: A con-served p38 MAP kinase pathway in Caenorhabditis elegans innate immunity. Science 2002, 297:623-626.
36. Liberati NT, Fitzgerald KA, Kim DH, Feinbaum R, Golenbock DT, Ausubel FM: Requirement for a conserved Toll/interleukin-1 resistance domain protein in the Caenorhabditis elegans immune response. Proc Natl Acad Sci USA 2004, 101:6593-6598. 37. Gordon D, Abajian C, Green P: Consed: a graphical tool for
sequence finishing. Genome Res 1998, 8:195-202.
38. Gordon D, Desmarais C, Green P: Automated finishing with autofinish. Genome Res 2001, 11:614-625.
39. Phred, Phrap, and Consed [http://www.phrap.org/phredphrap
40. Kurtz S, Phillippy A, Delcher AL, Smoot M, Shumway M, Antonescu C, Salzberg SL: Versatile and open software for comparing large genomes. Genome Biol 2004, 5:R12.
41. Delcher AL, Harmon D, Kasif S, White O, Salzberg SL: Improved microbial gene identification with GLIMMER. Nucleic Acids Res 1999, 27:4636-4641.
42. Salzberg SL, Delcher AL, Kasif S, White O: Microbial gene identi-fication using interpolated Markov models. Nucleic Acids Res 1998, 26:544-548.
43. Wang X, Seed B: Selection of oligonucleotide probes for pro-tein coding sequences. Bioinformatics 2003, 19:796-802. 44. Open Source Clustering Software
[http://bonsai.ims.u-tokyo.ac.jp/~mdehoon/software/cluster/software.htm#ctv]
45. Saldanha AJ: Java Treeview: extensible visualization of micro-array data. Bioinformatics 2004, 20:3246-3248.
46. Broad Institute Pseudomonas aeruginosa Database [http:// www.broad.mit.edu/annotation/microbes/
pseudomonas_aeruginosa_c3719/]
47. Genomic DNA Labelling Protocol_Version B [http://derisi lab.ucsf.edu/pdfs/GenomicDNALabel_B.pdf]