HAL Id: hal-02371215
https://hal.archives-ouvertes.fr/hal-02371215
Submitted on 19 Nov 2019
HAL is a multi-disciplinary open access
archive for the deposit and dissemination of
sci-entific research documents, whether they are
pub-lished or not. The documents may come from
teaching and research institutions in France or
abroad, or from public or private research centers.
L’archive ouverte pluridisciplinaire HAL, est
destinée au dépôt et à la diffusion de documents
scientifiques de niveau recherche, publiés ou non,
émanant des établissements d’enseignement et de
recherche français ou étrangers, des laboratoires
publics ou privés.
Towards a High-Level Description for Generating
Stream Processing Benchmark Applications
Alessio Pagliari, Fabrice Huet, Guillaume Urvoy-Keller
To cite this version:
Alessio Pagliari, Fabrice Huet, Guillaume Urvoy-Keller. Towards a High-Level Description for
Gen-erating Stream Processing Benchmark Applications. The Third IEEE International Workshop on
Benchmarking, Performance Tuning and Optimization for Big Data Applications (BPOD 2019), Dec
2019, Los Angeles, United States. �hal-02371215�
Towards a High-Level Description for Generating
Stream Processing Benchmark Applications
Alessio Pagliari, Fabrice Huet, Guillaume Urvoy-Keller
Universite Cote d’Azur, CNRS, I3S
{alessio.pagliari, fabrice.huet, guillaume.urvoy-keller}@univ-cotedazur.fr
Abstract—The relevance of Data Stream Processing (DSP) is nowadays established, thanks to its capability to analyze contin-uous streams and provide statistics in real-time. A considerable amount of work has been dedicated to improve performance and features of DSP platforms. Thus, benchmark application are necessary for comparison and evaluation. Unfortunately, in literature, these applications are often briefly described, the source is not available, they are too context-specific or don’t provide enough flexibility. That makes it difficult for a developer to quickly evaluate the impact of some design choices.
To address these issues, we introduce a high-level description model of stream applications. Based on fundamental DSP char-acteristics, this description allow an easy and flexible definition of benchmark topologies. With this model we aim to provide easily replicable, comparable and customizable benchmarks for DSP. We then use a framework prototype that translates the high-level description into platform-specific code simulating the application workload.
Index Terms—Benchmark Application, Data Stream Process-ing, High-Level description
I. INTRODUCTION
Streaming analytics is a top trend in the Big Data field. The ability to process high-rate unbounded data, giving output results in almost real-time, makes it the best technique for many fields, such as IoT, security or social networks. The continuous and significant amount of data generated by these applications need to be quickly and correctly processed, as, in most cases, those critical applications need to provide immediate feedback.
Therefore, many platforms have been developed to manage and process data streams, from open-source data stream pro-cessing systems (DSPS) as Flink[1], Storm[2], Heron[3] or the Spark Streaming[4] extension (all under the Apache project), to industrial solutions as Google Millwheel[5]. Several works have been done to improve these systems, from scheduling algorithms to deep architectural renewal. The different plat-forms and their enhancements need to be evaluated to prove their efficacy.
This is the goal of benchmark applications. Nevertheless, none of the state-of-the-art solutions (as we will detail in Section II) proposes a general approach that could be used for every kind of evaluation, context or platform. Most of the available benchmark suites are designed for a single specific context (e.g. IoT, social networks), making them less relevant in others. Moreover, these applications are usually not designed with flexibility in mind. Even some slight change in their behavior requires modification of the source code.
Finally, the lack of space in most publications forces to leave out important information, making it difficult to reproduce experiments.
Thus, we feel the necessity to have a reference solution that could be flexible and configurable while being context-and platform-agnostic. It should cover the fundamental char-acteristics of a DSP application, including a description of its workload.
In this paper, we present an high-level description to model benchmark applications, which we call Workflow schema. Based over fundamental data stream characteristics, the schema supports easy and quickly configurable topology description.
We test the Workflow schema with the use of a framework able to automatically generate platform-specific code by trans-lating the high-level description.
Our contributions are as follows:
• We provide a detailed description and analysis of the
fundamental characteristics of typical DSP applications.
• We introduce a high-level model to precisely describe
each element of a DSP application, allowing a high degree of flexibility.
• We demonstrate the benefit of our model by generating
micro-benchmarks for Flink being able to quickly evalu-ate the impact of design choices.
II. RELATEDWORK
Peng et Al. [6] define three different base layouts for micro-benchmarks topologies (Fig. 1): linear, diamond and star. The first one consists of a pipeline of tasks without any branch split or join; the diamond shape usually starts and ends with a single task and has multiple tasks in parallel in-between; the star layout has multiple source and sink tasks, linked by a single task. The same layouts are implemented directly or indirectly by [7] (DDoS detection application) and [8].
A popular micro-benchmark application is the streaming version of WordCount [9], [10], [11]. It is usually available as example code in the main DSP systems such as Storm or Flink. While this topology may be considered as real use cases, they are normally implemented as examples and not derived from production code.
To evaluate the maximum achievable throughput, a source-sink topology is commonly used [9], [12], [13]. The same topology can be altered to test I/O performance [12], [13].
SOURCE TASK1 TASK2 TASK3
(a) Linear Layout
SOURCE TASK1 TASK2 TASK3 TASK4 (b) Diamond Layout SOURCE 1 TASK2 TASK1 TASK3 SOURCE 2 (c) Star Layout
Fig. 1: Micro-Benchmarks Topology Layouts
Overall, micro-benchmarks often lacks implementation details, missing the internal’s description. Thus, they don’t give a clear idea of what is the actual workload of the application. This makes it complicated to replicate a benchmark correctly. Other works uses more complex applications designed following real-scenarios implementations. A milestone of stream benchmarks is Linear Road [14]. The authors defines guidelines to implement an application that simulates a real scenario: an urban expressway system. The objective is to compare different platforms through the same application.
The currently most popular benchmark application is the Yahoo! Streaming Benchmark [15]. It has been widely used by companies to evaluate their solutions [16], [17], [18]. The application analyzes advertisement interactions on the Web.
In StreamBench [19], the authors define a set of workloads, characterizing them in terms of data type and computational complexity. A total of 7 benchmark applications are combined to two real-world data sets.
Similarly, BigDataBench [20] is a suite that makes available benchmark workloads for both batch and streaming BigData platforms. Their focus is on Internet services. JStorm[21] and Spark Streaming[4] are currently supported as streaming platforms.
RIoTBench [22] is a suite designed specifically for IoT sce-narios. The suite regroups a large set of IoT micro-benchmarks to cover different patterns. Together with a set of representative IoT applications, inspired by realistic scenarios.
These benchmark applications are commonly designed for context-specific scenarios. They consist of workloads built ad-hoc for a specific environment, which may not match to the user needs. They are limited by the static compositions of tasks, and by the platform-specific implementation. This lack of flexibility does not allow an easy customized workflow compositions or cross-platform benchmarks.
III. MOTIVATION ANDCHALLENGES
We just showed that the literature already provides us with a large variety of benchmark applications. However, we think that this past work presents various limitations. They are too context-specific. These benchmarking tools are commonly designed for specific scenarios such as IoT or internet services, limiting their applicability to other fields of study. Moreover,
they are implemented over a specific platform. It is thus necessary to rewrite the entire application to adapt it to other middlewares. They are often hard to replicate due to the lack of a specific workload description. Especially micro-benchmarks, as they usually define a general objective for the evaluation – e.g. I/O intensive, maximal throughput – but fail to provide a detailed definition of the tasks internals. At the same time, they are not flexible enough. An imprecise description of the pipeline and hard-coded configurations do not allow a quick and easy tuning of an application, preventing an easy study of different implementation choices.
These drawbacks denote a lack of a generic benchmark application, that could be used in every scenario, regardless of the environment, and that would enable to compare different solutions from various works. For these reasons, we think it is necessary to have a benchmark application that addresses the previous limits, i.e. that is: with a well defined description of the workflow, that can be easily customized, hence adaptable to every context; and, generic enough to be able to be adapted to any kind of streaming platform or middleware, so as to support current and future data stream frameworks.
To achieve these objectives, we need an high-level descrip-tion and model of a typical data stream applicadescrip-tion. Thus, we first define several fundamental characteristics common to DSP applications (Section IV), which have a significant impact on the characterization of an application workload. We then abstract these characteristics in a set of parameters configurable by the user through a high-level set of configu-rations (Section V). This model can then be used to generate benchmark applications.
IV. FUNDAMENTALCHARACTERISTICS
The behavior and performance of stream processing appli-cations are directly impacted by fundamental characteristics that can be grouped into two categories: the data stream that defines the input stream of the application; and the workflow that describes how data is processed and transferred between tasks. The two categories are interconnected as the workflow is impacted by the characteristics of the data stream.
A. Data Stream Characteristics
a) Data Characteristics: In stream processing, data can
assume various forms, from text to binary. The exact size and its variance depends on the application and also the input format, e.g. JSON, XML, plain text. Depending on the application field, the number of different items as well as their popularity may also vary significantly.
b) Input Rate: Data may arrive at different rates. Modern
applications such as social networks not always feature a Constant Bit Rate (CBR) stream. Instead, data is often sent in bursts – e.g. extraordinary events in sensor-networks [23] – and can follow a bimodal human behavior – e.g. day and night activities [24].
B. Workflow Characteristics
a) Connection: A DSP application is commonly
repre-sented as a Directed Acyclic Graph (DAG) of tasks, with the sources as roots and the sinks as leaves. The tasks can be arbitrarily connected to form different logical shapes. As an example, the three base layouts described in Fig. 1 are commonly basic building bricks for more complex topologies.
b) Scalability: Streaming systems are designed to
man-age high loads of data. Hence, applications need to be scalable. Most components of the topology can be parallelized to spread the incoming load over multiple instances. The global parallelism level of the application represents the total number of instances of all tasks of an application. However, this global value is not necessarily uniformly distributed, with some tasks requiring more computational capabilities.
c) Traffic Balancing: When data is transmitted to a
par-allelized task, the application has to decide how to distribute the tuples over the different instances. The various streaming platforms usually implement some standard grouping methods: (i) balanced routing, based on a simple round-robin algorithm that assigns each tuple to a different instance, enabling load balancing between the tasks; (ii) key-based routing, that sends each tuple to a specific instance using a hash function, allowing for stateful routing; (iii) broadcast routing, where a tuple is replicated and sent to all the following level instances.
d) Message Reliability: Most DSP platforms offer a
reli-ability mechanism to ensure message processing, It can impact the application throughput or its message failure probability [25].
e) Workload: Each task composing the DAG performs
various operation on the data and some might be more computationally intensive than others. Thus, the processing load is not always balanced over all tasks and bottlenecks might exist.
V. HIGH-LEVELDESCRIPTION
The characteristics listed before have been used to build a high-level description of the application, named Workflow schema. To make the model easily configurable by users, it was implemented under the form of a configuration file adopting the YAML standard [26]. It is composed of a series of key-values parameters grouped into different blocks.
The Workflow schema allows the user to specify the global parameters of the application. With these configurations, it is not necessary to define each task of the pipeline. This schema gives the user a quick and easy way to generate simple micro-benchmarks. The simplicity of the schema allows to swiftly tune test-by-test some application features (e.g. data size, parallelism, computing load), and easily experiment with different design combinations. Following the categorization made in the previous section, we divided the model into two homonymous main categories.
A. Data Stream Section
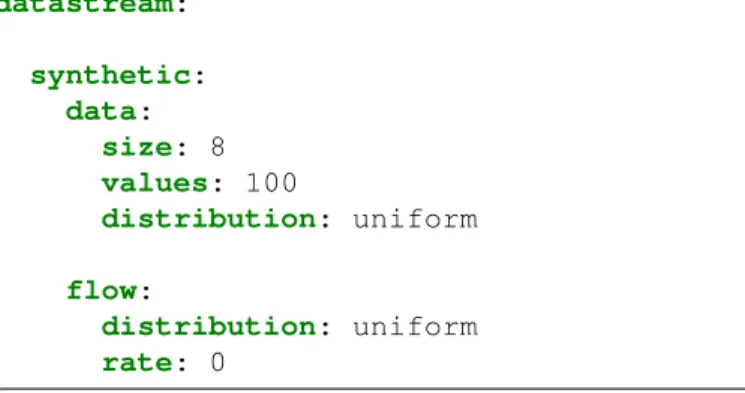
In this schema, the configuration has two sections. The datastream section contains the input data characteristics. The current version only support synthetic data generation. The model allows to define: how many unique values compose the data set generated, their appearance distribution, i.e. the probability of a value to be generated (e.g. uniform means equal probability for each value), and the size in bytes of a single tuple. The incoming flow is defined through its arrival distribution (currently CBR or Gaussian), and the rate of arrival in terms of tuples per second.
datastream: synthetic: data: size: 8 values: 100 distribution: uniform flow: distribution: uniform rate: 0
Fig. 2: Datastream section of Workflow schema (yamb.yml) For example, Fig. 2 indicates that the benchmark will generate synthetic data. Each tuple will have a size of 8 bytes and its values will be randomly chosen among 100 different ones with a uniform distribution. The arrival rate will be unbounded (indicated with value 0) and uniform (CBR). The unbounded rate will exploit the maximum capabilities of the platform and the testing environment, without setting any time interval between tuples.
B. Workflow Section
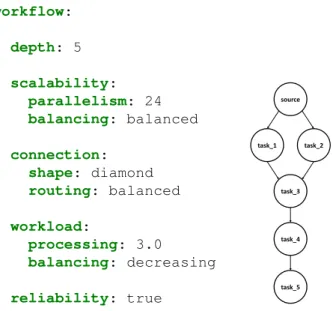
The high level description of the DAG is given in the workflow section. It allows to configure the logic composition of the graph and tasks connection as well as the internal task workload. The DAG depth, i.e. how many levels of subsequent tasks are in the topology, including the sources. The global parallelism level, i.e. the total sum of all the tasks instances, and how it is distributed over the single tasks. How the components are connected to each other, defining the grouping method (e.g. shuffle/round-robin, hash-based/by
key) and the shape of the topology, defined through the basic micro-benchmark layouts (represented in Fig. 1).
The tasks workload is defined by its processing load. The value specified in the schema will be used to simulate the internal workload of the tasks. We envision a busy wait simulation that will keep the CPU busy, in this manner we are able to produce a generic load not bounded to any specific data stream query. This allow context-agnosticism. The defined load will then be distributed over the tasks following the configured balancing method. A DSP application may have a balanced load, where all the tasks have the same processing load, as well as an application that does the heaviest work at the beginning or vice-versa (we will go into more details in Section VI-B Paragraph b).
workflow: depth: 5 scalability: parallelism: 24 balancing: balanced connection: shape: diamond routing: balanced workload: processing: 3.0 balancing: decreasing reliability: true source task_3 task_1 task_2 task_4 task_5
Fig. 3: Workflow section of Workflow schema (yamb.yml) In Fig. 3 we consider a diamond topology with round-robin (balanced) connections between tasks. The depth of 5 indicates there will be two more tasks after the diamond (Fig. 3 right side). With a balanced parallelism level of 24, each of the 6 tasks will have 4 instances. The processing time at each task will be simulated decreasing order (other modes such as constant or increasing are possible). This mode starts by assigning the to the first task and then decreases it by 20% for each following ones. Hence, the most costly tasks will be at the beginning of the topology.
VI. EVALUATION
A. Application Generation
Given the high-level description presented above, we im-plemented a framework able to translate that configuration into platform-specific code. Our initial prototype generates the derived benchmark applications for Apache Flink. The application will simulate the tasks workload based on the value defined in the Workflow schema: the value defined correspond to thousands of cycles in the busy wait function. The data injected in the stream is synthetic and formed as strings of
size and distribution as specified in the datastream section of the high-level description.
B. Proof of Concepts
In this section, we will show how it is possible to quickly and flexibly design micro-benchmarks. All the experiments were done on a 4-node Linux cluster on the Grid’5000 testbed [27]. Each node has two 4-core Intel Xeon CPUs and 32GB of memory interconnected by a 1 Gbps network. One machine is used as master and the other 3 as worker nodes.
We use throughput and latency as the two evaluation met-rics. The throughput is measured as the total number of tuples processed at a given level of a topology per second. The latency is the average time spent by tuples between the source and a sink. datastream: synthetic: data: size: 10 values: 100 distribution: uniform flow: distribution: uniform rate: 0 workflow: depth: 4 scalability: parallelism: 96 balancing: balanced connection: shape: linear routing: none workload: processing: 10 balancing: balanced
Fig. 4: Base configuration file for Workflow schema experi-ments. Highlighted values are changed during tests.
To demonstrate the benefit of the Workflow schema, we show how starting from a common linear topology, we can quickly evaluate the impact of small changes in the design choices. We show 2 different micro-benchmarks, using the base configuration file shown in Fig. 4. The considered topol-ogy is made of single source and 3 tasks organized in a linear
layout(Fig. 1a) with an unbounded and uniform synthetic data
stream of 100 unique values of 10 bytes each. The parallelism distribution was always balanced between tasks.
a) Parallelism Scale-up: Here, we evaluate the impact of the parallelism level on the entire application. We have set routing to balanced mode (i.e. rebalance in Flink).
In this evaluation we try four different parallelism levels, starting from the lowest possible value (4, i.e. 1 instance per task) until the highest one (96, i.e. 24 instances per task). In the configuration file, we just need to change the parallelism value and re-deploy NAMB.
0
500
1000
Running Time (s)
0
200
400
600
800
Throughput (tuples/ms)
1 source
6 sources
18 sources
24 sources
(a) Throughput; higher is better
0
500
1000
Running Time (s)
200
400
600
800
1000
1200
Latency (ms)
1 source
6 sources
18 sources
24 sources
(b) Latency; lower is better
Fig. 5: Performance when varying components parallelism. The different series represented are defined by the number of source instances.
From the results in Fig. 5 we can see how, as expected, the throughput increases when increasing the application par-allelism (Fig. 5a). More sources and more tasks to process data, increases the global emission rate. As we have enough tasks to process the data generated by the sources, the final throughput equals the sums of all the sources. Starting from a single source emission rate of 36 tuples/ms, the throughput linearly increases with the number of source instances: 218 tuples/ms with 6 sources, 646 tuples/ms with 18, up to 791 tuples/ms with 24 sources. On the other hand, the latency increases as well (Fig. 5b) due to the placement of the tasks on different nodes, following the network distance principle [6].
b) Computing Load Balancing: In this experiment, we
try to change the workload balancing, to see the impact of a computing bottleneck on the application performance. In the NAMB configuration, we just need to change the workload
balancing property. We keep the parallelism level to 96 and
the routing to direct (none).
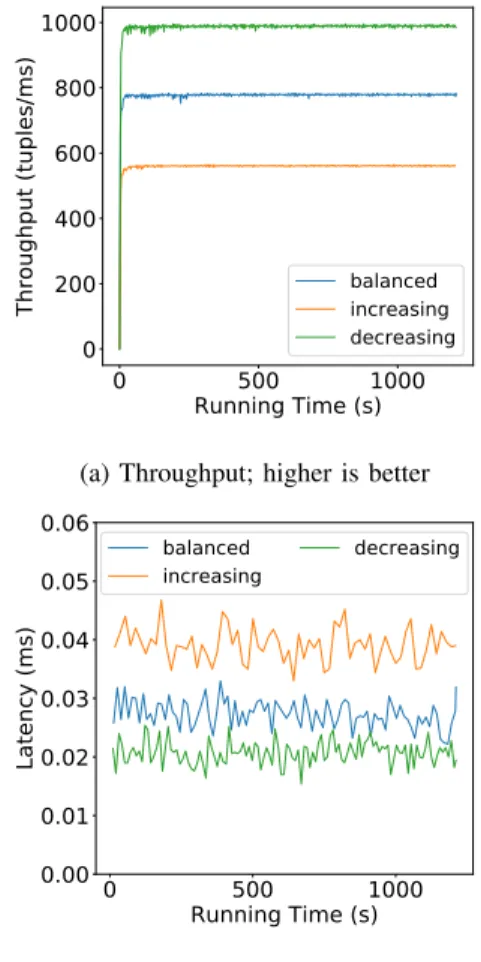
We investigate three different distributions: balanced, which assigns the same workload processing value to all the tasks; increasing, which assigns the workload processing value to the first task and increases it by 20% for each following ones; finally, decreasing which works the same way but decreases the workload.
0
500
1000
Running Time (s)
0
200
400
600
800
1000
Throughput (tuples/ms)
balancedincreasing decreasing(a) Throughput; higher is better
0
500
1000
Running Time (s)
0.00
0.01
0.02
0.03
0.04
0.05
0.06
Latency (ms)
balanced increasing decreasing(b) Latency; lower is better
Fig. 6: Performance with different workload distribution As expected, increasing the computing load greatly lowers the throughput compared to a balanced one (Fig. 6a). However, if the load decreases, the application can process more tuples. The completion latency (Fig. 6b) follows the same trend. What is interesting in this experiment is that it shows that, in Flink, having a high load on the first task will not necessarily create a bottleneck. Indeed, since all directly connected tasks are co-scheduled as a chain, the overall load is more important.
VII. CONCLUSION ANDFUTUREWORK
In this paper, we have presented an high-level description model to define benchmark applications workflows. Based
on the analysis of the main characteristics of DSP appli-cations, we have devised the Workflow schema. It allows for the precise, high-level, description of an application. To stay platform- and application-independent, we have intro-duced a simulated task workload which can replace complex application-dependent code with a simple equivalent busy-wait.
We have shown how the Workflow schema can be used to quickly benchmark a platform. As an example, we have used Flink and shown the impact of the the parallelism level and load distribution. Using this model, a user can investigate the impact of changes in the overall performance by simply modifying the configuration file instead of the real application. We are currently working to extend the Workflow schema to support missing common features as Windowing and Data Variability. The former will allow to test the impact of the window system of a platform, the latter will allow to tune parameters to define the change of data over the topology. As example, we will add support for data filtering and data resizing, to simulate data transformations. Moreover we plan to add a more task-specific description of the topology to allow a more precise definition of the application characteristics.
We will implement a complete framework for application generation and we envision to make it available as open source. We intend to add support for more Stream Processing engines as Apache Storm and Apache Spark Streaming. As well as developing a more complete data generator to allow different stream distributions.
ACKNOWLEDGMENTS
Experiments presented in this paper were carried out using the Grid’5000 testbed, supported by a scientific interest group hosted by Inria and including CNRS, RENATER and several Universities as well as other organizations (see https://www. grid5000.fr).
The research leading to these results has received funding from the European Commission’s Horizon 2020 Framework Programme for Research and Innovation (H2020), under grant agreement #732339: PrEstoCloud.
REFERENCES [1] “Apache Flink,” http://flink.apache.org/. [2] “Apache Storm,” http://storm.apache.org/.
[3] “Apache Heron,” https://apache.github.io/incubator-heron/. [4] “Apache Spark Streaming,” https://spark.apache.org/streaming/. [5] T. Akidau, A. Balikov, K. Bekiro˘glu, S. Chernyak, J. Haberman, R. Lax,
S. McVeety, D. Mills, P. Nordstrom, and S. Whittle, “Millwheel: fault-tolerant stream processing at internet scale,” PVLDB, 2013.
[6] B. Peng, M. Hosseini, Z. Hong, R. Farivar, and R. Campbell, “R-storm: Resource-aware scheduling in storm,” in ACM Middleware, 2015. [7] V. Marangozova-Martin, A. El Rheddane, and N. De Palma, “Multi-level
elasticity for data stream processing,” IEEE TPDS, 2019.
[8] W. A. Aljoby, T. Z. Fu, and R. T. Ma, “Impacts of task placement and bandwidth allocation on stream analytics,” in IEEE ICNP, 2017. [9] J. Xu, Z. Chen, J. Tang, and S. Su, “T-storm: Traffic-aware online
scheduling in storm,” in IEEE ICIDCS, 2014.
[10] S. Chatterjee and C. Morin, “Experimental study on the performance and resource utilization of data streaming frameworks,” in IEEE/ACM CCGRID, 2018.
[11] A. Floratou, A. Agrawal, B. Graham, S. Rao, and K. Ramasamy, “Dhalion: self-regulating stream processing in heron,” PVLDB, 2017.
[12] L. Eskandari, J. Mair, Z. Huang, and D. Eyers, “T3-scheduler: A topology and traffic aware two-level scheduler for stream processing systems in a heterogeneous cluster,” Elsevier FGCS, 2018.
[13] X. Liu and R. Buyya, “D-storm: Dynamic resource-efficient scheduling of stream processing applications,” in IEEE ICPADS, 2017.
[14] A. Arasu, M. Cherniack, E. Galvez, D. Maier, A. S. Maskey, E. Ryvkina, M. Stonebraker, and R. Tibbetts, “Linear road: a stream data manage-ment benchmark,” in PVLDB, 2004.
[15] S. Chintapalli, D. Dagit, B. Evans, R. Farivar, T. Graves, M. Holder-baugh, Z. Liu, K. Nusbaum, K. Patil, B. J. Peng et al., “Benchmarking streaming computation engines: Storm, flink and spark streaming,” in IEEE IPDPSW, 2016.
[16] J. Grier, “Extending the Yahoo! Streaming Benchmark,” https://www. ververica.com/blog/extending-the-yahoo-streaming-benchmark, 2016. [17] B. Yavuz, “Benchmarking Structured Streaming on Databricks
Runtime Against State-of-the-Art Streaming Systems,” https: //databricks.com/blog/2017/10/11/benchmarking-structured-streaming-on-databricks-runtime-against-state-of-the-art-streaming-systems.html, 2017.
[18] A. Krettek, “The Curious Case of the Broken Benchmark: Revisiting Apache Flink® vs. Databricks Runtime,” https: //www.ververica.com/blog/curious-case-broken-benchmark-revisiting-apache-flink-vs-databricks-runtime, 2017.
[19] R. Lu, G. Wu, B. Xie, and J. Hu, “Stream bench: Towards benchmarking modern distributed stream computing frameworks,” in IEEE/ACM UCC, 2014.
[20] L. Wang, J. Zhan, C. Luo, Y. Zhu, Q. Yang, Y. He, W. Gao, Z. Jia, Y. Shi, S. Zhang et al., “Bigdatabench: A big data benchmark suite from internet services,” in IEEE HPCA, 2014.
[21] “Alibaba Jstorm,” https://github.com/alibaba/jstorm.
[22] A. Shukla, S. Chaturvedi, and Y. Simmhan, “Riotbench: An iot bench-mark for distributed stream processing systems,” Wiley Concurrency, 2017.
[23] N. Zacheilas, V. Kalogeraki, N. Zygouras, N. Panagiotou, and D. Gunop-ulos, “Elastic complex event processing exploiting prediction,” in IEEE Big Data, 2015.
[24] M. Caneill, A. El Rheddane, V. Leroy, and N. De Palma, “Locality-aware routing in stateful streaming applications,” in ACM Middleware, 2016.
[25] A. Pagliari, F. Huet, and G. Urvoy-Keller, “On the cost of reliability in data stream processing systems,” in IEEE/ACM CCGRID, 2019. [26] “YAML,” https://yaml.org/.
[27] R. Bolze, F. Cappello, E. Caron, M. Dayd´e, F. Desprez, E. Jeannot, Y. J´egou, S. Lanteri, J. Leduc, N. Melab et al., “Grid’5000: A large scale and highly reconfigurable experimental grid testbed,” SAGE IJHPCA, 2006.