To cite this document:
Pirovano, Alain and Garcia, Fabien and Radzik, José Capacity
Dimensioning for Aeronautical Communications in North Atlantic Corridor. (2013) In:
19th Ka and Broadband Communications, Navigation and Earth Observation Conference,
14 October 2013 - 17 October 2013 (Florence, Italy).
O
pen
A
rchive
T
oulouse
A
rchive
O
uverte (
OATAO
)
OATAO is an open access repository that collects the work of Toulouse researchers and
makes it freely available over the web where possible.
This is an author-deposited version published in:
http://oatao.univ-toulouse.fr/
Eprints ID: 10676
Any correspondence concerning this service should be sent to the repository
administrator:
[email protected]
Capacity Dimensioning for Aeronautical
Communications in North Atlantic Corridor
Alain Pirovano, Fabien Garcia
ENAC (Ecole Nationale de l’Aviation Civile), Toulouse, France
José Radzik
Université de Toulouse/ISAE (Institut Supérieur de l’Aéronautique et de l’Espace), Toulouse,
France
Abstract
In the context of the Internet everywhere paradigm, aircraft passengers expect to get connectivity during flights. Several solutions based either on cellular networks in continental area or on satellite links have been designed and even deployed for some of them. But to face the increasing number of users and expected services, a migration to future satellite system such as Inmarsat's Ka band Global Xpress system have been planned. The considered geographical area of the present study is the north Atlantic corridor. In this service zone, the specific structure of aeronautical traffic must be taken into account. NAT (North Atlantic Tracks) are oceanic routes between North America and Europe that are periodically defined considering weather and wind conditions. This explains why the exact locations of the tracks change daily according to weather and also traffic demands. On each continent, specific air traffic control is provided in order to manage entrance and movement along these tracks. The proposed study makes the assumption of a flexible global coverage provided by multi beam Ka band satellites that operate in geosynchronous orbit. Aircraft flying in the north Atlantic corridor use the system in order to offer in-flight connectivity for airline passengers. Doing so, passengers may access common Internet services, namely web browsing, electronic mail, or file transfer. More specific applications for pilots and companies are also taken in consideration enhanced with new services such as real time black box data streaming. In order to assess induced traffic load and instantaneous required capacities in each spot beam, a simulation model has been specifically developed by ENAC and ISAE with Opnet Modeler software.
1
Introduction, motivations and objective
In the current aeronautical context new services for civil aircraft passengers are expected and represent an increasing interest. For instance, airlines want to provide their customers Internet access and hence web browsing, mailing or even access to corporate VPNs.... All these services represent a new type of air-ground communications which should be based on relative high capacity air ground links. The presented study aims at dimensioning satellite capacity over the North Atlantic corridor for aeronautical communications based on a Ka-band multibeam satellite. Two beam layouts are considered. The first one corresponds to INMARSAT-5 F2 satellite: 89 spot beams cover the Earth surface as seen from the satellite; the orbital position is 55° West. A second configuration is defined with a limited coverage over the North Atlantic and narrow beams (aperture of 0.6°).
As in any multibeam satellite system, the distribution of the potential users over the service zone is of tremendous importance for capacity dimensioning. The context of aeronautical communications over the North Atlantic is however highly specific as aircraft follow predefined trajectories. Because there is a lack of radar coverage in oceanic area, predefined routes are periodically computed ensuring that aircraft are separated over the ocean. The minimum separations between aircraft flying between the altitudes of 28,500 and 42,000 feet in NATS airspace is about 50 NM for the lateral separation, 5 to 10 minutes for the longitudinal separation, and 1000 feet for the vertical separation. In order to ensure flight safety, each flying aircraft must report in as it crosses various known waypoints along each track. These reports enable the Oceanic Controllers to maintain separation between aircraft. These reports can be made to controllers via a satellite communications link or via High Frequency (HF) radios. Furthermore, the routes are aligned in order to maximize tail winds and minimize any head winds impact on the aircraft with the aim to provide efficient flight by reducing flight time and fuel consumption.
Hence, based on an assessment of air traffic density in the geographic area considering accurate aircraft position derived from real positions, we study the dynamic occupation of each beam during one day. These more realistic trajectories based on NATs are computed using Eurocontrol data which give aircraft reporting points for each flight. Between successive reporting points, intermediate aircraft positions are interpolated. The first advantage of this approach is that the aircraft trajectories are based on real positions rather than using great circle distances between the departure and the arrival airports.
The specific NAT structure and daily air traffic management leads to a large imbalance between data traffic loads in satellite beams. In order to assess the amount of generated traffic in beams, mainly on the return link, a simulation platform has been developed using Opnet Modeler software. It relies on wireless network cabin models based on a complete TCP/IP protocol stack simulation. The model is composed of aircraft on-board systems based on Wi-Fi access point connected to ground through Ka band satellite links in order to offer an Internet access to passengers.
2
System description and simulation tools
2.1
Communication systems for Aircraft passengers
The first systems that have been developed to provide Internet access to passengers used satellites. For instance, from 2004 to 2006 the Connexion-by-Boeing [1] system was installed on about 150 aircraft. But mainly for economic reasons, the service was stopped in 2006. Since 2008, ARINC proposes another solution, named Oi for Onboard Internet [2]. Oi uses Inmarsat satellites with the SwiftBroadband service that offers throughput up to 432 kbps. In the same year, Panasonic offers a new solution called eXConnect [3] based on Intelsat satellites. OnAir solution enables passengers to access Internet through their laptop, tablet or smartphone during flights. Currently, OnAir uses Inmarsat's SwiftBroadband service operating in the L band with a limited bandwidth of 864 kbit/s. Another way of providing In-Flight Internet is to use a direct link to the ground, these solutions are obviously limited to continental areas (Gogo Inflight, Wi-SKY7 …).
2.2
Considered satellite communication systems
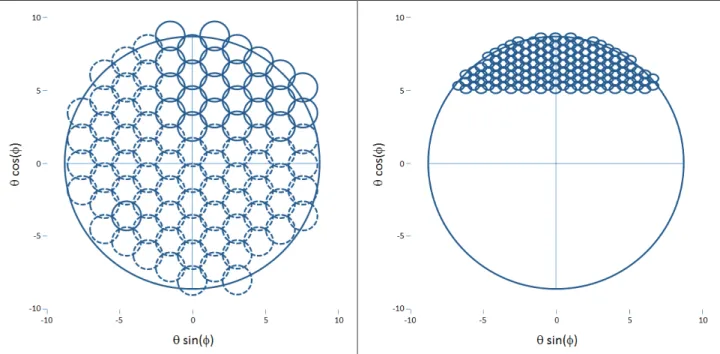
More recently, in order to accommodate a wide range of multimedia services, new multibeam satellite systems have been deployed with the aim to provide high links capacity to end users. In this study, we have mainly concerned by the definition of the spot beams over the North Atlantic region. Two configurations have been investigated. Figure 1 presents the two configurations in the standard (θ, φ) coordinates.
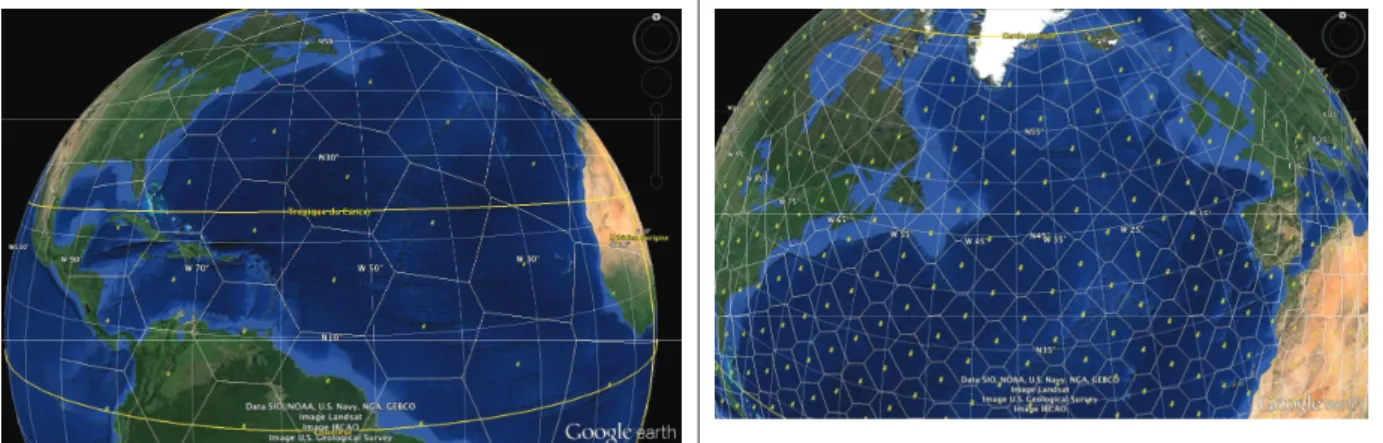
The first one corresponds to the INMARSAT-5 F2 satellite. From data provided by the INMARSAT and Boeing companies (http://www.igx.com/introduction_to_satellites, http://www.boeing.com/boeing/ defense-space/space/bss/factsheets/702/Inmarsat-5/Inmarsat-5.page), the satellite covers the entire viewable Earth region with 89 equally distributed beams, additional capacity is provided by six steerable spot beams. The second configuration introduces a hypothetical satellite specifically dedicated to the North Atlantic coverage. The beam layout is defined by a regular beam pattern as seen from the satellite, the aperture is 0.6°. The resulting projection of beams on the Earth surface is illustrated in Figure 2.
Figure 2 - Satellite spot beam coverage on North Atlantic zone: INMARSAT-V F2 (left), hypothetical satellite (right)
2.3
North Atlantic aeronautical service zone
The North Atlantic Airspace is a zone going roughly form 10°N to the North Pole and from 60°W to 10°W. It is divided in 5 areas named after the Air Traffic Control (ATC) centre responsible for enforcing regulations in them: Reykjavik, Shanwick, Gander, New York and Santa Maria. As [7] states it: “The North Atlantic is the busiest oceanic airspace in the world. In 2011 approximately 450,000 flights crossed the North Atlantic.” Due to this aircraft density and the lack of radar equipment on this zone, the ATC must enforce strict separation rules between aircraft by assigning routes to them and having each aircraft reports its position periodically (generally one report every hour).
Most of the traffic in the North Atlantic Airspace is organised in two major flows: a westbound flow departing Europe in the morning and an eastbound flow departing North America in the evening (UTC time). The first flow crosses the 30°W longitude between 11:30 and 19:00 (UTC) and the second flow crosses the same longitude between 01:00 and 08:00 (UTC). This Organised Track System (OTS) is the result of trying to satisfy passenger demands and airport noise reduction considering the time zone differences. Furthermore, it allows easy separation of westbound and eastbound flights by spreading them in different time slots. The set of westbound and eastbound tracks available for flying is published daily by ATC centres (Shanwick and Gander respectively). It is chosen so as to allow a maximum number of aircraft to follow them while guaranteeing the most economic flight conditions (considering winds and aircraft preferred altitude). Finally it is to be noted that those tracks are not mandatory, and the International Civil Aviation Organisation (ICAO) consider that half of the aircraft follow them as of 2012 [7], aircraft not following the tracks must nevertheless expect less than optimal flight altitude and frequent rerouting to ensure aircraft separation rules within the NAT.
a) Aircraft positions
In order to assess the necessary capacity for satellite beams on the NAT airspace, aircraft position have to be known. In this study, we used Eurocontrol data available from the OneSky website. Data has been gathered for several relevant days of traffic and then filtered so as to keep only air traffic relevant to the zone of interest. Finally, the position have been interpolated between the report points available so as to heighten time resolution in our study before applying a final stage of filtering to remove aircraft positions that lie out of the coverage of the satellite beams.
Data provided by Eurocontrol (OneSky website) contains aircraft position gathered through radar and periodic reports made by aircraft. In this second case, positions are known approximately every hour, which is not sufficient to infer satellite beam occupation as aircraft cover large distance in such a time period. It was thus decided to interpolate between known positions using a simple algorithm:
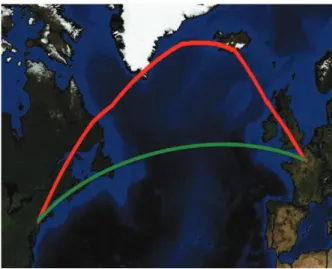
successive positions further apart than 100NM are interpolated using great circle arcs; loxodromy is used (i.e. constant heading route) for positions closer than 100NM. Aircraft speed is considered constant in between known positions, which is consistent with ATC rules in NAT airspace where aircraft are required to keep a constant velocity. This approach differs from the one taken in other studies where flight trajectories are approximated by great circle arcs between departure and destination airports as in [5] and [6]. Figure 3 shows, for a flight between Paris and New York, both the trajectory derived from the aircraft reporting points from our algorithm (in red) and the great circle arc trajectory. Considering the size of a beam satellite in our work, this clearly demonstrates the advantage of the first approach in order to avoid an important bias in our statistical study.
Figure 3 - Trajectory estimation of a real flight between Paris and New York b) Data filtering
The provided data include all commercial flights; however our focus is on passenger transcontinental flights at the exclusion of local and freight traffic. Several filters are implemented: first, a filter on the aircraft type as been applied so as to keep only aircraft that are technically able to carry satellite communication terminals; and then a filter is passed on aircraft crossing the 30°W longitude meridian to ensure that only the aircraft that actually cross the north Atlantic will be processed.
The interpolation procedure described in the previous section was then applied to all remaining aircraft trajectories. Finally the trajectories where pruned of all positions lying west of 90°W, east of 10°E, south of 23.5°N and north of 70°N. The satellite should always be seen with an elevation no less than 10°. This last condition was important so as to remove aircraft flying out of the zone where they would be able to catch the satellite signal.
c) Aircraft number assessment
For statistical analysis, three days from 2012 and 2013 have been analysed for our study. The first one, June 29 2012, was the most loaded day for 2012. The second, October 10 2013, was a medium to heavy load day. Finally the last day, January 1 2013 was the least loaded day for 2012 and 2013. Results for number of aircraft are show in Table 1. First column gives the total number of flights recorded by Eurocontrol. The second and third columns correspond to the number of aircraft after filtering by aircraft type and 30°W crossing and by trajectory pruning respectively. Last column gives the maximum number of aircraft flying simultaneously on a given day over the considered area.
Total flights in data Flights after first filter Flights after second filter Peek Instantaneous Aircraft Count June 29 2012 32680 1352 1346 482
October 10 2012 30323 1227 1224 444 January 1 2013 15324 905 900 325
Table 1 - Aircraft count statistics
It is to be noted that the number of aircraft flying over the NAT airspace doesn’t scale in the same way as the total number of aircraft, which is consistent with the claim that this airspace is the densest in terms of aircraft flying through it.
d) Simulation model
The considered system has been modelled using OPNET Modeler software (Opnet technologies Inc, www.opnet.com). The simulation paradigm is discrete event simulation. The model makes use of the incorporated libraries, mainly for the TCP/IP protocol stack, and specific modules.
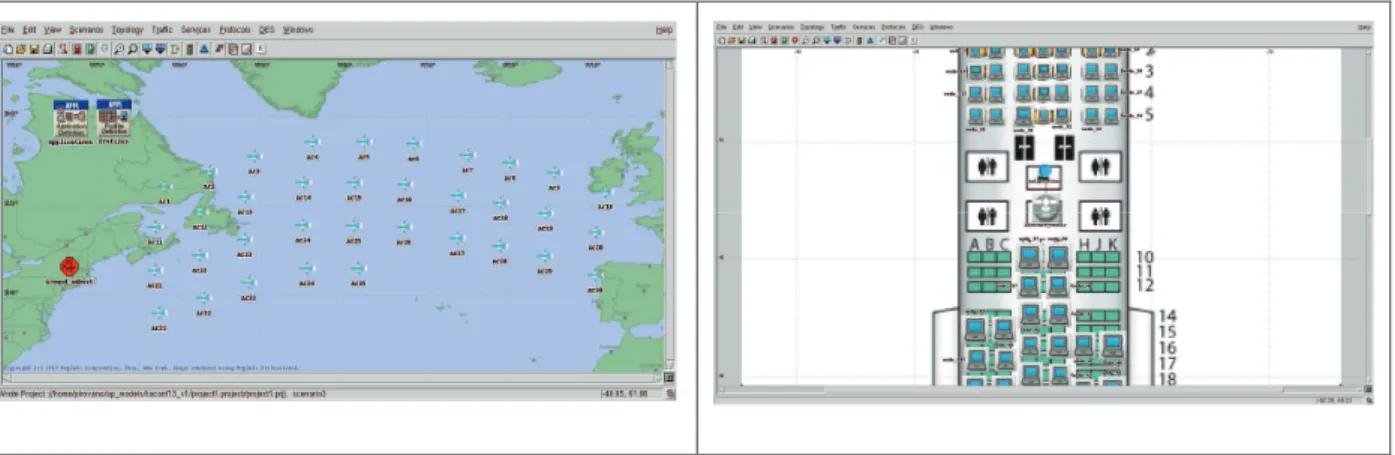
The top-level simulation model is presented in Figure 4 (left). Several aircraft flying in north Atlantic corridor are modelled. The considered aircraft of a single simulation belong to one beam. Each aircraft is assumed to have at least one hundred passengers using their laptop in order to access to Internet resources.
Figure 4 – OPNET Modeler simulation model
This model is composed of different components: several aircraft (TCP/IP end users, aircraft router providing Wifi wireless access to end passengers’ nodes, a satellite terminal) and a ground subnet (ground router linked with a server which answers to passengers requests, a satellite terminal for Earth gateway connectivity)
The Figure 4 (right) shows a part of the aircraft cabin model based on a Boeing 777 cabin plan with one hundred users, the aircraft router, and the satellite terminal. The set of applications used by the end users can be chosen. Based on applications provided by the Opnet libraries, two types of end users have been defined: “Classical users” (web browsing and simple mail with applications) and “Advanced users (web browsing, mail with attached files and voice over IP). The settings of applications parameters are given in annex.
3
Capacity Dimensioning in North Atlantic Corridor
In this part, we estimate the cumulated traffic generated by all the passengers of the aircraft flying in a same beam at one time. This assessment is obtained using the previously described model developed with OPNET Modeler. Considering the two satellite configurations, we have computed the maximum, minimum, and mean number of aircraft in a beam during one day. Considering these results, the cumulated traffic generated by the aircraft is obtained through simulations. We have considered four cumulated throughput types in each simulation:
• in each aircraft, the cumulated throughput generated by the passengers applications between the aircraft router and the aircraft satellite terminal (AC_GWToSatTerm, satellite return link) and the cumulated throughput generated by ground servers for the aircraft passengers between the aircraft satellite terminal and the aircraft router (AC_SatTermToGW, satellite forward link)
• on the ground network, the cumulated throughput generated by the passengers applications of all aircraft between the ground satellite terminal and the ground router (Ground_SatTermToGW, satellite return link) and the cumulated throughput generated by the ground servers between the ground router and the ground satellite terminal (Ground_GWToSatTerm, satellite forward link)
3.1
Beam occupation
In order to assess the necessary capacity for the satellite system, we had to compute the number of aircraft present in each beam with respect to time. Results of these measurements for the day of 2012 June 29 are shown in Figure 5 in the case of the INMARSAT-5 beam layout.
Figure 5 - Number of aircraft in the 4 most loaded beams according to time for 2012 June 29 When going east, the successive beams are numbered 3, 10 and 17 (beam 7 being north of 3 and 10). The traces shape clearly results from the flight rules described in section 2.3 (two flows, one going west in the morning, and one going east in the evening). Table 2 presents the statistics for the 4 most loaded beams.
Beam 2012 June 29 2012 October 05 2013 January 1 Average Max Average Max Average Max 3 46.44 150 41.84 165 27.98 95 7 23.48 94 20.70 61 11.92 53 10 43.75 160 44.04 144 30.54 101 17 42.81 153 41.97 156 29.63 117
Table 2 - Beam aircraft occupation, INMARSAT-5 configuration
Table 3 shows the beam occupation for the proposed alternative satellite coverage (10 most loaded beams (in average) for the 29th of June 2012). Here again we observed that the data reflected the flight rules for NAT airspace. As expected the maximum number of aircraft per beam is proportionally less than for the Inmarsat coverage.
Beam 2012 June 29 Average Max 152 8.30 36 28 8.05 45 35 7.86 39 22 7.72 40 43 7.17 29 134 6.79 37 69 6.66 31 116 5.97 28 29 5.72 24 143 5.44 29
Table 3 - Beam aircraft occupation, hypothetical satellite
3.2
Expected throughputs per beam
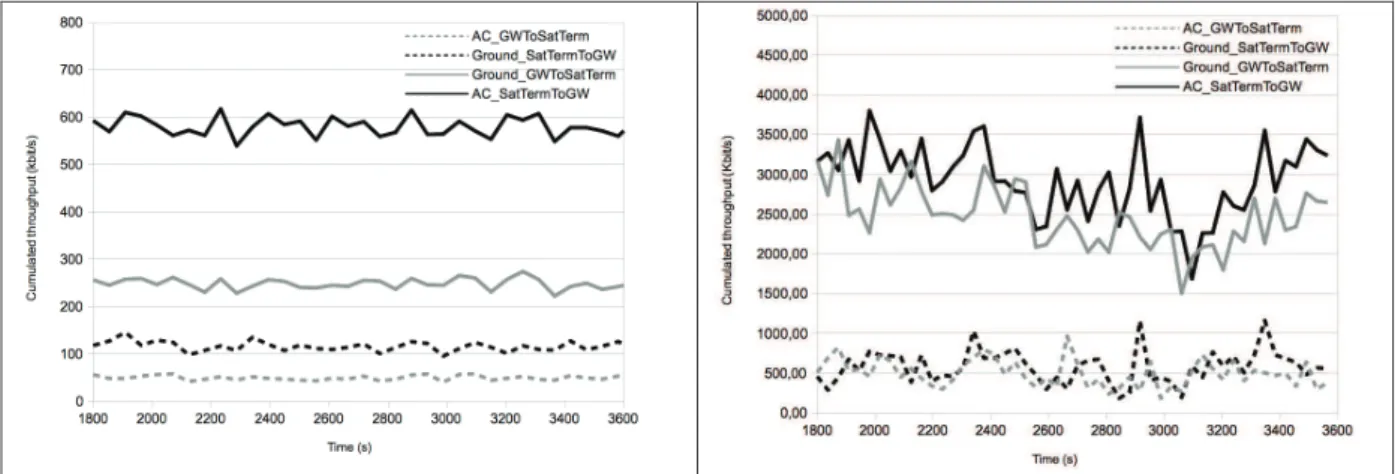
As explained in the previous part, we provide here the simulation results we obtained. Firstly, in order to partially validate the models and underline some trends, we present in Figure 6 the cumulated throughput observed for 5 aircraft considering two different profiles users. As expected, in the case of classical users, the cumulated throughputs are asymmetrical. The cumulated throughput from one aircraft is about 50 Kbit/s and the cumulated throughput to aircraft is about 110 Kbits/s. On the ground link, the aggregated throughputs for the 5 aircraft show the same trend: about 250 Kbit/s from the aircraft to the ground and about 580 Kbit/s from the ground to the aircraft.
In the Figure 6 (right), we can see that when the set of applications is enhanced with file transfer and foremost voice over IP, the cumulated throughputs are less asymmetrical. Considering one aircraft, the outcoming and incoming cumulated throughputs are quite similar that is about 600 Kbit/s. And the
aggregated throughputs on the ground link for the 5 aircraft are about 2.5 Mbit/s. We can also deduce from these first results that the cumulated traffic properties between the aircraft and the ground should not allow obtaining a noticeable statistical multiplexing gain: the cumulated throughput on the ground link is expected to increase linearly with the number of aircraft as confirmed by simulation (Figure 7).
Figure 6 - Cumulated throughput (5 aircraft, classical users left, advanced users right)
Figure 7 - cumulated throughput/Number of aircraft (classical users)
Table 4 gives the simulation results with the satellite beam configuration based on the future Inmarsat-5. On the base of one, mean, and maximum number of aircraft in the most loaded beam during one day, the cumulated throughput observed by simulation on each segment (in the aircraft and on the ground) is given in Kbit/s. The cumulated throughputs have been assessed with the two types of end users (classical and advanced users). Conforming to the last part, three days have been considered in the study with three different aircraft density: June 29 2012 (heavy day aircraft density), October 5 2012 (medium day aircraft density) and January 1 2013 (light day aircraft density). Table 4 presents the results obtained for the heavy day, tables for the two others days are given in annex.
AC_GWToSatTerm AC_SatTermToGW Ground_SatTermToGW Ground_GWToSatTerm
Classic users One 1 47,99 106,62 47,98 116,64 Mean 43,78 47,99 106,62 2151,34 5081,30 Max 160 47,99 106,62 7862,37 18570,30 Adv. users One 1 569,07 687,62 618,49 687,73 Mean 43,78 569,07 687,62 20933,98 23354,18 Max 160 569,07 687,62 76506,08 85351,04
Table 4 - Cumulated Throughputs with beam configuration 1 (june 29 2012)
The needed capacity in the heaviest loaded beam is about 7.9 Mbits/s from the aircraft to the ground and 18.6 Mbit/s from the ground to the aircraft in the case of ’classical’ users. Yet again, we can see the asymmetric behaviour of classical Internet data flows. And in the case of advanced users, the needed capacity is about 76.5 Mbits/s from the aircraft to the ground and 85.4 Mbit/s from the ground to the aircraft.
Table 5 gives the simulations results with the hypothetical satellite beam configuration more specifically dedicated to cover the north Atlantic corridor.
AC_GWToSatTerm AC_SatTermToGW Ground_SatTermToGW Ground_GWToSatTerm
Classic users One 1 47,99 106,62 47,98 116,64 Mean 8,05 47,99 106,62 395,58 934,32 Max 45 47,99 106,62 2211,29 5222,90 Adv. users One 1 569,07 687,62 618,49 687,73 Mean 8,05 569,07 687,62 3849,21 4294,22 Max 45 569,07 687,62 21517,34 24004,98
Table 5 – Expected Cumulated Throughputs with beam configuration 2
In the heaviest loaded beam considering ‘classical’ users, the needed capacity is about 2.2 Mbits/s from the aircraft to the ground and 5.2 Mbit/s from the ground to the aircraft. With ‘advanced’ users, the needed capacity reaches 21.5 Mbit/s from the aircraft to the ground and 24 Mbit/s from the ground to the aircraft. In this beam configuration, each one of these needed capacities is more than three times smaller.
4
Conclusions
In this paper multibeam satellite systems have been considered and the needed capacity has been assessed in order to provide Internet access to aircraft passengers in north Atlantic corridor. Two configurations have been investigated, the first one corresponds to the INMARSAT-5 F2 satellite and the second one makes the assumption of a satellite specifically dedicated to the North Atlantic coverage. In both configuration, an innovative approach allowing to assess accurate 4D aircraft positions is proposed in order to compute beam occupation and hence the needed capacity to provide Internet access to aircraft passengers. This latter results are obtained using a specific simulation model, and show that in both satellite configurations the needed capacity matches with the one which could be provided in future multibeam satellite systems.
Annex - Applications parameters settings
Web browsing Mail File transfer Voice over IP Start Time Offset (s) Exponential (30) Start Time Offset (s) Exponential (30) Start Time Offset (s) Uniform (5,10) Start Time Offset (s) Exponential (600) Duration End of profile Duration End of
profile Duration End of profile Duration Exponential (180) Inter-repetition Time (s) Exponential (300)
Repeatibility Unlimited Inter-repetition Time (s) Exponential (900) Inter-repetition Time (s) Exponential (3600) Number of repetition Unlimited Send Interarrival Time (s) Exponential (360) Number of repetition Unlimited Number of repetition Unlimited HTTP Specification HTTP 1.1 Receive Interarrival Time (s) Exponential (360) Command Mix (Get/Total) 50% Encoder scheme G.729 A Page Interarrival Time (s) Exponential (60) Email mean size (bytes) 2000 bytes Inter-Request Time (s) Exponential (900) Page properties 5 objects of 1000 bytes Mean File Size (bytes) 500 kbytes
References
1. Jones, W., De La Chapelle, M., “Connexion by Boeing SM-broadband satellite communication system for mobile platforms,” Military Communications Conference (MILCOM) 2001. IEEE, Vol. 2, 2001, pp. 755 – 758 vol.2
2. “ARINC Onboard Internet Website.” http://www.arinc.com
3. “Panasonic Website,” http://www.panasonic.aero/Products/GlobalComm.aspx. 4. “OnAir Website,” http://www.onair.aero.
5. Daniel Medina, Felix Hoffmann, Francesco Rossetto, and Carl-Herbert Rokitansky, A Geographic Routing Strategy for North Atlantic In-Flight Internet Access Via Airborne Mesh Networking, IEEE/ACM Transactions on Networking, Vol. 20, No. 4, August 2012
6. Daniel Medina, Felix Hoffmann, Francesco Rossetto, Carl-Herbert Rokitansky, North Atlantic Inflight Internet Connectivity via Airborne Mesh Networking, Vehicular Technology Conference (VTC Fall), IEEE, 2011