DOCTORAT DE L'UNIVERSITÉ DE TOULOUSE
Délivré par :
Institut National Polytechnique de Toulouse (INP Toulouse)
Discipline ou spécialité :
Génie des Procédés et de l'Environnement
Présentée et soutenue par :
M. LUIS FERNANDO MORALES MENDOZA
le mercredi 4 décembre 2013
Titre :
Unité de recherche :
Ecole doctorale :
ECOCONCEPTION DE PROCEDES : APPROCHE SYSTEMIQUE
COUPLANT MODELISATION GLOBALE, ANALYSE DU CYCLE DE VIE
ET OPTIMISATION MULTIOBJECTIF.
Mécanique, Energétique, Génie civil, Procédés (MEGeP)
Laboratoire de Génie Chimique (L.G.C.)
Directeur(s) de Thèse :
MME CATHERINE AZZARO PANTEL M. LUC PIBOULEAU
Rapporteurs :
Mme GENEVIÈVE GESAN GUIZIOU, INRA RENNES M. XI-GANG YUAN, UNIVERSITE DE TIANJIN CHINE
Membre(s) du jury :
1 M. SERGE DOMENECH, INP TOULOUSE, Président
2 M. JEAN PIERRE BELAUD, INP TOULOUSE, Membre
2 Mme CATHERINE AZZARO PANTEL, INP TOULOUSE, Membre
Abstract
The objective of this work is to propose an integrated and generic framework for eco-design coupling traditional modelling and flowsheeting simulation tools (HYSYS, COCO, ProSimPlus and Ariane), Life Cycle Assessment, multi-objective optimization based on Genetic Algorithms and multiple criteria decision-making methods MCDM (Multiple Choice Decision Making, such as ELECTRE, PROMETHEE, M-TOPSIS) that generalizes, automates and optimizes the evaluation of the environmental criteria at earlier design stage. The approach consists of three main stages. The first two steps correspond respectively to process inventory analysis based on mass and energy balances and impact assessment phases of LCA methodology. Specific attention is paid to the main issues that can be encountered with database and impact assessment i.e. incomplete or missing information, or approximate information that does not match exactly the real situation that may introduce a bias in the environmental impact estimation. A process simulation tool dedicated to production utilities, Ariane, ProSim SA is used to fill environmental database gap, by the design of specific energy sub modules, so that the life cycle energy related emissions for any given process can be computed. The third stage of the methodology is based on the interaction of the previous steps with process simulation for environmental impact assessment and cost estimation through a computational framework. The use of multi-objective optimization methods generally leads to a set of efficient solutions, the so-called Pareto front. The next step consists in identifying the best ones through MCDM methods. The approach is applied to two processes operating in continuous mode. The capabilities of the methodology are highlighted through these case studies (benzene production by HDA process and biodiesel production from vegetable oils). A multi-level assessment for multi-objective optimization is implemented for both cases, the explored pathways depending on the analysis and antagonist behaviour of the criteria.
Keywords: Eco-design, Multi-objective Optimization, Life-Cycle Assessment (LCA), Genetic Algorithm (GA), Multiple Criteria Decision Making (MCDM), Process simulators, Energy plant simulator
Résumé
L’objectif de ce travail est de développer un cadre méthodologique et générique d’éco-conception de procédés chimiques couplant des outils de modélisation et de simulation traditionnels de procédés (HYSYS, COCO, ProSimPlus et Ariane), d’Analyse du Cycle de Vie (ACV), d’optimisation multi-objectif basée sur des Algorithmes Génétiques et enfin des outils d’aide à la décision multicritère (ELECTRE, PROMETHEE, M-TOPSIS). Il s’agit de généraliser, d’automatiser et d’optimiser l’évaluation des impacts environnementaux au stade préliminaire de la conception d’un procédé chimique. L’approche comprend trois étapes principales. Les deux premières correspondent d’une part aux phases d’analyse de l’inventaire par calcul des bilans de matière et d’énergie et d’autre part à l’évaluation environnementale par ACV. Le problème du manque d’information ou de l’imprécision dans les bases de données classiques en ACV pour la production d’énergie notamment sous forme de vapeur largement utilisée dans les procédés a reçu une attention particulière. Une solution proposée consiste à utiliser un simulateur de procédés de production d’utilités (Ariane, ProSim SA) pour contribuer à alimenter la base de données environnementale en tenant compte de variations sur les conditions opératoires ou sur les technologies utilisées. Des sous-modules « énergie » sont ainsi proposés pour calculer les émissions relatives aux impacts liés à l’utilisation de l’énergie dans les procédés. La troisième étape réalise l’interaction entre les deux premières phases et l’optimisation multi-objectif qui met en jeu des critères économiques et environnementaux. Elle conduit à des solutions de compromis le long du front de Pareto à partir desquelles les meilleures sont choisies à l’aide de méthodes d’aide à la décision. L’approche est appliquée à des procédés de production continus : production de benzène par hydrodéalkylation du toluène HDA et production de biodiesel à partir d’huiles végétales. Une stratégie à plusieurs niveaux est mise en œuvre pour l'analyse de l'optimisation multi-objectif. Elle est utilisée dans les deux cas d'étude afin d'analyser les comportements antagonistes des critères.
Mots-clés: Éco-conception; optimisation multi-objectif; analyse du cycle de vie (ACV) Algorithmes génétiques (AG), méthodes d'aide à la décision multicritère; simulateurs de procédés, simulateur de production d’énergie.
Resumen
El objetivo de este trabajo es desarrollar una estrategia metodológica y genérica para el eco-diseño de procesos químicos utilizando herramientas tradicionales de modelado y de simulación (HYSYS, COCO, ProSim Plus et Ariane), de análisis de ciclo de vida (ACV), de optimización multi-objetivo (algoritmos genéticos) y finalmente métodos de ayuda a la decisión (ELECTRE, PROMETHEE, M-TOPSIS). El propósito es de generalizar, automatizar y de optimizar la evaluación de los impactos ambientales en las etapas preliminares de diseño de un proceso químico. La estrategia comprende tres etapas principales. Las dos primeras corresponden a la fase de análisis de inventario del cálculo de masa y energía del proceso y a la fase de la evaluación de impacto a través del ACV. El problema de falta de información o de la imprecisión en las bases de datos clásicas de ACV para la producción de energía, particularmente la producción de vapor ampliamente utilizado en los procesos químicos ha recibido una atención particular. Una solución propuesta consiste en utilizar un simulador de procesos de producción de utilidades (Ariane, ProSim SA) para contribuir a la alimentación de las bases de datos ambientales teniendo en cuenta variaciones sobre las condiciones operativas y las diferentes tecnologías. Sub-módulos de energía son diseñados para calcular las emisiones relacionadas a los impactos ligados a la consumación de energía por parte del proceso químico. La tercera etapa lleva a cabo la interacción entre las etapas anteriores y la optimización multi-objetivo que toma en cuenta criterios económicos y ambientales. La etapa conduce a soluciones de compromiso en el frente de Pareto a partir de las cuales las mejores son elegidas gracias a los métodos de ayuda a la decisión. La estrategia es aplicada a procesos continuos: producción de benceno a través de la Hidrodealquilación de Tolueno (HDA) y a la producción de Biodiesel a partir de aceites vegetales. Una estrategia multi-etapas es implementada para el análisis de la optimización multi-objetivo y es utilizada en los dos casos de estudio a fin de analizar los comportamientos antagonistas de los criterios.
Palabras clave: Eco-diseño, optimización multi-objetivo, Análisis de ciclo de vida (ACV), Algoritmos genéticos (GA), Métodos de ayuda a la decisión multicriterio; Simuladores de procesos; Simuladores de producción de energía; Software de ACV
Abstract ... iii
Résumé ... v
Resumen ... vii
Content ... ix
Introduction ... 1
1 INTRODUCTION AND MOTIVATION ... 3
1.1 Introduction ... 6
1.2 Metrics for sustainability and eco-design for processes ... 8
1.2.1 General concepts on holistic approaches for sustainability assessment ... 8
1.2.2 AICHE and ICHEME metrics ... 10
1.2.2.1 AIChE metrics ... 11
1.2.2.2 IchemE metrics ... 11
1.2.3 Using metrics for sustainable development ... 12
1.2.4 Potential environmental impact index (Waste Reduction Algorithm, WAR) ... 13
1.2.4.1 Principles ... 13
1.2.4.2 Categories of environmental impact potential in the WAR method ... 14
1.2.4.3 Application of the WAR algorithm ... 16
1.2.5 SPI (Sustainable Process Index) ... 16
1.2.6 Exergy as a thermodynamic base for a sustainable development metrics ... 18
1.2.7 Indicators from life cycle assessment ... 18
1.2.8 Toward a sustainable life cycle assessment ... 20
1.3 Process design methods and sustainable systems ... 20
1.3.1 Positioning of chemical process industries ... 20
1.3.2 Several roads to more sustainable processes and systems ... 21
1.3.2.1 Industrial ecology ... 22
1.3.2.3 Green chemistry / green engineering, process intensification and waste management . 23
1.3.3 Eco-design approaches ... 24
1.4 Main objectives of this work ... 27
2 LCA-BASED ENVIRONMENTAL ASSESSMENT APPROACH: BRIDGING DATA GAP WITH PROCESS SIMULATION FOR ENERGY GENERATION ... 29
2.1 Introduction ... 32
2.2 System-based environmental assessment management ... 33
2.3 LCA environmental impact assessment framework ... 35
2.3.1 LCA principles ... 35
2.3.2 Impact factors and databases ... 36
2.3.3 IMPACT 2002+ ... 39
2.3.4 Database limitation for energy production for chemical processes ... 41
2.4 Impacts of process energy requirements ... 41
2.4.1 Energy production ... 42
2.4.2 Use of an energy production plant simulator... 43
2.4.3 Modelling steam production in Ariane ... 44
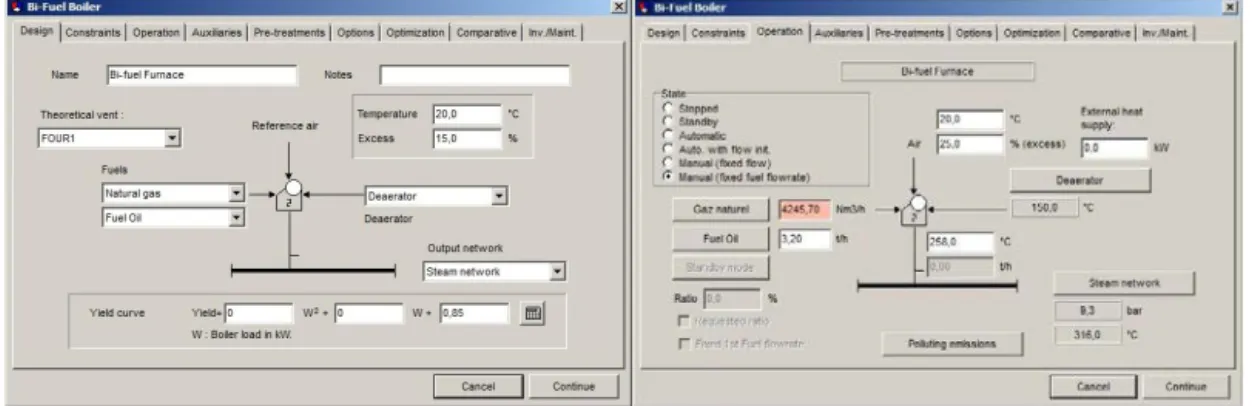
2.4.3.1 Steam production by a bi-fuel furnace ... 45
2.4.3.1.1 Bi-fuel furnace modelling in Ariane ... 45
2.4.3.1.2 Calibration of emissions for the bi-fuel furnace model ... 46
2.4.3.2 Steam production by a gas turbine ... 47
2.4.3.2.1 Gas turbine modelling in Ariane ... 48
2.4.3.2.2 Calibration of emissions for the turbine model ... 50
2.4.4 Cradle to gate environmental assessment for a specific steam production... 52
2.5 Conclusion ... 57
3 COUPLING PROCESS SIMULATION WITH LIFE CYCLE ASSESSMENT FOR ECO-EFFICIENT PROCESS DESIGN ... 59
3.1 Introduction ... 62
3.2 Synthesis of literature review in process modelling/ optimization techniques and tools based on LCA ... 64
3.3.1 Environmental impact model development ... 65
3.3.1.1 Product versus Process oriented LCA ... 66
3.3.1.2 LCA software tools... 66
3.3.2. Process flowsheeting tools ... 68
3.2.2.1 Aspen HYSYS ... 72
3.2.2.2 COCO simulator ... 72
3.2.2.3 ProSimPlus ... 73
3.2.3 Economic model ... 74
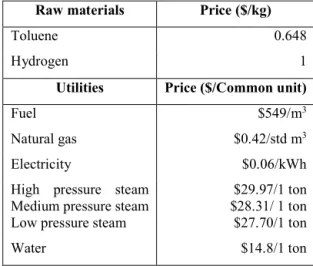
3.4 Support example: benzene production by hydrodealkylation of toluene (HDA process) ... 75
3.4.1 Presentation of the HDA process ... 75
3.4.2 Operating conditions for the HDA simulation model ... 77
3.4.2.1 Process inputs ... 78
3.4.2.2 Reactions ... 78
3.4.2.3 Heating and cooling ... 78
3.4.2.4 Separation and Distillation ... 79
3.4.2.5 Pump and compressor in recycling ... 79
3.4.2.6 Economic data ... 79
3.4.3 HDA simulation with COCO, ProSimPlus and HYSYS ... 80
3.4.4 Energy production modelling and emission computation with Ariane ... 83
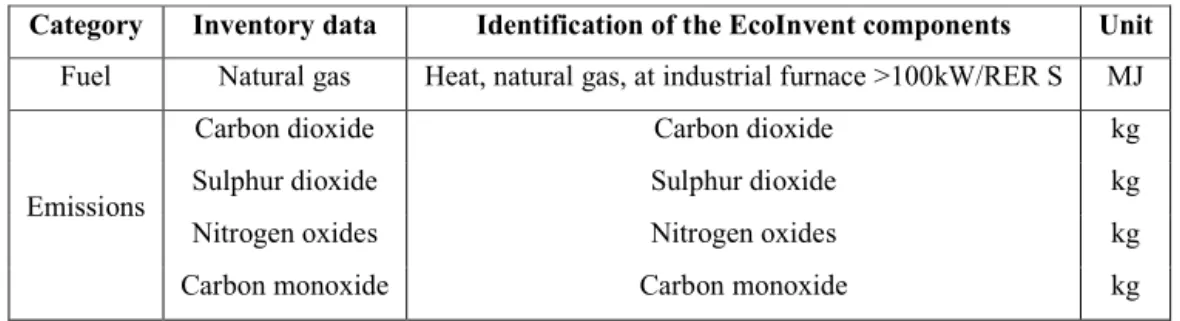
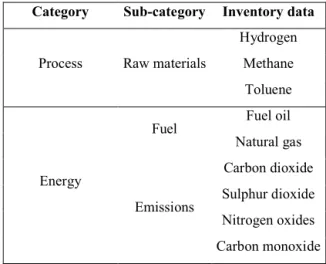
3.5 Inventory data ... 83
3.6 Identification of potential factors ... 86
3.6.1 Recovery of impact factors for environmental impact model design ... 86
3.6.2 Application to the HDA process ... 87
3.7 A framework for eco-efficient process design ... 89
3.7.1 Principles ... 89
3.7.2 Framework implementation ... 90
3.7.2.1 Setting the scene ... 90
3.7.2.2 Framework activity description ... 90
3.9 Sensitivity analysis ... 96
3.10 Results analysis ... 98
3.10.1 Comparison of scenarios in the midpoint and end-point categories ... 98
3.10.2 Environmental impact analysis of a specific scenario ... 102
3.11 Conclusions ... 104
4 MULTI-OBJECTIVE OPTIMIZATION AND MULTIPLE CRITERIA DECISION MAKING FOR ECO-DESIGN ... 105
4.1 Introduction ... 108
4.2 Multi-objective optimization (MOOP) ... 109
4.2.1. Formulation of a MOOP problem and concept of Pareto dominance ... 109
4.2.2. Selection of a multi-objective optimization method ... 110
4.2.3. Selection of an evolutionary procedure ... 113
4.3 Multiple choice decision making (MCDM) methods ... 115
4.3.1 Principles ... 115
4.3.2 ELECTRE ... 116
4.3.3 PROMETHEE ... 118
4.3.4 M-TOPSIS ... 120
4.4 Integration of MOO and MCDM in the eco-design framework ... 122
4.4.1 Presentation ... 122
4.4.2 Framework implementation ... 122
4.4.2.1 Setting the scene ... 122
4.4.2.2 Eco-design framework ... 123
4.5 HDA process optimization ... 123
4.5.1 Optimization problem formulation ... 123
4.5.2 Genetic Algorithm implementation ... 125
4.5.3 Reducing the criteria number ... 125
4.5.4 A detailed analysis of Pareto front ... 128
4.5.4.1 Selecting potential solutions ... 128
4.5.4.2.1 Environmental impact analysis of the potential solutions ... 129
4.5.4.2.2 Comparison of potential solutions in environmental categories and operating cost ... 133
4.5.4.2.3 Environmental impact analysis of a specific scenario ... 135
4.6 Main contributions of this chapter and Conclusions ... 137
5 ECO-DESIGN OF BIODIESEL PRODUCTION PROCESS ... 141
5.1 Introduction ... 143
5.2 Biodiesel production: context and production processes ... 143
5.2.1. Introduction to biodiesel production ... 143
5.2.2. Biodiesel production processes ... 145
5.2.2.1 Alkali-catalyzed production process ... 146
5.2.2.2 Acid-catalyzed production process ... 147
5.3. Biodiesel production simulation with Hysys ... 148
5.3.1 General assumptions ... 148
5.3.1.1 Process inputs ... 148
5.3.1.2 Reactions ... 149
5.3.1.3 Cooling ... 149
5.3.1.4 Separation and Distillation ... 149
5.3.1.5 Pump and compressor in recycling ... 149
5.3.1.6 Economic data ... 150
5.3.2 Validation of Biodiesel simulation model in HYSYS ... 150
5.3.3 Flowsheet modification for Biodiesel simulation model in HYSYS... 153
5.4 Inventory data and identification of potential factors ... 153
5.5 Optimization of biodiesel production ... 155
5.5.1 Optimization problem formulation ... 155
5.5.2 A detailed analysis of the Pareto front... 156
5.5.2.1 Environmental impact analysis ... 158
5.5.3.2 Comparison of potential solutions in environmental categories and operating cost ... 161
5.6 Conclusions ... 164
6 CONCLUSIONS AND PERSPECTIVES ... 165
Bibliography ... 171
List of figures ... 185
List of tables ... 189
Introduction
The topic of this thesis is use of systems oriented methods in conceptual design and analysis of chemical processes, with respect to environmental performance following sustainable development guidelines. The scope is limited to the early design phase. Process design that has been identified as a main issue in chemical engineering background can be viewed as an iterative procedure that can be decomposed into conceptual design (process synthesis) and process analysis. The aim is to show how Life Cycle Assessment (LCA) and other system oriented methods can be applied in the early design phase of a system, combining process modelling with traditional flowsheeting tools, multiobjective optimization and multiple criteria decision making concepts. The main motivation of this work is to propose an integrated framework for “eco-design”, meaning that the environmental components are taken into consideration right from the design of the product and process. The “eco-design” term thus appears to be the operational contribution of sustainable development.
This research work was carried out in the Laboratoire de Génie Chimique, Toulouse France, in the Process Systems Engineering Department with financial support of CONACYT1
Outline of the thesis
Chapter 1 introduces the reader to the general scope of the thesis in which systems oriented methodologies are the cornerstone of the eco-design issue. Process design is a multi-objective problem in the context of cleaner production that can be tackled by a combined approach involving:
on the one hand, Life Cycle thinking and its metrics that can be particularly useful for the production of chemicals and utilities so that solutions for more efficient processing and energy systems for the process industry can be found;
and on the other hand, process modelling, simulation and optimization for design and systems engineering methodologies, that are essential to optimize existing and prospective processes. Using process modelling based on eco-efficiency and economics is a requirement for knowledge-based decision making to enhance process sustainability.
In addition, Chapter1 provides an overview of the methodological framework that will be developed throughout the thesis within process synthesis and environmental assessment. The aim is not to present a thorough literature review of the field, but rather to present some of the previous contributions (to be familiarized with the terms) as well as important (and more recent) review articles. In particular, the
chapter provides the basis for the following chapters. Methods and tools that will be finally adopted and used in this work will be gradually presented in the dedicated chapters.
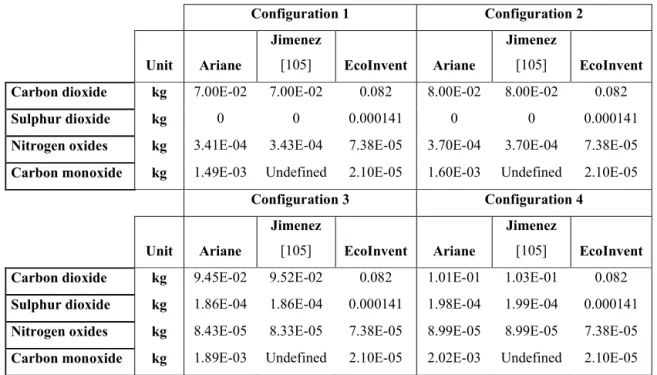
Chapter 2 explains why a system-based environmental assessment management, particularly Life Cycle Assessment is sound in an eco-design perspective, which is the core of this work. Specific attention is paid to the main issues that can be encountered with database and impact assessment. When applying LCA for chemical processes, the practitioner often faces the frustration of incomplete or missing information as well as of approximate information that does not match exactly the real situation that may introduce a bias in the environmental impact estimation. This chapter shows how process simulation tool dedicated to production utilities, Ariane, ProSim SA, can be particularly useful to fulfill environmental database gap, by the design of specific energy sub modules, so that the life cycle energy related emissions for any given process can be computed. A case study developed in this chapter concerns the environmental impact assessment of steam production by a gas turbine.
Chapter 3 presents the approach used in this work for eco-efficient process design, coupling flowsheeting simulators both for production and energy processes with a life cycle assessment module that generalizes and automates the evaluation of the environmental criteria. The approach consists of three main stages. The first two steps correspond respectively to process inventory analysis and impact assessment phases of LCA methodology for identification of the involved chemical components. It must be yet emphasized at this level that the concepts of LCA do not embody the whole life-cycle thinking, but are restricted to a cradle to gate perspective. The third stage is based on the interaction of the previous steps with process simulation for environmental impact assessment and cost estimation through a computational framework. The well-known benzene production by Hydrodealkylation of Toluene (HDA) process illustrates the proposed approach.
Chapter 4 explores the potential of multi-objective optimization (MOO) to search for solutions that satisfy both economic and environmental criteria. The use of multi-objective optimization methods generally leads to a set of efficient solutions, the so-called Pareto front. The next step consists in identifying the best ones. This MCDM (Multiple Choice Decision Making) issue is also a complex problem, mainly because of its more subjective nature. The development of a decision-support system that automates the various elements of the framework will be presented.
Chapter 5 illustrates the framework on a biodiesel production process from vegetable oils which is one of the foremost alternative fuels to those refined from petroleum products.
Chapter 6 sums up the work and highlights its contributions before giving suggestions and directions for further research.
1 INTRODUCTION AND MOTIVATION
Résumé
Ce chapitre introductif a pour objectif de positionner ces travaux dans le domaine de l’éco-conception de procédés. Le concept d’éco-conception est défini et les métriques particulièrement adaptées aux industries de procédés sont présentés : métrique de l’AIChE, de l’IChemE, impacts potentiels de la méthode WAR (Waste Algorithm Reduction), indice de durabilité (SPI), critère exergétique et indicateurs de la méthode d’Analyse du Cycle de Vie. Les principes et limitations de méthodes d’éco-conception de procédés sont ensuite exposés à partir d’une analyse bibliographique. Le cadre méthodologique des travaux est alors justifié et exposé : l’accent est clairement mis sur la nécessité de coupler des outils de simulation de procédé et de production d’énergie avec des outils systémiques de gestion environnementale notamment par Analyse du Cycle de Vie ainsi qu’avec des méthodes d’optimisation multi-objectif et d’aide à la décision multicritère.
C
HAP
TER
Nomenclature Acronyms AIChE AP ATP CE CExC CFC-11, CCl3F C2H4 CO CO2 CExC EB EPA GHG GSK GWP HDA HTPE HTPI IChemE LCA LCC LCSA LC50 LD50 NOx ODP PCOP PEP PEI PSE RME SETAC S-LCA SPI
American Institute of Chemical Engineers Acidification potential
Aquatic toxicity potential Carbon efficiency
Cumulative exergy consumption Trichlorofluoromethane
Ethylene
Carbon monoxide Carbon dioxide
Cumulative exergy consumption Environmental burden
Environmental Protection Agency Greenhouse gas
GlaxoSmithKline Global warming potential
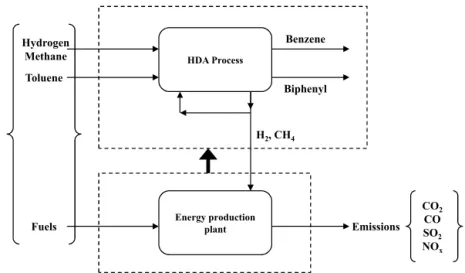
Benzene production by toluene hydrodelakylation
Human toxicity potential by inhalation or dermal exposure Human toxicity potential by ingestion
Institution of Chemical Engineers Life Cycle Assessment
Life Cycle Costing
Life Cycle Sustainable Analysis Lethal concentration 50 Lethal dose 50
Nitrogen oxides
Ozone depletion potential
Photochemical Oxidation Potential Process Economic Program Potential environmental impact Process Systems Engineering Reaction mass efficiency
Society of Environmental Toxicology and Chemistry Social Life Cycle Assessment
TTP VOCs WAR
Terrestrial toxicity potential Volatile Organic compounds Waste Reduction Algorithm
Symbols atot ain H+ IPC in IPC out IPE in IPE out IPC PEn It Gen FEi MN Np FPi,N SO2 Wm-2
Impact per unit of good or service in a specific area Available surface of goods and energy per person Hydrogen ions
Input rates of the PEI for the chemical process Output rates of the PEI for the chemical process Input rates of the PEI for the energy production process Output rates of the PEI for the energy production process
PEI outputs associated with the energy losses of the chemical and energy
Generation rate of the impact inside the system Environmental burden i
Mass of the emitted substance N
Number of goods or services produced by the process
Impact potential factor of the substance N related to the environmental burden i
Sulphur dioxide Unit radiation
The concept of sustainable development is based on the creation of transportation using processes and non-polluting systems, which preserve the energy resources and raw materials while being economically viable. The process industry has a unique position since it transforms raw material feedstock into intermediate and end-user products and thus sits at the core of almost all industrial value chains and applications. From this position, it fulfills an enabling role for improved competitiveness whilst drastically reducing resource and energy inefficiency and the environmental footprint of the industrial activities. It is now widely recognized that all the major components in the process industry holistic value chain have to be considered (see Figure 1.1), including raw materials, feedstocks and their source, conversion processes, intermediate and/or end-user needs and also waste streams. It is therefore important that both the separate components and especially the integrated holistic view are taken into account. For this purpose, the time of “eco-efficiency”, which aims to promote a more “efficient” use of raw materials and energy in order to reduce the economic costs and the environmental impact of production simultaneously must be followed by an era of “eco-design”, where environmental parameters are taken into consideration right from the design of the product and process. The “eco-design” thus appears to be the operational contribution of sustainable development.
Figure 1.1 Value chain schematic from SPIRE [1]
In this context, process engineering must play an important role for two main reasons: (i) the production induced by this type of industry, which contributes significantly to the national income, is essential for the modern company: the development of the company depends on the chemical industry and vice versa; (ii) a large number of environmental issues are either directly related to such processes or to the use of chemical products through impacts on water, air, and soil. The chemical industry develops the products for multiple consumer markets, which have to be manufactured, used, and recycled by specific, safe, and economically viable processes. It is therefore necessary to improve the 1.1 Introduction
existing processes and to invent new processes that avoid waste production at the beginning rather than collecting and treating waste products, thus passing from a curative approach to a preventive approach (see Figure 1.2).
Figure 1.2 Comparison between traditional chemical process and greener process
This vision that takes into account the product–process lifecycle and expands the scope of investigation, involves a systemic approach. It is part of the concerns of the “roadmaps” published in the last 10 years and stated through the 12 principles of green chemistry [2], 12 principles of green engineering [3], challenges for engineering outlined by the American National Academy of Engineering [4], or the roadmap of the IchemE, 21st Century Chemical engineering (IChemE roadmap, UK, 2007, 2013) [5].
The present work deals with the development, implementation and application of economic and environmental concepts in the design stage of a chemical plant that will be further referred “eco-design”. It is recognized that process design reflecting an integrated perspective across all the environmental concerns will lead to significant environmental improvement. Instead of focusing on economic performance of chemical process, designers currently incorporate environmental concerns as design objectives at early stages of chemical process development in the context of environmental impact minimization. Environmental concerns are forcing chemical process designers to change their practices in process design and decision-making. In that context, process design methods and tools are required which help achieve environmental impact minimization at a desired economic performance. Therefore, process design is a multi-objective problem in the context of cleaner production and this work is a contribution to reach some of the strategic objectives described above and will be targeted at the development of an integrated approach between:
Life Cycle thinking for the production of chemicals and utilities in order to find solutions for more efficient processing and energy systems for the process industry;
and process modelling, simulation and optimization for design and systems engineering
Chemical Process Raw Materials, Energy Products Wastes Pollution Control Modified Chemical Process Raw Materials, Energy Products Wastes Pollution Control Recycle Traditional Process
Greener Process Higher income,
Higher operating costs
methodologies, as essential to optimize existing and prospective processes. Using process modelling based on eco-efficiency and economics is a requirement for knowledge-based decision making to enhance process sustainability.
This introduction chapter is divided into 4 sections. Section 1 has just presented the general scope of this thesis that will be further refined along the presentation. Section 2 focuses on the presentation of the metrics that can be used for sustainability, more particularly on the metrics that is relevant to process eco-design. It begins with a classification of the sustainability metrics and then presents the metrics that are reported in the dedicated literature. Particular attention is given to AIChE and IChemE metrics and their applications; to the categories of environmental impact potential in the so-called WAR method that is largely reported in the process systems engineering community; to the aggregated Sustainable Process Index (SPI) that can be viewed as an ecological footprint of a process, to the exergy approach which has been receiving more attention and finally to the metrics developed in environmental system-based management tool such as Life Cycle Assessment. Section 3 shows an overview of the methods and approaches currently used for the design of sustainable systems and processes. It introduces major life cycle approaches such as life cycle analysis, industrial ecology, green chemistry, green engineering and waste management. Finally, Section 4 deals with the main objectives to be achieved in this work.
Sustainability is a holistic, multidimensional and multi-sectorial concept. Sustainability assessment is a combination of different assessment methods and tools including environmental, economic and social aspects. When assessing sustainability, a life cycle approach must be applied to avoid problems shifting from one life cycle stage to another. Life Cycle Assessment (LCA) is a methodology to evaluate the environmental impacts throughout the life cycle of a product. Life Cycle Costing (LCC) and Social Life Cycle Assessment (S-LCA) aim to complement the environmental LCA. Eco-design takes the environmental aspects into account already at the product design phase and aims at reducing the environmental impact of products throughout their entire life cycle. Eco-efficiency assessment is an environmental management tool that enables the consideration of life cycle environmental impacts of a product system alongside its product system value to a potential user or customer. It generally focuses on a more efficient use of raw materials and energy in order to reduce the economic costs and the environmental impact of production simultaneously whereas in eco-design, environmental parameters are taken into consideration from the earlier design stage of the product and process. Furthermore, methodologies like risk assessment can also be applied.
1.2 Metrics for sustainability and eco-design for processes
Azapagic proposed in [6] a classification of criteria (Table 1.1) for sustainable development. It must be highlighted that some of them are often considered routinely in conventional design, especially the microeconomic criteria (e.g. costs and profits), some environmental criteria (e.g. energy consumption and water), or social criteria (e.g. employee health and safety).
Table 1.1 Classification of criteria for sustainable development in process design according to [6] Economic criteria Environmental criteria Social criteria Micro-economic o Capital costs o Operating costs o Profitability o Decommissioning costs Macro-economic o Value –added
o Taxes paid, including “green taxes” (e.g. carbon tax) o Investment (e.g. pollution
prevention, health and safety, decommissioning and ethical investments) o Potential costs of environmental liability Energy use Water use Water discharge Solid waste
Abiotic reserve depletion Global warming Ozone depletion Acidification Summer smog Eutrophication Human toxicity Eco-toxicity Provision of employment Employee health and safety Citizens’ health and safety Customer health and safety Nuisance (odour, noise,
visual impact and transport) Public acceptability
It is generally accepted that sustainability results from a balance among the three components. The selection of an appropriate set of indicators for assessing the sustainability is essential for a comparative analysis between the different versions of a process. In order to provide a method applicable for the analysis of systems regarding to the sustainability aspect, a typology of indicators is proposed in [7], classifying the 3D of sustainable development into three distinct hierarchical groups: (i) 1D indicators that provide information on a single component: economic, ecological, or social component; (ii) 2D indicators that simultaneously provide information on two components: socio-ecological, socio-economical, or economic-ecological components; and (iii) 3D indicators that lead to 3D information on the three pillars.
To illustrate, let us consider the amount of non-renewable energy used to produce a unit quantity of final product, i.e., a criterion taken into account in the metric proposed by the AIChE [8]. This criterion does not provide the information on a single branch coming under the economic, environmental, or societal aspect alone. The 3D aspects are implicitly integrated and are called as a 3D indicator. Considering now the indicator based on manufacturing cost, it provides information on both the economic and social aspects, so that it can be viewed as 2D indicator. In this chapter, the goal is
not only on completely identifying all the metrics proposed and applied in the processes of chemical industry, but also on highlighting the most important in relation to a decision-making objective. It is useful to distinguish among the indicator, index, and metric beforehand. An indicator is a tool for simplification, quantification, and communication of the information; it is the first level of base series analysis. Ideally, according to the classification in [7], an indicator of sustainable development should satisfy the three components simultaneously. However, the construction and selection of such indicators are not direct and hence subjected to numerous studies (see for example [9]). A good indicator must meet several requirements related to the technical soundness, the relevance relative to the stakeholders, the cost relative to data collection, reliability, spatial and temporal boundaries, ease of interpretation, access to a comparison standard, and the ability to show trends in the evolution over time. However, a reliable indicator can be difficult to interpret, thus failing in its function of communication. In most of the cases, the assessment of indicators involves either a standardization or comparison with a predefined value, to facilitate its interpretation (e.g. the percentage of renewable energy used with respect to the national average). An indicator is therefore an observable variable, which is used to characterize the complexity of a phenomenon. The term index refers to a synthetic indicator built by aggregating other basic indicators. The other way to characterize the different aspects of a complex phenomenon is to use a set of indicators in a metric. The utility of a metric is necessarily related to the number of indicators: an inadequate number is likely to misrepresent the phenomenon and a large number may make the implementation cost prohibitive.
The advantage of a single index instead of a collection of indicators lies in the ease of communication (e.g. ecological footprint). However, many drawbacks can be highlighted: loss of details and accuracy due to the combination of parameters with different orders of magnitudes and levels of accuracy, and usage of conversion ratio to express all the variables with the same units. This chapter considers only the currently available approaches to assess the sustainability of processes and new or existing systems. It lists the most significant examples of indicators, indices, or metrics used in the process industries. The economic indicators, widely used in the traditional methods for process design will not be presented in detail. The reader can refer to reference books in this field (e.g. [10]). The design methods based on these indicators will complement this chapter.
In order to analyse the sustainability of a process, the two metrics developed by the AIChE (1D) and IChemE (3D) should be mentioned initially, which consider indicators that are particularly adapted to the process domain and to a production system. The works conducted in Canada (Canada’s National Round Table on the Environment and the Economy) [11] can be mentioned beforehand. These works 1.2.2 AICHE and ICHEME metrics
recommend eco-efficiency measures defined by the ratios, by considering resource uses or environmental impacts as the numerator and value creation as the denominator or vice versa.
1.2.2.1 AIChE metrics
Following these principles, the eco-efficiency metrics are refined for applying at the operational level by the American Institute of Chemical Engineers (AIChE2) in collaboration with a non-profit
organization, BRIDGES to Sustainability Institute (formerly known as BRIDGES to Sustainability). The metrics, proposed in terms of eco-efficiency, includes:
material consumption: the usage of materials, non-renewable materials, and in particular, materials with finite resources, affects the availability of resources and leads to environmental degradation relative to raw material extraction and during conversion as discharges;
energy consumption: apart from the aspects related to its availability and usage as a resource, the use of energy leads to varied environmental impacts. For example, the burning of fossil fuels provides impact on global warming, oxidation of photochemical ozone, and acidification;
water consumption: fresh water is essential for life and almost for all economic activities. As there is an increase in anthropogenic demands and depletion of water resources in some regions of the world, water consumption is a key factor;
emission of polluting products; solid waste;
land use: the soil is considered to be a finite resource that provides varied ecological and socio-economic services. However, the definition of an indicator seems to be complicated and does not appear explicitly in the basic metrics.
The choice of ratios to express the metrics facilitates the comparison between several options and, on the other hand, the choice of the process during the decision-making phase. Lower the indicator, weaker is the impact generated per unit of value created. Heuristics and decision rules were developed and tested on more than 50 industrial pilot projects involving more than 50 processes of the chemical industry from the data of the Process Economic Program (PEP) at SRI International (Menlo Park, California) [8]. The indicator values were calculated for standard flowsheets.
1.2.2.2 IchemE metrics
Significant efforts to establish the metrics for sustainable development have also been made under the aegis of the IChemE (UK) [12] by adding the economic and societal metrics to the metrics focused on the environmental aspects. The indicators are specifically grouped into environmental, economic, and
social categories. The list is particularly suitable for a production site. The environmental indicators are related to the resources or categories of environmental impacts. The metrics involve two types of quantitative indicators, which are the environmental burdens and the impacts. The first group includes the use of material and energy, the emissions in air and water, and the amount of solid waste. It is obtained from the flowsheet and material and energy balances. The information obtained from the burdens can then be used to calculate the environmental impacts.
As mentioned above, most of the indicators of the metrics are calculated as ratios to provide the measure of impact regardless of the scale of the operation. They are based on a simple rule: the process is more efficient that the indicator is low. They involve both the process inputs (use of resources) and outputs (emissions, effluents, discharges, products, and services). They involve a subset of the impact factors used in environmental science, the most significant vis-à-vis the process industries, for the calculation of environmental burdens. The environmental burden (EB), caused by the emission of a range of substances, is calculated by adding the weighted emissions of each substance. The potential factor of the impact is identified as the impact factor of each substance. We note that a substance may contribute differently to different environmental burdens and have different impact factors: N i, N i = M FP FE
∑
The EB are determined with respect to a reference substance (e.g. SO2 for air acidification). This
approach involves a total of 49 indicators. However, the life of the chemical products in various media is not taken into account. In addition, the indicator on human health (normalized with respect to benzene) is limited to carcinogenic effects.
The metrics for sustainable development can be used at different levels in the process of decision-making:
evaluation of technical (variety of raw materials, options of process improvements, etc.) or financial (variety of suppliers, etc.) alternatives;
comparison of industrial units;
identification of environmental impacts of an industrial unit.
They can also be used for communication with the stakeholders. It must be emphasized the metrics of sustainable development are becoming more and more complex by both their content and methodology [13]. The examples of the previous two metrics show that the choice of appropriate indicators depends on the specificities of the concerned industrial sector or even the product types. 1.2.3 Using metrics for sustainable development
According to Lapkin et al. [14], the indicators should reflect the by-products, discharges, and emissions characterizing the process or the product, and also the necessary resources to provide a service. It is therefore difficult to provide a universal list of indicators. It seems more appropriate to analyse and explain the choice of indicators in a number of typical situations. Two examples reported in the literature can be mentioned here:
example of GlaxoSmithKline (GSK): the use of sustainable development metrics within this pharmaceutical company is described in [15]. In order to adapt the metrics for its own requirements, GSK has developed specific “green” metrics, including indicators related to the atom efficiency, carbon efficiency (CE), and reaction mass efficiency (RME) or the unavoidable energy of solvents. The CE indicator takes into account the efficiency and amount of carbon in the reactants, which is incorporated in the final product. RME takes into account the efficiency, molar amount of reactants, and atom efficiency. Examples of calculation are proposed in [16];
example of BASF: an eco-efficiency analysis developed in BASF is described in detail in [17] and [18]. On the basis of the lifecycle assessment method, the approach used the metrics based on the usage of resources and calculations of environmental impacts, health, and safety. The usage of normalization and weighting method to generate an environmental performance index were illustrated through examples (particularly the production of indigo or ibuprofen). The approach extended to cover the aspects of “socio-effectiveness” by including the social aspects of sustainable development [19], and by developing a software tool SEEbalanceTM [19]. The methodology was applied initially during the phases of product and process developments. It was then implemented for the development of industrial and communication strategies towards industrial customers and other partners in the value chain.
1.2.4.1 Principles
As it was difficult to provide all the information required for calculating the indicators of a metric at the preliminary design stage of a process, a number of studies were directed toward the development of an environmental balance. A method, commonly cited in the literature and identified by the term waste reduction algorithm (WAR), is based on the concept of environmental balance, similar to material and energy balances. This is not a tool for life cycle assessment, as the approach is essentially based on the process and generation of utilities associated with the lifecycle of the product and does not include the other phases: raw materials acquisition, distribution, usage, and recycling of the product (see Figure 1.3).
This method is used in the design phase of a process and uses the process information (flow rates and mass fractions) as well as the toxicological data to calculate the environmental impact of a process. It requires the usage of flowsheeting software. This American method was developed in the EPA (Environmental Protection Agency, National Risk Management Research Laboratory) which take into account the environmental aspect right from the design phase of the process. The approach is based on the calculation of the potential environmental impact (PEI) of a process, which results from an environmental report. This type of balance must be carried out during the design phase of a process, similar to the material and energy balances. The result of the PEI balance is the calculation of an impact index (I) that provides a quantitative measure of the impact of the discharge of a process. The objective of the methodology is to minimize the PEI for a process rather than minimizing the amount of waste generated by the process. The concept of potential environmental impact of the WAR algorithm is based on the traditional mass and energy balances. The method is presented in [20].
The objective of the WAR algorithm is to provide a means for comparing the potential environmental impact between the process design alternatives: lower the index, more environmental friendly is the process.
Figure 1.3 Inclusion of energy in the WAR algorithm (according to [21])
1.2.4.2 Categories of environmental impact potential in the WAR method
The toxicological data are classified into eight environmental impact categories: global warming potential, acidification potential, ozone depletion potential, photochemical oxidation or smog formation potential, human toxicity potential by ingestion and by inhalation, and aquatic and terrestrial toxicity potentials. The classification of these impact categories is based on a study in [22]. These categories have been proposed to highlight the most representative indicators in relation to the design
of a process. These indicators can be classified into two domains: global atmospheric domain and local toxicity domain. A brief description of these impacts categories is described below.
The global warming potential (GWP) is an index that compares the contribution of a greenhouse gas emissions to global warming with that of carbon dioxide (CO), Carbon dioxide (CO2) being the
reference substance, its GWP is equal to 1. The GWP takes into account the measurement of radiation force (amount of infrared that a substance can absorb, ai in Wm−2) induced by a molecule with
concentration Ci in the atmosphere in ppm. This is followed by the integration of the radiation force
over a given period of time (usually 100 years):
dt C a dt C a GWP CO CO n i n i i 2 2 0 0
The Acidification Potential (AP) of a compound is related to the number of moles of H+ created per number of moles of compound X according to the reaction:
.... H .... X
X denotes the chemical substance initiating the acidification, and the molar stoichiometric ratio α
represents the ratio of the number of moles of H+ per mole of X. Acidification is usually expressed in terms of mass (ηi, mole H+/kg):
i i i M
where Mi denotes the molecular weight of X (kg i /mole i). As mentioned before, a reference
compound SO2 is used to express the acidification potential:
2 SO i i AP
Ozone depletion potential (ODP) in the stratosphere is based on the calculation of the variation in time and space of O3 concentration ( δ [O3]) due to the emission of a specific gas with respect to the same
amount for a reference compound, trichlorofluoromethane (CFC-11, CCl3F).
The photochemical oxidation potential or smog-forming potential (Photochemical Oxidation Potential, PCOP) quantifies the contribution to the smog phenomenon (photochemical oxidation of certain gases, which produces ozone). It is expressed in equivalent ethylene, C2H4.
These four indicators (GWP, AP, ODP, and PCOP) depend on the global or regional atmospheric domain (see Table 1.2).
Table 1.2 Environmental impact categories used in the WAR algorithm Local toxicological Global
atmospheric impact
Regional atmospheric
impact Impact on man Ecological
Human toxicity potential by ingestion (HTPI) Human toxicity potential by inhalation or dermal exposure (HTPE) Aquatic toxicity potential (ATP) Terrestrial toxicity potential (TTP) Global warming potential (GWP) Ozone depletion potential (ODP) Acidification potential (AP) Photochemical oxidation potential or “smog”-forming potential (PCOP)
The Human Toxicity Potential by Ingestion (HTPI), Human Toxicity Potential by Either inhalation or dermal Exposure (HTPE), Aquatic Toxicity Potential (ATP), and Terrestrial Toxicity Potential (TTP) are related to the local toxicological domain. As a first approximation, the lethal dose 50 (LD50) or LC50 (lethal concentration 50) is used to estimate HTPI. This indicator measures the dose of substance causing the death of 50% of a given animal population (often mice or rats) under specific experimental conditions. ATP is estimated from the study of the effects on the “fathead minnow” (Pimephales promelas). Data are expressed in the form of a concentration causing death (LC50) for 50% of the organisms exposed to a substance for a given limited duration.
1.2.4.3 Application of the WAR algorithm
The WAR algorithm has been used on many processes and the application process is well illustrated in process test cases (we can refer to the works in [23] and [24] on penicillin or benzene by toluene hydrodealkylation production processes).
Another approach to analyse the sustainability of a process is based on the calculation of an aggregate indicator proposed by Krotscheck and Narodoslawsky [25], the SPI (Sustainable Process Index), an expression of the ecological footprint concept for a process that measures the total environmental impact of various human activities. The SPI calculation is based on the mass and energy balances of the process. It is independent of the legal standards that can vary over time, making it particularly attractive. The aim of the SPI is to compare the mass and energy flows generated by human activities to natural material flows, on a global and local scale. In this approach, the planet is seen as a 1.2.5 SPI (Sustainable Process Index)
thermodynamically “open” system, i.e. open to the flow of solar radiations toward its surface and which emits energy in the universe. Solar radiations are the only natural driving forces for all the environmental processes and those resulting from human activities. They constitute a limited flow, although available indefinitely, which is received by the planet’s surface. This means that all natural processes or those induced by human activities require some part of this limited flow and a certain surface: in other words, technological processes compete with each other and with the natural processes for this surface, which is a limited resource. Human activities impact the environment in several ways: any process considered in a “cradle to grave” analysis requires raw materials, energy, facilities, staff, and rejects waste or emissions into the environment. The total area to integrate a specific process in the ecosphere in a sustainable manner is then given by:
Atot=AMP+AE+AI+AS+AD [m2]
where AMP represents the area for the extraction of raw materials, AE denotes the area relative to the
energy resource, AI denotes the area relative to facilities, AS denotes the area relative to staff, and AD
denotes the area to discharge all waste and emissions. Processes produce services or goods. The impact per unit of good or service is represented by a specific area atot:
P tot tot N A = a
where NP represents the number of goods or services produced by the process, such as the amount of
kilowatt per hour produced by a specific energy system. The reference period is generally one year. Finally, we can link this specific area, for the production of a certain good or service, to the statistically available area per person to provide goods or services in a sustainable manner. The following ratio defines SPI as:
in tot a a SPI
where ain is the available surface relative to the annual supply of goods and energy per person. It is
usually estimated by dividing the total area of a region by the annual number of its inhabitants. Actually, the SPI indicates how much of the area, which is theoretically available per person to ensure their livelihood under sustainable conditions, is used for the production or the service in question: as the SPI (or atot) gets lower, the impact on the ecosphere to provide the good or service also becomes
lower. A key point of the SPI assessment is the ability to specify and compare the different impacts of a technology. The detailed description of the SPI calculation and application would go beyond the scope of this chapter. Readers may refer to the articles by [25] and [26], which illustrate this approach. The authors propose correlations to determine the different areas [27]. An interesting case study of this indicator is proposed in [28] for the case of a bioprocess (penicillin production).
In order to provide a more comprehensive analysis of the interaction of environmental burdens and financial costs, an environmental performance strategic map has been proposed, based on the combination of different footprints [29]: carbon footprint [30], [31], water footprint [32], energy footprint (renewable, non-renewable) [33], and footprint due to emissions (air, water, and soil) [34].
Another way to define a sustainable development indicator is to use exergy. A presentation of all the concepts is proposed in two parts in [35], [36]. The use of exergy [37] makes it possible to quantify, on the whole, the resources consumed and the emissions into the environment, to the extent that it is a physical magnitude that can integrate mass and energy transfers. Exergy analysis is based on the combination of the first (energy conservation) and second principle (development of entropy, consideration of irreversibilities, and energy degradation) of thermodynamics [38], [39]. Due to the generation of entropy, the energy available in the outgoing products (exergy of outgoing products) is lower than the one available in the resources. This deterioration in quality is quantifiable by exergy destruction and is involved in physico-chemical processes, either in the natural ecosystem (biomass production, for example) or in the industrial ecosystem (production, consumption, etc.).
The first applications of exergy analysis in the 1980s mostly focused on the analysis of industrial systems. The research in this area includes both methodological developments and applications to specific industrial processes and to their supply chain. Let us note that many studies have been conducted on the combination of exergy analysis and “pinch” methods (e.g. [40], [41]). Cumulative exergy consumption (CExC) extends the exergy analysis beyond the simple process to consider all the processes from natural resource extraction up to the final product. Here again, the major interest of this overall analysis is to provide guidelines for the improvement of one of the involved processes and to compare several approaches [42][MOR 91].
Decision support systems and techniques based on the combination of exergy and economic analysis concepts have also been developed, thereby leading to an exergy cost. Exergy analysis was applied to various energy conversion and chemical processes, particularly comparing different energy sectors [43], [44]. It is particularly interesting for cogeneration systems, as it puts the various involved energy sources on the same energy sector ([45], [46] for example).
Life Cycle Assessment (LCA) is an environmental management tool that enables us to identify and quantify the environmental impacts of a product, a service or activity from the “cradle to the grave”, 1.2.6 Exergy as a thermodynamic base for a sustainable development metrics
i.e. from the extraction of raw materials up to its end of life processing (waste, discharge, incineration, recycling, etc.). Its methodology will not be presented here in detail, since it is the subject of a specific chapter of this thesis (see Chapter 2) dedicated to the choice of a system-based environmental management technique. An excellent summary of the use of LCA and its prospects is proposed in [47].
Main methods of impact categories
There are different methods to translate the inventory results into environmental impact indicators at different levels. There are generally classified into two broad categories based on their position on the continuum of the cause and effect chain, the “mid-point” methods on the one hand, and the “end-point” methods on the other hand:
“mid-point” methods, the most recognized and currently used methods, are used to characterize the inventoried flows into potential impact indicators (or mid-point indicators), of about a dozen in number. They model the impact relatively closer to the environmental flow and hence consider only part of the environmental mechanism. Their advantage is to reduce uncertainty. Mid-point methods include: the CML 2001 baseline method of the Leiden University in the Netherlands [22] which has a broad consensus, or the EDIP 97 or 2003 method [48]. This method, particularly used in Scandinavia, models the impacts corresponding to higher-order effects. It enables a better communication but is more uncertain because of the many hypotheses that it involves. The impact categories commonly considered in mid-point methods generally involve global warming, ozone layer depletion, tropospheric ozone formation, acidification, eutrophication, toxicity, ecotoxicity, resource depletion, and land use;
“end-point” methods model the impacts relatively far in the environmental mechanism, i.e., which act directly as damages to human health, ecosystems, and resources. These indicators are more relevant in terms of communication and are therefore more simple to use, but their modelling is more uncertain due to the complexity of the mechanism and difficulties to completely model it. Typical methods are the EPS [49] and Eco-Indicator 99 [50] methods. The damage types concern human health, biotic and abiotic natural environment and resources, and the human environment;
point and end-point methods: some methods model the impacts both in terms of mid-point and end-mid-point (Impact 2002 + method [51]).
The advantages and disadvantages of the methods of impact categories and indicators have been extensively presented [52]. Some users prefer mid-point indicators because they describe the impacts in the cause and effect mechanism at the earliest and prevent the accumulation of uncertainties when modelling the indicators to the closest end point [53].
In a review article on the past, present, and future of LCA [47], it is mentioned that the development of the LCA has undergone various phases, which eventually included the method as a decisional tool for environmental management, in order to design sustainable products, processes, and systems:
past of LCA (1970–2000): there were two periods. Initially, the (1970–1990) period with two decades of method design with often divergent approaches, terminologies, or even results, thus showing the absence of scientific discussions and exchange platforms about this method. This was followed by a decade of standardization with efforts in the scientific activity and coordination of activities (works of the SETAC, definition of standardization activities (especially ISO 14040 Environmental management – life cycle assessment – principles and framework);
current LCA (2000–2010): this period is characterized as the decade of development of the methodology.
However, the LCA method, as mentioned explicitly, is interested only in the environmental component of the life cycle assessment. The current challenge is clearly the extension of the methodology to other components of sustainable development (LCSA, Life Cycle Sustainable Analysis).
Given their role as a large-scale provider of material goods within society, the chemical industries consume large amounts of non-renewable resources and emit wastes. The chemical and petrochemical sector is by far the largest industrial energy user, accounting for roughly 10% of total worldwide final energy demand and 7% of global GHG emissions [54]. The European chemical industry has already made significant efforts to reduce its GHG emissions. Between 1990 and 2008, it reduced its GHG emissions by 42% in absolute terms and by 66% in specific terms, i.e. per unit of production.
With a reduction of 96 million tonnes of carbon dioxide equivalents since 1990, the chemical industry alone has achieved nearly one third of the EU commitment under the Kyoto Protocol to reduce GHG emissions by 8% between 1990 and 2012.
Even if environmental gains are substantial, the situation needs to be further improved as a major user of raw materials, both for energy and as feedstocks, the chemicals industry still significantly impact on 1.2.8 Toward a sustainable life cycle assessment
1.3 Process design methods and sustainable systems 1.3.1 Positioning of chemical process industries
the supply of non-renewable resources and, as these materials are, in general, based on hydrocarbons, combustion of these sources can lead to emissions of carbon dioxide (CO2) – GHG – and volatile organic compounds (VOCs) and nitrogen oxides (NOx) which contribute to the formation of tropospheric ozone or “smog”. Next, the processing of the raw materials and feedstocks can result in the release of hazardous pollutants to the environment (e.g. propylene) from emission stacks, discharge pipes, storage tanks and other equipment. Of all the sectors of the chemicals industry, the basic chemical sector is generally the largest emitter (by volume) of such pollutants because these bulk chemicals are usually produced in high volumes at large plants.
During normal operations, workers can be exposed to pollutants in a gaseous or liquid form, for example by inhaling a pollutant emitted from leaks in equipment or splashing the substance on the skin or in the eyes. Larger accidents involving chemicals can also occur due to equipment failures. Major spills can result in inadvertent releases to workers, the surrounding neighbourhood or perhaps even communities and the environment at some distance from the plant. At the conclusion of each stage of the process, the product is transported, via pipeline, rail, barge/tanker or truck, to the next user for further processing. This can be as close as another part of the same plant, or as far as another company located in another country.
Due to the complexity of the problem, this work will be restricted to the earlier design stage. At this level of the presentation, it can be said that the framework will be developed under the following assumptions:
transportation will not be taken into account;
only the case of normal operating conditions will be explored. The case of degraded conditions will not be considered;
the case of fugitive emissions will not be taken into account even if they are among the major concerns of industrial process releases, since they cause problem to various aspects including the environment, health, and economic. We are aware that the early evaluation of process hazards is beneficial because process can be made inherently benign at lower cost. Their quantification and the prevention strategies are yet out of the scope of this work.
at earlier design stage, the choice of the materials in which the different equipment items will be built is generally not finalized. This aspect will not be taken into account in the evaluation of the environmental component.
As abovementioned, chemical products have a twofold effect on greenhouse gas emissions. Greenhouse gases are emitted in the manufacturing of chemical products that is the focus of this PhD 1.3.2 Several roads to more sustainable processes and systems
work, while at the same time the use of many of these products enables significant reductions in global emissions. Clearly, the environmental impacts have to be assessed across the entire product lifecycle – from production to the final disposal.
Many chemical products enable GHG abatement either because their production footprint is smaller than that of the non-chemical alternatives, or because their use results in fewer emissions than would be the case without their use or with non-chemical alternatives. They therefore, have an important role in contributing toward sustainable development. Specifically, to enhance their long-term sustainability, various environmental considerations including reducing raw material and energy usage, switching to renewable feedstock, and waste reuse and recycling needs to be implemented. Certainly, such measures would require changes to existing processes – ranging from simple modifications of the design and operation to more intrusive options such as material substitution and technology upgradation.
Several techniques have been used for improving sustainability as well as value chain interaction: such as industrial ecology, life-cycle assessment (LCA), green chemistry/engineering, and waste minimization. These techniques are not mutually exclusive but each seeks to improve the sustainability of a plant from a different perspective.
1.3.2.1 Industrial ecology
At a geographical cluster level, the concept of industrial ecology tends to improve the environmental impact of a plant by favouring waste exchange, recycle, and reuse with other plants ([55], [56]) in proximity. The determination of the conditions that underpin industrial symbiosis and associated framework conditions, as well as how different actors within value chains establish and maintain inter-organisational relationships to develop processes for industrial symbiosis, i.e., optimizing waste valorisation within and between sectors, are receiving increasing attention. One example of the successful implementation of this industrial symbiosis is the Kalundborg industrial park in Denmark [57], where an oil refinery, power station, gypsum board facility, pharmaceutical plant, and the city itself, share water, steam, and electricity resources, and also exchange a variety of wastes. This leads to a 25% reduction of the fresh water usage, 2.9 million tons of material recycling, and energy for heating 5 000 homes.
1.3.2.2 Life Cycle Assessment
In the previous section, only the environmental metrics associated with LCA has been considered. Here, LCA is viewed as an environmental system-based management tool that can be used for elucidating the environmental burdens over the entire life-cycle of the product, starting from raw
![Table 1.1 Classification of criteria for sustainable development in process design according to [6]](https://thumb-eu.123doks.com/thumbv2/123doknet/3539894.103662/23.918.116.785.262.633/table-classification-criteria-sustainable-development-process-design-according.webp)