Science Arts & Métiers (SAM)
is an open access repository that collects the work of Arts et Métiers Institute of
Technology researchers and makes it freely available over the web where possible.
This is an author-deposited version published in: https://sam.ensam.eu Handle ID: .http://hdl.handle.net/10985/11514
To cite this version :
Guilhem GRIMAUD, Nicolas PERRY, Bertrand LARATTE - Life Cycle Assessment of Aluminium Recycling Process: Case of Shredder Cables - Procedia CIRP - Vol. 48, p.212-218 - 2016
Any correspondence concerning this service should be sent to the repository Administrator : archiveouverte@ensam.eu
Peer-review under responsibility of the scientific committee of the 23rd CIRP Conference on Life Cycle Engineering.
23rd CIRP Conference on Life Cycle Engineering
Life Cycle Assessment of Aluminium Recycling Process: Case of Shredder
Cables
Guilhem Grimaud
a,b*, Nicolas Perry
b, Bertrand Laratte
caMTB Recycling, F-38460 Trept, France
bArts et Métiers ParisTech, I2M, UMR 5295, F-33400 Talence, France cUniversity of Technology of Troyes, CREIDD, UMR 6281 F-10004 Troyes, France
* Corresponding author. Tel.: +33 (0)474 928 768. E-mail address: Guilhem.grimaud@ensam.eu
Abstract
Life cycle impact of European generic primary and secondary aluminium are well defined. However specific recycling processes are not available in literature. In this study, the environmental assessment of cable recycling processing is examined. The data come from a recycling plant (MTB Recycling) in France. MTB process relies only on mechanical separation and optical sorting processes on shredder cables. On the one hand, the study demonstrates huge environmental benefits for aluminium recycled in comparison with primary aluminium. On the other hand, the results show the harmful environmental influence of the heat refining by comparison with cold recycling process.
Keywords: Life Cycle Assessment, recycling, aluminium, metal refining
1. Introduction
The purpose of this study is to document the environmental impact of a recycling aluminium process, using the Life Cycle Assessment (LCA) methodology. Today, the life cycle impact of European generic primary and secondary aluminium are well defined through the work of the European Aluminium Association (EAA) [1]. However specific recycling processes are not available in literature. In this study, the environmental assessment of cable recycling processing is examined. The data come from a recycling plant (MTB Recycling) in France. The specific and innovative process was developed by MTB Recycling engineers and is sold as a process solution in different countries. The specificity of MTB process relies on the absence of fusion for metal refining. Nevertheless, it reaches standard aluminium purity up to 99.6%. This performance is obtained using only mechanical separation and optical sorting processes on shredder cables. Environmental impact assessment is done using ILCD Handbook recommendations [2]. Three systems are compared: European primary aluminium data from EAA aggregated in Ecoinvent 3.1, secondary aluminium from European remelter data from EAA aggregated in Ecoinvent 3.1 and MTB cable recycling process.
On the one hand, the study demonstrates huge environmental benefits for aluminium recycled in comparison with primary aluminium. On the other hand, the results show the harmful environmental influence of the heat refining by
comparison with cold recycling process. The study demonstrates the interest of recycling by sector rather than in blend.
The European demand for aluminium has been growing over the past few decades at a rate of 2.4% per annum [3]. This increase is mainly supported by the rise of recycling which growth was in the same time about 5% per annum [3]. The abundance and the versatility of aluminium in various applications have made it one of the top solutions for lightweight metal strategy in various industries [4]. In the cable industry, substitute copper for aluminium can considerably reduce the linear weight without degrading too much the electrical properties [5]. To obtain optimal electrical conductivity, aluminium use for cables has a purity above 99.7% [6]. Because secondary aluminium does not meet the quality requirements for aluminium cables manufacturers; only primary aluminium is used for the aluminium cables supply chain. Nevertheless, improvement in recycling could help reach quality targets, by using new sorting technologies.
Aluminium properties are not deteriorated by recycling. However, in most cases aluminium parts are mixed together at the end of life step without considering their provenance and use. According to this, the 7 series of aluminium are mixed together in waste treatment plant. All aluminium series do not have the same purity and alloying elements pollute aluminium. When aluminium series are mixed together, the cost-effective solution for refining use furnaces. As the metal is molten, the separation is done by using the difference of density and
2 Guilhem Grimaud / PROCIR-D-15-01666 buoyancy (decantation methods, centrifugation, filtration,
flotation, etc.). [7] Despite the technology optimisation, a fraction of metal is unrecyclable [8]. Some alloying elements are lost in the process [9] and this results in a drop of quality which is akin to a down-cycling [10]. The solution lies in a better separation of aluminium series upstream from the recycling chain. This strategy should enable products to be guided through the best recycling path and maintain the quality of alloys.
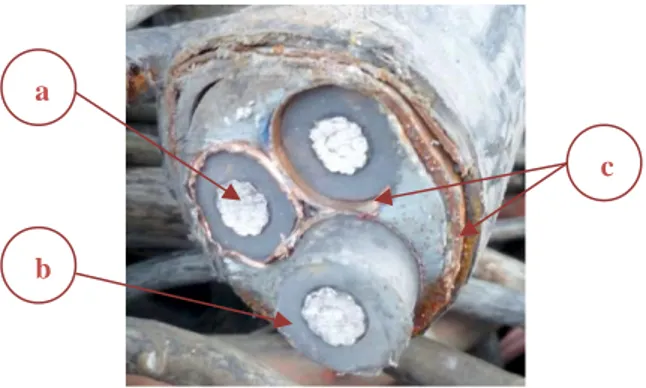
Fig. 1 Section of a cable having multiple beams of aluminium.
The cable is composed of an aluminium core cable (a), covered with a polymer thick layer (b) as illustrated in Fig. 1. Additional metallic materials (c) are coaxial integrated in order to finish the definition of this composite product. These cables are manufactured by extruding together all the materials that compose it.
Aluminium in cables represents between 35 and 55% of the total weight. Other metals are mainly steel, lead, copper, zinc. The variety of plastics contained in the sheath is even stronger than for metals: silicone rubber, Polyethylene (PE), cross-linking PE (xPE), Polychloroprene (PCP), vulcanised rubber, Ethylene Vinyl Acetate (EVA), EthylenePropylene Rubber (EPR), flexible PVC, etc. [11]
Although aluminium cables represent about 8% of aluminium products in Western Europe [12]. The inherent purity of aluminium used for cables justifies differentiate recycling channels to optimise processing steps and improve cost efficiency. At the end of life, the challenge concerns the separation of materials from each other. The most economical way to separate different materials relies on a smelting purification.
An alternative process for cables recycling uses only mechanical steps instead of thermal and wet separation, as developed for several years by MTB Recycling. The aluminium obtained by recycling cables is specially appreciated by the smelter. Its high purity makes it easy to produce a wide variability of aluminium alloys. Recycled aluminium can then be used in a large number of aluminium products and not only in applications requiring high alloy aluminium.
Numerous studies were conducted concerning the sustainability of aluminium recycling in comparison with primary aluminium. Outcomes about global and local environmental impacts show decrease up to 90% by using
recycled aluminium [3], [13]. However, systems modelling always relate to the standard melting solution for recycling aluminium. In contrast this study focuses on the environmental assessment of cable recycling in MTB specific process.
The objective of this study is, therefore, to examine the environmental benefits and energy savings of the MTB recycling system. Additionally, LCA was conducted in order to help the company to highlight environmental hotspots of the system and try to design new solutions to decrease environmental impact of aluminium produced. The data collection method does not allow the use of the results for other cables recycling processes. The results are representative only of recycling solutions developed by MTB.
2. Analytical Framework 2.1. Functional Unit Proposal
As part of this study, the functional unit used is as follows: producing one ton of aluminium intended for end-user applications, with a purity of > 97% using current industrial technologies (annual inbound processing > 10,000 t) located in Europe. The matching quality of the compared products can meet the same function as a high purity aluminium can be used for producing a large number of alloys without refining. We selected three scenarios that meet all the conditions of the functional unit:
Scenario 1 or primary: primary aluminium, resulting from mining.
Scenario 2 or secondary: secondary aluminium from recycling by melting.
Scenario 3 or MTB: MTB Aluminium, from recycling using MTB processes.
The primary aluminium production is used as a reference for guidance on the quality of production. Foremost, our analysis is intended to compare methods of recycling. Comparison with scenario 1 should help translate environmental benefits of recycling.
2.2. Sources of Data for the Life Cycle Inventory
The evaluation is designed by modelling input and output flows that describe different systems of aluminium recycling with the software SimaPro 8.04 [14]. All the flows are based on processes from Ecoinvent 3.1 library [15]. The systems are developed according to the local context of Western Europe. To allow comparison all the inventory elements are compiled based on the Ecoinvent database boundaries and data quality check [16], [17]. Once modelling were done, the characterisation is conducted according to International Reference Life Cycle Data System (ILCD) Handbook [2] recommendations. The following sections detail key aspect of the methodology.
This study compares two different modelling systems. Both systems modelling using Ecoinvent data. Scenarios 1 and 2 using available data in Ecoinvent library without any a
b
modifications. And scenario 3 using Ecoinvent data to model MTB recycling process, the inventory data set was done using the inventory data sets recommendations from JRC [18]. The three modelling rely on the same system boundary.
2.3. Presentation of the Study Scope
This study is based on a life cycle approach, in accordance with the standards of International Organisation for Standardisation (ISO 14010/44) [19], [20]. The Fig. 2 presents
the study scope used for the life cycle analysis of MTB recycling process, the boundaries are based on the Ecoinvent modelling. The boundaries include cradle to exit gate stages [21], [22]. Life in use of aluminium in the products are not included in our study scope. The study only focuses on recycling transformation steps of aluminium. As shown on the Fig. 2 by-products are included in environmental impacts calculation, but no benefit of by-products recycling is integrated into the study.
Fig. 2 Study scope for the cable recycling system boundaries
3. Scenario Development
Primary aluminium (scenario 1) and secondary aluminium (scenario 2) are used as a baseline to evaluate the MTB alternative pathway (scenario 3). The baseline scenarios refer to the Western European aluminium average consumption. The scenario 2 and scenario 3 are based on Ecoinvent unit processes modelling. Ecoinvent database uses the EAA Life
Cycle Inventory (LCI) [23]. For Ecoinvent v3.1 [24,25], the Aluminium processes are built with data collected by EAA in 2013 [26], [27]. The Ecoinvent modelling using the average technology available on the market for Western Europe [17].
The Fig. 3 presents the main steps taking into account in each scenario for the comparison. For scenarios 1 and 2, the final product is aluminium ingots, while for scenario 3 the final product is aluminium shot. In any case, scenarios meet the functional unit.
Fig. 3 Presentation of the 3 scenarios and main step of the production process
3.1. Scenario 1: Primary Aluminium
The Fig. 3 presents the intermediate steps required to obtain aluminium primary ingots (and included in the modelling) for primary aluminium datasets. The various steps shown in Fig. 3 can be carried out in multiple locations. This results in transport between sites, in the case of the study the total distance
travelled is 11 413 km (11 056 km by sea, 336 km by road and 21 km by train).
The scenario for primary aluminium comes from Ecoinvent data. The data used for the study is aluminium production, primary, ingot. In this case, the final transport to the market is not taken into account, but all the upstream transformation steps are included in the boundaries. The choice falls on this
4 Guilhem Grimaud / PROCIR-D-15-01666 data also for the aluminium purity. At this stage of the
production process, the aluminium contains only 1,08% silicon and the overall purity is 98,9.
The modelling of primary aluminium is based on the average of primary aluminium production for the European market. The technologies take into account correspond to the up-to-date technologies used in Europe. The electricity mix used by the primary aluminium industry is a specific electricity mix. Modelling this mix relies on the compilation of specific data for all European primary aluminium producers. This mix is made up with over 80% from hydroelectric power, 8.7% of electricity from nuclear and the remaining part comes from fossil fuel.
3.2. Scenario 2: Conventional Aluminium Recycling
Scenario 2 provides the modelling of the traditional aluminium recycling solution. This scenario is based on shredding steps and melting purification step made by refiners. As for scenario 1, the scenario 2 is based on European remelter average values. The data was compiled by the EAA and provided in Ecoinvent database. The electricity mix used in the modelling is equivalent to the electricity mix provide by the European Network of Transmission System Operators for Electricity. It is mainly fossil fuel (48,3%), nuclear power (28,1%) and renewable energy (23,6%). The distance of transport takes into account for the scenario 2 is 322 km (20 km on water, 109 km by train and 193 km by road).
In Ecoinvent, there are 2 data collections. One data collection was done for production scraps (new scrap) and the other one for post-consumer scrap (old scrap). The processes used for recycling new and old scraps are not the same. New scrap needs less operation than old scraps. The inbound logistics is also different because some of the waste is recycled directly on production plants. For the study the ratio between old and new scrap is based on European aluminium mix [26]. In 2013, old scrap represents 46,3% of aluminium recycled in Europe and new scrap 53,7%. After the recycling process, there are 2 outlets possible: wrought or cast aluminium. For the study, the choice falls on wrought aluminium because it has sufficient purity required by the functional unit (97%). The data chosen for the study is Aluminium, wrought alloy {RER}| Secondary, production mix.
3.3. Scenario 3: MTB Cables Recycling
An intensive inventory analysis was developed during an internal survey conducted in collaboration with EVEA consultants firm at MTB Recycling plant during autumn 2014. Foreground data are based on measurement and on stakeholder interviews. Collection of background data comes from Ecoinvent v3.1 or relevant literature.
For this scenario, the distance of transport takes into account is 540 km for old scraps and 510 km for new scrap from various cable manufacturers. The intrinsic aluminium quality reaches at least 99.6% of aluminium purity (average quality check during the period 2012–2014).
MTB Recycling has an environmentally friendly strategy at a strategic level. As a consequence, they subcontracted with an energy provider that ensures an electricity mix from renewable energy source. Electricity comes almost exclusively from hydroelectric power (96,92% from alpine reservoirs and 2,4% from run of river). The remaining electricity comes from waste to energy plants (0,51%) and from cogeneration plants (0,17%).
4. Results
4.1. Impact Assessment Method
Table 1 Indicators selected for the life cycle impact assessment [28]
Indicators Model
Climate change Baseline model of 100 years of the IPCC
Ozone depletion Steady-state ODPs 1999 as in WMO assessment
Human toxicity, non-cancer
effects USEtox model v1.04 [29] Particulate matter RiskPoll model
Ionizing radiation HH Human health effects model as developed by Dreicer Photochemical ozone
formation LOTOS-EUROS Acidification Accumulated Exceedance Freshwater eutrophication EUTREND model Freshwater ecotoxicity USEtox model
Water resource depletion Pfister water scarcity v1.01 [30] Mineral, fossil & ren resource
depletion CML 2002
The Table 1 presents the models of selected indicator of the Life Cycle Impact Assessment (LCIA) method. The two models in italics in the Table 1 are models replace compared to the recommended ILCD 2011 impact assessment methodology [31], which was used throughout the study. The ILCD method is used with 2 modifications on calculation factors:
Human toxicity, non-cancer effects Water resource depletion
A sensitivity analysis on the characterisation method was conducted using the ReCiPe Midpoint v1.1 method and CML IA Baseline v3.01 methods. This analysis has not yielded conflicting results.
4.2. Comparison of the 3 Scenario
The Fig. 4 draw the comparison for the three scenarios. The calculations were made using the specific electricity mix for each scenario. As expected the scenario 1 emerges as far more significant on all indicators with the exception of freshwater eutrophication where recycling aluminium (scenario 2) takes the lead. The scenario 2 (Al secondary) has the highest impact, even higher than primary aluminium (scenario 1) on the freshwater eutrophication impact category as can be seen in
Fig. 4, because it requires the addition of alloying metals to aluminium production. The addition of alloying elements is required to supply the market with aluminium alloys that meet the market constraints. Copper is the principal alloying element modelled in Ecoinvent 3.1, indeed production chain requires sulphuric tailing representing 96.4% of the impact on the freshwater eutrophication impact category. This result seems to be a modelling error into Ecoinvent 3.1. The study does not
account this result from LCA to draw conclusions. Average secondary aluminium reaches approximately 10% of the impact of the primary aluminium scenario. And MTB aluminium shot is close to 5% of the primary aluminium impact on all the set of indicators. Those results correspondent to evaluation already done and meet the values given by the Bureau of International Recycling (BIR) for aluminium recycling benefits [32].
Fig. 4 Characterisation of the 3 scenarios with specific electricity mix
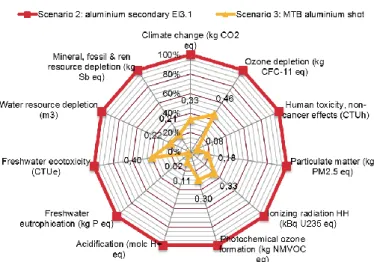
4.3. Recycling Scenario Comparison
Fig. 5 Comparison of the characterisation of the 2 recycled scenarios, equivalent electricity mix
In previous characterisation, the difference between scenarios 2 and 3 are not clearly shown on the representation. The Fig. 5gives the opportunity to compare more specifically the two recycling scenarios. The same values are used for the representation of Fig. 4 and Fig. 5. On the Fig. 5, the impacts are still presented using the specific electricity mix for the 2 recycling scenarios.
On the set of indicators, the impact of scenario 3 does not exceed the impact of scenario 2. In addition, the impact of MTB recycling scenario represents between 2% and 46% of the impact of recycling by melting. The average impact of the solution is halved.
4.4. Uncertainty Analysis for Recycling Scenarios
An uncertainty analysis was conducted between the 3 scenarios. With the specific electricity mix, the uncertainty between scenarios 2 and 3 do not exceed 5% on all the indicators. Except human toxicity indicators (8%) and the water resource depletion indicator (45%). With equivalent electricity mix, the uncertainty exceeds 5% on 3 indicators: ozone depletion (11%), human toxicity, non-cancer effects (9%) and water resource depletion (45%). The conclusions of the study are strong with respect to the weak uncertainties on the characterisations.
4.5. Details About MTB Recycling Process
The Fig. 6 shows the results for the characterisation of the MTB aluminium shot, with the specific renewable electric mix used by MTB. The values used for representation in Fig. 6 are given on the figure. The results show a very strong contribution from the upstream transport for the collection of waste in the total impact of the scenario. On the set of indicators, the MTB
6 Guilhem Grimaud / PROCIR-D-15-01666 recycling steps represents between 11,4% and 79,7% of the
total impact. The average of the 11 indicators brings up an average impact of 36,1% and a median of 33,0%.
When characterisation uses the European electricity mix, all the recycling stages of MTB scenario represents on average 50% of the total impact on the set of indicators.
Fig. 6 Characterisation of MTB aluminium shot with purity of 99.6% specific electricity mix
5. Discussion and Conclusion
The shredding steps are on average 2 times more impacting than mechanical separation steps. Work on the efficiency of the shredder is necessary to reduce the electricity consumption of this step. However, LCA also allowed showing the shredder consumables (steel blades and screens) as elements with a high impact in proportion to their mass. MTB and subcontractors have launched tests with new alloys to increase longevity of screens and blades.
This study allows us to establish a hierarchy between environmental recycling solutions for aluminium cables. Whatever the electricity mix used by the recycling plant, the MTB mechanical recycling process is the most environmentally friendly.
This study also highlights the need to develop green recycling processes. MTB Recycling scenario has a black dot, plastics from the cable sheaths are not all recycled yet. It is essential to find recycling methods for these plastics. Following this study, the company has initiated a development approach to sort and recycle these plastics. A first prototype was developed in late 2015.
This study also demonstrates that recycling when driven without loss of quality is a relevant alternative to mining.
Acknowledgements
This work was performed within the help of Marie Vuaillat from EVEA Consultancy firm and with financial support from French Agency for Environment and Energy Efficiency (ADEME).
References
[1] European Aluminium association (EAA), “Environmental Profile Report for the European Aluminium Industry 2008,” no. April. Brussels, p. 84, 2008.
[2] JRC - Institute for Environment and Sustainability, “The International Reference Life Cycle Data System (ILCD)
Handbook,” in The International Reference Life Cycle Data System (ILCD) Handbook - First Edition, European C., Brussels: European Commission, 2012, p. 72.
[3] M. Bertram, M. Hryniuk, G. Kirchner, and F. Pruvost, Aluminium Recycling in Europe. Brussels: EAA/OEA Recycling Division, 2006.
[4] G. Liu and D. B. Müller, “Addressing sustainability in the aluminum industry: a critical review of life cycle assessments,” J. Clean. Prod., vol. 35, pp. 108–117, Nov. 2012.
[5] C. E. Bruzek, A. Allais, D. Dickson, N. Lallouet, K. Allweins, and E. Marzahn, Eco-Friendly Innovation in Electricity Transmission and Distribution Networks. Elsevier, 2015.
[6] F. Goodwin, S. Guruswamy, K. U. Kainer, C. Kammer, W. Knabl, A. Koethe, G. Leichtfried, G. Schlamp, R. Stickler, and H. Warlimont, “Metals,” in Springer Handbook of Condensed Matter and Materials Data, no. 1, W. Martienssen and H. Warlimont, Eds. Berlin: Springer Berlin Heidelberg, 2005, pp. 161–430.
[7] G. Rombach and B. Friedrich, “Future Potential and Limits of Aluminium Recycling,” in Resource-orientated Analysis of Metallic
Raw Materials, W. Kuckshinrichs and P. N. Martens, Eds. Jülich: Matter and Materials, 2003, p. 13.
[8] European Aluminium association (EAA), Global Aluminium Recycling : A Cornerstone of Sustainable Development. London: International Aluminium Institute, 2006.
[9] D. Paraskevas, K. Kellens, W. Dewulf, and J. R. Duflou, “Sustainable Metal Management and Recycling Loops : Life Cycle Assessment for Aluminium Recycling Strategies,” 20th CIRP Int. Conf. Life Cycle Eng., pp. 404–408, 2013.
[10] J. M. Allwood, “Squaring the Circular Economy : The Role of Recycling within a Hierarchy of Material Management Strategies,” in Handbook of Recycling, Amsterdam: Elsevier Inc., 2014, pp. 445–477.
[11] Union Technique de l’Électricité (UTE), UTE C30-202 - Insulated cables and flexible cords - System for cable designation. Paris, France, 1990, p. 8.
[12] European Aluminium association (EAA), “Aluminium for Future Generations : Progressing through dialogue.” Brussels, p. 52, 2003. [13] European Aluminium association (EAA), “Sustainability of the
european aluminium industry.” Brussels, p. 56, 2010. [14] M. Goedkoop, M. Oele, J. Leijting, T. Ponsioen, and E. Meijer,
Introduction to LCA with SimaPro. Netherlands: Pré Consultants, 2013.
[15] G. Wernet, “Introduction to the ecoinvent version 3.1 database,” in Ecoinvent User Meeting, 2014, p. 24.
[16] B. P. Weidema, “Ecoinvent database version 3 – the practical implications of the choice of system model,” St. Gallen, Switzerland, 2012.
[17] B. P. Weidema, C. Bauer, R. Hischier, C. Mutel, T. Nemecek, J. Reinhard, C. O. Vadenbo, and G. Wernet, Overview and methodology. Data quality guideline for the ecoinvent database version 3, Ecoinvent., vol. 3, no. 1. St. Gallen, Suisse, 2013. [18] JRC - Institute for Environment and Sustainability, “Specific guide
for Life Cycle Inventory data sets - EUR 24709 EN,” in The International Reference Life Cycle Data System (ILCD) Handbook - First Edition, Brussels: European Commission, 2010, p. 142. [19] International Standard Organization, ISO 14040 - Environmental
management — Life Cycle Assessment — Principles and Framework, vol. 3. International, 2006, p. 28.
[20] International Standard Organization, ISO 14044, Environmental management — Life cycle assessment — Requirements and guidelines, vol. 2006. Geneva, 2006, p. 54.
[21] O. Jolliet, M. Saadé, P. Crettaz, and S. Shaked, Analyse du cycle de vie: Comprendre et réaliser un écobilan. PPUR Presses
polytechniques, 2010.
[22] L. Grisel and P. Osset, L’analyse du cycle de vie d'un produit ou d'un service: Applications et mises en pratique. Afnor éditions, 2008.
[23] H. Althaus, S. Blaser, M. Tuchschmid, N. Jungbluth, and M. Classen, Life Cycle Inventories of Metals - Final report ecoinvent data v2.1, No 10, EMPA Düben., no. 10. Dübendorf, CH, 2009. [24] E. Ruiz Moreno, B. P. Weidema, C. Bauer, T. Nemecek, C. O.
Vadenbo, K. Treyer, and G. Wernet, Documentation of changes implemented in ecoinvent database 3.0, The Ecoinv., vol. 0, no. 5. St. Gallen, Switzerland: ecoinvent report No. 5 (v3), 2013. [25] E. Ruiz Moreno, T. Lévová, G. Bourgault, and G. Wernet,
Documentation of changes implemented in ecoinvent - Version 3.1,
Ecoinvent., vol. 1. Zurich, 2014.
[26] International Aluminium Institute (IAI), “Aluminium Mass Flow Europe 2013,” in Regional Mass Flow Models - Part A, World Alum., London, 2014, p. 8.
[27] European Aluminium association (EAA), “Environmental Profile Report for the European Aluminium Industry April 2013,” no. April. p. 78, 2013.
[28] JRC - Institute for Environment and Sustainability, ILCD Handbook: Recommendations for Life Cycle Impact Assessment in the European context. Brussels: European Commission, 2011. [29] R. K. Rosenbaum, T. M. Bachmann, L. S. Gold, M. a. J. Huijbregts,
O. Jolliet, R. Juraske, A. Koehler, H. F. Larsen, M. MacLeod, M. Margni, T. E. McKone, J. Payet, M. Schuhmacher, D. Meent, and M. Z. Hauschild, “USEtox—the UNEP-SETAC toxicity model: recommended characterisation factors for human toxicity and freshwater ecotoxicity in life cycle impact assessment,” Int. J. Life Cycle Assess., vol. 13, no. 7, pp. 532–546, Oct. 2008.
[30] R. Frischknecht, R. Steiner, and N. Jungbluth, “The Ecological Scarcity Method – Eco-Factors 2006. A method for impact assessment in LCA,” Environ. Stud. No. 0906, p. 188, 2009. [31] JRC - Institute for Environment and Sustainability,
Characterisation factors of the ILCD Recommended Life Cycle Impact Assessment methods - EUR 25167. Brussels: European Commission, 2012.
[32] Bureau of International Recycling, “A Report on the environmental benefits of recycling – A critical review of the data for aluminium,” Alum. Int. TODAY, pp. 4–7, 2010.

![Table 1 Indicators selected for the life cycle impact assessment [28]](https://thumb-eu.123doks.com/thumbv2/123doknet/7371096.214704/5.892.452.827.356.706/table-indicators-selected-life-cycle-impact-assessment.webp)